R esear ch Ar ticle In door/Outdoor Air flo w
and Air Qualit
y
E-mail: [email protected]
Numerical evaluation of ventilation performance in children day care
centres
João Carlos Viegas1 (), Susana Nogueira1, Daniel Aelenei2, Hildebrando Cruz1, Manuela Cano3, Nuno Neuparth4,5
1. Laboratório Nacional de Engenharia Civil, Av. do Brasil 101, 1700-066 Lisboa, Portugal
2. Universidade Nova de Lisboa, Faculdade de Ciências e Tecnologia, Campus da Caparica, 2829-516 Caparica, Portugal 3. Instituto Nacional de Saúde Dr. Ricardo Jorge IP, Av. Padre Cruz, 1649-001 Lisboa, Portugal
4. Serviço de Imunoalergologia, Hospital de Dona Estefânia, Centro Hospitalar de Lisboa Central, EPE, Lisboa, Portugal 5. CEDOC, Faculdade de Ciências Médicas, Universidade Nova de Lisboa, Lisboa, Portugal
Abstract
Modelling of ventilation is strongly dependent on the physical characteristics of the building of which precise evaluation is a complex and time consuming task. In the frame of a research project, two children day care centres (CDCC) have been selected in order to measure the envelope air permeability, the flow rate of mechanical ventilation systems and indoor and outdoor temperature. The data obtained was used as input to the computer code CONTAM for ventilation simulations. The results obtained were compared with direct measurements of ventilation flow from short term measurements with CO2 tracer gas and medium term measurements with perfluorocarbon
tracer (PFT) gas decay method. After validation, in order to analyse the main parameters that affect ventilation, the model was used to predict the ventilation rates for a wide range of conditions. The purpose of this assessment was to find the best practices to improve natural ventilation. A simple analytical method to predict the ventilation flow rate of rooms is also presented. The method is based on the estimation of wind effect on the room through the evaluation of an average factor
( ¥) *
2 Δ /P ρ and on the assessment of relevant cross section of gaps and openings combined in series or in parallel. It is shown that it may be applied with acceptable accuracy for this type of buildings when ventilation is due essentially to wind action.
Keywords
children day care centre, air permeability, tracer gas, PFT, CONTAM Article History Received: 14 July 2014 Revised: 28 August 2014 Accepted: 24 September 2014
© Tsinghua University Press and Springer-Verlag Berlin Heidelberg 2014
1 Introduction
Children spend most of their time at home or at children day care centres (CDCC) (Ashmore and Dimitroulopoulou 2009). Therefore, their exposure to poor indoor air quality (IAQ) is likely to affect their health. One of the purposes of ventilation is to provide good IAQ, which is expected to have a significant influence on building occupant’s health. The need for studies on the relation between building´s physical characteristics and the indoor environment in children day care centres led an interdisciplinary team of researchers to develop the project ENVIRH, funded by the Portuguese Foundation for Science and Technology (FCT). The project objectives are to study the physical and ventilation
characteristics of the buildings, the indoor air quality and the children’s health and how to improve the indoor air quality. Modelling the ventilation is a useful tool for increasing understanding of the causes of poor indoor air quality evaluated from field measurements and for finding the ventilation means and practices that best meet the air quality needs of these particular buildings. The purpose of this paper is to present and discuss the results obtained by modelling the ventilation of two CDCC and investigate how it is possible to improve the ventilation and indoor air quality even when it is not possible to refurbish the ventilation system.
Many of the existing CDCC in Portugal are old buildings that have been retrofitted by replacing old external windows with new, which usually have much lower air permeability.
List of symbols
A gap or opening area (m2)
Ab body surface area (m2)
CD discharge coefficient
Cp wind pressure coefficient
f reverse flow fraction g gravity acceleration (m/s2)
G CO2 human emissions (L/s)
h height between the neutral plane and the centre
of the opening (m) H body height(m) m body mass (kg) M metabolic rate (W/m2) Q flow rate (m3/h) Qp air permeability (m3/(h·m))
Q0 reference flow rate (m3/h)
Qoa flow of outdoor air (m3/h)
T indoor temperature (K)
UCO2 CO2 concentration estimated expanded
uncertainty (ppm)
UQ flow rate estimated expanded uncertainty (m3/s)
UT temperature estimated expanded uncertainty (℃)
vwind wind velocity (m/s)
P pressure difference (Pa) ΔP0 reference pressure (Pa)
air density (kg/m3)
ξ friction loss coefficient
The questions that this work wants to answer are: Is the overall air permeability so low that it impacts the indoor air quality of these CDCC negatively? Is it possible to reach an acceptable indoor air quality by improving ventilation by just asking teachers to follow procedures of opening and closing the windows and doors at certain times and over certain periods? Do these procedures have a significant comfort impact on children? Is the installation of a natural ventilation system compliant with the indoor air quality requirements or is it necessary to adopt mechanical ventilation systems?
These research questions are of great interest, many cases of inadequate indoor air quality due to poor ventilation being reported in the literature (Van Dijken et al. 2006; Mumovic et al. 2009; Borodinecs and Budjko 2009; Norbäck et al. 2011), and solutions to this problem have to be found to solve it immediately (new user’s procedures to improve ventilation may be applied immediately). Because natural ventilation solutions are less expensive to run it is important to show that they can also provide adequate ventilation rates in the particular case of CDCC which are typically low rise buildings sheltered by other buildings.
In this work two different buildings are studied in order to answer the above questions. A simple analytical method for calculation of the ventilation flow rates is tested against results obtained from experimental measurements and then used for the identification of the best strategies to adopt for improving the indoor air quality. It is believed that the methodological approach followed, the results obtained for these two buildings and the possibility of using a simple method for the prediction of the ventilation rates with a reported accuracy would be beneficial for the scientific community as it may be used as a benchmark for other studies.
There is strong and sufficient evidence to demonstrate the association between ventilation, air movements in
buildings and the transmission or spread of infectious diseases such as measles, tuberculosis, chickenpox, influenza, smallpox and SARS (Li et al. 2007). It is reported that airborne infection risk in large naturally ventilated hospital wards increases when ventilation rates decrease (Gilkeson et al. 2013). Sundell et al. (2011) referred that multiple health endpoints show similar relationships with ventilation rate and that there is biological plausibility for an association of health outcomes with ventilation rates. Higher ventilation rates in offices, up to about 25 L/s per person, are associated with reduced prevalence of sick building syndrome (SBS) symptoms. The limited available data suggest that infla-mmation, respiratory infections, asthma symptoms and short-term sick leave increase with lower ventilation rates. This indicates that increasing ventilation rates above currently adopted standards and guidelines should result in reduced prevalence of negative health outcomes (Sundell et al. 2011). Based on a Swedish survey, multivariate linear regression models revealed that air exchange rate was a significant predictor of the concentrations of indoor pollutants (Langer and Bekö 2013); therefore, in this paper air exchange rate will be used to compare the performance of simulated ventilation schemes. Indoor air quality depends not only on ventilation rates, but also on indoor pollutant sources, occupant’s behaviour and outdoor air pollution (Jantunen 2006; Bruno et al. 2008).
Specifically in schools, commonly reported indoor con-taminants are (Daisey et al. 2003): (i) total volatile organic compounds, formaldehyde (HCHO) and microbiological contaminants; (ii) microbiological contaminants (including allergens in deposited dust, fungi and bacteria); (iii) airborne bacteria and airborne and surface fungal spores; (iv) levels of specific allergens sufficient to cause symptoms in allergic occupants. A few studies investigating causal relationships between health symptoms and exposures to specific pollutants
suggest that such symptoms in schools are related to exposures to volatile organic compounds (VOCs), moulds and microbial VOCs and allergens (Daisey et al. 2003). Several studies revealed poor ventilation conditions associated with high levels of bacteria, fungi and chemical compounds including carbon dioxide (Van Dijken et al. 2006; Mumovic et al. 2009; Borodinecs and Budjko 2009; Norbäck et al. 2011) and often related with high accumulation of other indoor pollutants (Freitas et al. 2011). Ventilation and CO2
con-centration reported data strongly indicate that ventilation is inadequate in many classrooms possibly leading to health symptoms (Daisey et al. 2003). Also in schools, children exposed to CO2 levels>1000 ppm showed a significantly
higher risk for dry cough and rhinitis (Simoni et al. 2010). Significant increases of total biological particle mass and bacterial genome concentrations were observed during the occupied period compared to the vacant case (Qian et al. 2012). Children attending CDCC have been reported to be more prone to infectious diseases when compared with those cared for at home, and are exposed to conditions that may increase the risk of allergies and asthma (Zuraimi et al. 2007; Hagerhed–Engman et al. 2006; Cartieaux et al. 2011; Ochoa Sangrador et al. 2007). IAQ has not just impacts on health but also seems to have impact on students’ per-formance increasing the error rate (Twardella et al. 2012).
Ventilation is able to reduce the concentration of indoor pollutants when released by indoor sources (Linden 1999; Awbi 2003). Therefore, the prediction of ventilation performance of buildings is an engineering problem very relevant for the health condition of children in CDCC. Several methods have been developed to predict ventilation performance in buildings, namely analytical models, empirical models, small-scale experimental models, full-scale experi-mental models, multizone network models, zonal models, and Computational Fluid Dynamics (CFD) models (Chen 2009). The multizone models, such as CONTAM (Walton and Dols 2013), are the main tools for predicting ventilation performance in an entire building and have been widely used to predict airflow, pressure, and contaminant distribution in buildings under wind and stack effect actions (Khoukhi et al. 2007; Maatouk 2007; Sohn et al. 2007; Janssen 2003; Bojic and Kostic 2006). Because the uncertainty that affects the results is mainly due to the quality of the input data it would be important to compare the computer code results with measurements (Janssen 2003) and/or use field measurements (eg., air-tightness measurements) to fit the model coefficients (Labat et al. 2013). It must be stressed that multizone models consider that every compartment is a single control volume where the quantities are averaged. In fact the concentration of pollutants may vary inside the room, depending on the source location and on the ventilation flow pattern (this last aspect is overcome when
ventilation effectiveness is considered). This becomes another source of error. To fully overcome these sources of error a higher refinement of the calculation mesh is required; this is the domain of use of computer fluid dynamics, which is outside of the scope of this study.
In Portuguese climate, cross ventilation due to wind is the main action for natural ventilation. Although it is a complex task, measurements of cross ventilation due to wind in a multizone test building have successfully shown that cross ventilation rate can be correlated to the velocity component of the approaching wind that is normal to the inlet openings (Lo and Novoselac 2012). This supports the approach that will be followed in this work. However, the use of quasi-steady airflows in the prediction of ventilation performance of buildings needs to be done with care as significant differences may be found between the unsteady state airflow rates and the quasi-steady airflow rates when the fluctuating component is larger than the mean component (Park 2013). To verify if the quasi-steady flow approach impairs the simulation results of the present study, a comparison between measured and predicted air change rates is done. As in this research, multizone airflow and contaminant transport simulations have been used in other studies to examine different control strategies and design issues such as ventilation rates, room pressure control and air filtration to control the spread of airborne infectious agents in healthcare facilities (Emmerich et al. 2013).
In the aim of the research project ENVIRH an initial field survey was carried out on 45 CDCC, of which 25 are located in Lisbon and 20 in Oporto (Azevedo et al. 2012). Short term CO2 measurements performed during the survey
have shown, in general, a poor indoor air quality. In order to better understand the causes of the poor air quality, two CDCC were selected for a detailed analysis of building and ventilation characteristics which included computational simulation. The two CDCC, both of which are located in Lisbon, are referred as Lx13 and Lx17. Both were recently refurbished, although they were built in the 19th century and in the 18th century, respectively. Before refurbishment, ventilation was possible due to existence of gaps in the joints of external windows and doors or simply by opening the windows. During the refurbishment the old traditional wooden windows were replaced with aluminium external windows with gaskets applied in the opening joints. Since no ventilation devices have been included in the refurbishment programmes, the replacement of the existing windows with new, low air permeability models has caused an overall reduction in the infiltration rate which in turn may explain the high levels of pollutants.
The aim of this paper is to investigate the problems and the best solutions to the challenge of using ventilation to improve the indoor air quality in CDCC, by: (i) installing
adequate ventilation devices (this solution requires con-struction works in CDCC, therefore has the drawback that it is not possible to adopt immediately) and/or (ii) adopting adequate procedures for opening and/or keeping the windows and doors closed. The second strategy has the advantage over the first in that it is easier to implement and require no capital costs. However, the efficiency of it is questionable as it relies on “user behaviour” with no context awareness or decision support mechanisms available. In order to make the research applicable to other CDCC, the development of a simplified method for ventilation calculation is needed. An analysis of the reliability of this simplified calculation method is also given in order to ensure transferability to other cases. With this aim a multizone model (CONTAM) was used to simulate the ventilation and the following objectives were set for this research:
(1) Assess the impact of different ventilation systems in the ventilation rate of CDCC;
(2) Assess the impact of adopting different procedures for opening and/or keeping closed the windows and doors in the ventilation rate of CDCC;
(3) Consider the fact that average flow ventilation rates are available from measurements performed over two weeks in each building, assess the difference between these values (when doors and windows are closed) and the ventilation rate values corresponding to the occupancy periods;
(4) Develop a simplified method for prediction of ventilation flow rates of other similar buildings;
(5) Provide recommendations to improve the ventilation performance of CDCC.
The original contributions of this paper are related with the overall method used to perform this study (that is described in Section 2.1), the development of a simplified method (that is described in Sections 2.6 and 3.7) for prediction of ventilation flow rates of other similar buildings (including the use of an average factor 2(Δ /P ρ )*
¥ for the
estimation of wind effect on the room) and its reliability analysis, the assessment of the impact of adopting different procedures for opening and/or keeping closed the windows and doors in the ventilation rate of CDCC (that is analysed in Sections 3.5 and 3.6) and providing recommendations to improve the ventilation performance of CDCC (see paragraph 11 of the Section 3.8).
2 Methods
2.1 General
The methodology proposed in this paper consists of the following steps:
(1) Preliminary site survey and CO2 concentration
measu-rements in selected rooms (this step was relevant for the selection of the CDCC to be studied in detail with simulation tool);
(2) Measurement of the air permeability of the envelope (boundary data for simulation);
(3) Measurement of the air permeability of internal doors (boundary data for simulation);
(4) Short term CO2 tracer gas decay analysis in order to
obtain reference values for comparison with simulation results;
(5) Medium term perfluorocarbon tracer (PFT) gas decay analysis in order to obtain values of the building ventila-tion under normal use for comparison with simulaventila-tion results;
(6) Computer simulation of the building ventilation under conditions corresponding to CO2 tracer gas decay
analysis;
(7) Computer simulations of the building ventilation under normal use under conditions corresponding to measure-ments with PFT technique;
(8) Computer simulations to assess ways to improve ventilation performance of CDCC.
The multizone ventilation and pollutant transport model, CONTAM (Walton and Dols 2013), was used to perform the simulations. On-site measurements were performed with the view of collecting appropriate input data for CONTAM computer code and for comparison (to verify the corres-pondence with the output data from CONTAM).
2.2 CDCC selection and description
As mentioned above, in the aim of the ENVIRH research project an initial field survey was carried out on 45 CDCC between the months of October and December 2010. In average, three activity rooms were monitored in each CDCC which resulted in a total number of 143 classrooms, 82 in Lisbon and 61 in Oporto. The information collected during survey includes floor area and height of the rooms, type of windows, windows position (open or shut), number of children present in the room, age of children, air temperature (instantaneous reading), relative humidity (instantaneous reading) and indoor and outdoor CO2 concentration
(sampling of 10 to 15 minutes corresponding to time necessary to obtain a stable reading in the equipment). For the measurement of outdoor and indoor air temperature and relative humidity, a digital thermo hygrometer, model Oregon Scientific THGR328N was used; the estimated expanded uncertainty is UT = 1.16 ℃. The carbon dioxide concentration was measured with a non-dispersive infra- red absorption detector Telaire 7001; the estimated expanded
uncertainty is UCO2 = 62 ppm for a measurement of 1000 ppm
and UCO2 = 175 ppm for a measurement of 3000 ppm.
The selection of the 45 CDCC was based on the need of a representative sample from the cities of Lisbon and Oporto. Therefore, 25 of the 48 CDCC in Lisbon and 20 of the 40 CDCC in Oporto have been selected by stratified sampling followed by a cluster analysis, which guaranteed the heterogeneity of schools concerning indoor quality (Azevedo et al. 2012). Later, out of the 45 CDCC, a number of 19 were selected for deeper research using a cluster analysis (Ward’s method) considering indoor carbon dioxide concentrations, relative humidity and temperature measurements. Then, out of this smaller number group of 19 CDCC, a further selection of two was made for ventilation simulation considering the following criteria: (i) age of the retrofitted building (older than 100 years), (ii) levels of CO2
concentration in activity rooms (high levels), (iii) to be inserted in neighbourhood with different density of con-struction (in order to have different wind actions) and (iv) location (in Lisbon due to logistic constraints).
The two CDCC, which are referred to as Lx13 and Lx17, date 19th and 18th century, respectively. Lx13 is located in Lisbon old town (Fig. 1) and has no specific means for room
Fig. 1 Location of Lx13 in Lisbon old town
ventilation, except the kitchen (at level 0) that has mechanical extraction. The airflow rate of the kitchen exhaust (Test 1, Fig. 2) was measured and its value is 0.56 m3/s (expanded
uncertainty is 0.033m3/s
Q
U = ). Lx13 building has 4 inter-connected floor levels (Figs. 2 and 3). The main entrance is located at the ground floor (level 0) where there is a playground in the backyard (Fig. 2). The activity rooms are located at floor levels 1 and 2. Floor levels 0 and 1 are connected by a large staircase while floor levels 1 and 2 are linked with a small enclosed stair case. Due to its position, the door to this last staircase is usually kept closed. The upper floor level (level 3) is an attic that was refurbished and transformed in a playroom. Floor levels 2 and 3 are linked by an unenclosed stair case.
Lx17 is located in an old village, now included into the urban zone of Lisbon (Fig. 4). Just as in the Lx13 case, Lx17 is also missing specific means for room ventilation, except the kitchen (at level 0) that has mechanical extraction. The measured airflow rate (Test 1, Fig. 5) is 0.80 m3/s (expanded
uncertainty is UQ=0.059 m3/s). Lx17 building has 2 inter-connected floor levels (Fig. 5). The main entrance is located at the ground floor (level 0) and there are connections to a playground in the backyard (Fig. 5) at level 1. The floor levels 0 and 1, where are located the rooms for activities, are connected by a large unenclosed staircase.
Although both exhaust rates in kitchens were measured, it was determined by visual observation in both CDCC that kitchen internal doors are kept closed and windows are kept opened during the cooking process. The exhaust fans are only used during cooking process and, in both cases, kitchens are distant from activity rooms. Therefore, the active ventilation does not influence the ventilation of the activity rooms of the building. On the basis of these
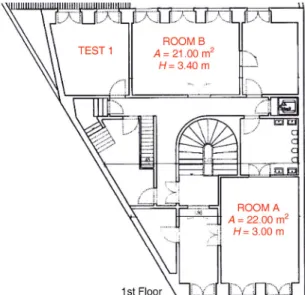
Fig. 3 Sketch of the 2nd floor of Lx13 and location of the studied rooms
Fig. 4 Location of Lx17 in an old village (now located in Lisbon) considerations, it was concluded that it was not necessary to include kitchen exhaust fans in simulations.
The internal doors of both CDCC are made of wood (probably the original ones) where there can be observed large gaps in the opening joints. The main entrance doors at floor level 0 are also made of wood and have similar characteristics to the internal doors. The other external doors are made of aluminium, but because there is no framing profile in the ground sill, there are large gaps in the lower opening joint. In the case of Lx17, the three rooms to the street at floor level 0 have large wooden gates (probably the original ones) with significant gaps in the opening joints.
Table 1 shows selected results obtained during the initial field survey for these CDCC, where it can be seen that the CO2 concentrations found in activity rooms exceed in general
the ASHRAE recommended values (ASHRAE Standard 62.1 (ASHRAE 2004)). Some of the Lx17 activity rooms (A, B and C) are in a separate building which was not included in this study.
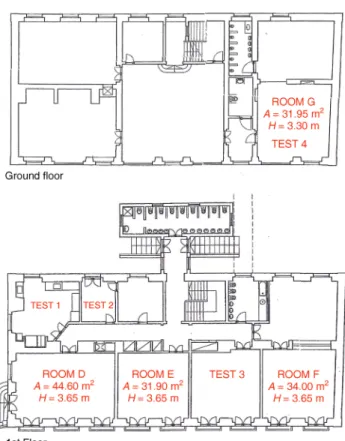
Fig. 5 Sketches of Lx17 levels and location of the studied rooms
Table 1 Observed conditions at Lx13 (2010-11-17) and Lx17 (2010-11-04) (0: closed; 1: opened) CDCC Lx13 Lx17 Room A B C D D F Room temperature (℃) 20.1 20.3 19.3 20.3 23.8 22.7 Number of children+adults 9+2 10+2 15+2 14+2 33+2 6+2 Time of measurement 15:55 16:30 15:35 15:15 14:20 14:45 Room CO2 concentration (ppm) 1330 940 1080 1640 2208 1608 External window 0 1 0 0 0 0 Internal door 0 0 1 0 0 0 Outdoor temperature (℃) 20.1 24.0 Wind velocity (m/s) 6.8 3.1 Outdoor CO2 concentration (ppm) 468 505
2.3 Envelope air permeability measurement
The most important air paths in the building envelope of both CDCC are associated to gates, doors and windows. As the aluminium windows/doors were very homogeneous in each CDCC (because they were manufactured and installed by the same manufacturer during the same contract), it was assumed that only one on-site air permeability test was
needed to perform for each type of window or door. The tests were carried out twice using a blowing door: one with the windows joints sealed with tape and another without the tape. The blowing door is a device that is able to pressurize or depressurize the room and to measure the flow rate necessary to keep the indoor pressure stable and to measure that pressure. The true air permeability Qp was obtained
by computing the difference between both test results. The tests were carried out creating a positive and a negative pressure differential between inside and outside. However, since during the depressurization some portions of the tape were blown off by air pressure, the air permeability in this case is only a rough estimation. The measured air permeability Qp under positive pressure differential P per length unit of
opening joint (pressurization) is presented in Table 2. The estimated expanded uncertainty is 2% of the values presented in Table 2.
In general, it was estimated that the performance of windows, doors and gates in terms of air permeability for both, depressurization and pressurization tests, is similar. However, for casement door height windows of Lx13 the air permeability under depressurization is considered 2.5 times higher than the correspondent value under pressurization (because the negative pressure inside room moves the casement in the opening direction, thus increasing the air gaps in the opening joints and this behaviour was clearly perceived in tentative tests under negative pressure). The air permeability of the internal doors is dominated by a large gap between the casement and the sill, whose dimensions are not affected by the pressure tests. The gaps between the casement and the ground sill of the external aluminium doors at floor level 0 of Lx13 and at floor level 1 of Lx17, were measured and characterised in terms of air permeability with Eq. (1), appropriate for turbulent flows for gaps, where CD is the discharge coefficient (CD = 0.61), A is the gap area
Table 2 Air permeability of gates, doors and windows
Window/door type Lx13 Lx17 Sliding windows 0.8 p 0.14Δ Q = P m3/(h·m) (Test 2, Fig. 2) — Casement door height windows 0.7 p 0.10Δ Q = P m3/(h·m) (Test 3, Fig. 3) 0.5 p 1.0Δ Q = P m3/(h·m) (Test 3, Fig. 5) Internal wooden doors 0.5 p 24Δ Q = P m3 /(h·m) (Test 3, Fig. 3) 0.5 p 6.3Δ Q = P m3 /(h·m) (Test 2, Fig. 5) Wooden gates — 0.6 p 39Δ Q = P m3 /h (Test 4, Fig. 5) Bottom-hung windows — 0.5 p 3.2Δ Q = P m3/(h·m) (Test 4, Fig. 5) Casement side- hung windows — 0.5 p 0.045Δ Q = P m3/(h·m) (Test 4, Fig. 5)
and ρ¥ is the air density (Awbi 2003).
D
2ΔP
Q C A
ρ¥
= (1)
2.4 Tracer gas measurements
In order to measure the air exchange rate, CO2 short term
tracer gas concentration tests were performed using the decay method. The measurements, which were carried out in the same rooms where the air permeability performance of the windows was measured, are summarized as follows: Test 2 (Fig. 2) carried out on 2011-11-15 and Test 3 (Fig. 3) carried out on 2011-11-14, for Lx13; Test 3 and Test 4 carried out for Lx17 on 2011-11-08 and on 2011-11-17, respectively (Fig. 5). The tests consisted in the release of the bottled CO2 into the room in the beginning of the test
and in the measurement of the concentration decay over two hours. The measurements were carried out with two portable gas analysers (GFG trade mark) placed at different locations of the room where CO2 concentration were
averaged (expanded uncertainty of 0.0015 h–1). The testing
room doors and windows were shut during the measure-ments. In order to obtain a homogeneous mixture of the CO2 in the indoor air, a fan was operated inside the room
during the measurements. The results obtained are shown in Tables 3 and 4 together with corresponding expanded uncertainties.
Medium term tracer gas concentration tests (about two weeks) were carried out continuously during the summer period between 2011-09-14 and 2011-09-28, for Lx13, and between 2011-09-13 and 2011-09-28, for Lx17. In the winter period they were carried out continuously between 2012-01-10 and 2012-01-26, for Lx13, and between 2012-01-09 and 2012-01-24, for Lx17. The ventilation measurements were performed using a PFT passive tracer gas technique (Dietz et al. 1986; Stymne et al. 1994). The purpose of these tests was to assess the air change rate in a number of activity rooms in the children day care centres during normal use. Passive tracer gas sources were positioned in each room, with tracer gas constant emission rates adjusted to the room volumes, so that the emission is homogeneous in the whole building. The concentration of tracer gas in studied rooms was measured with a passive sampler. The PFT sources and samplers were supplied by PENTIAQ A.B. Sweden, which was also responsible for performing the analysis of the passive samplers.
The Lx13 testing rooms are shown in the Figs. 2 and 3 as Rooms A to E while the Lx17 testing rooms are shown in Fig. 5 as Rooms D to G. The results obtained (including estimated uncertainties) are shown in Tables 5 to 8.
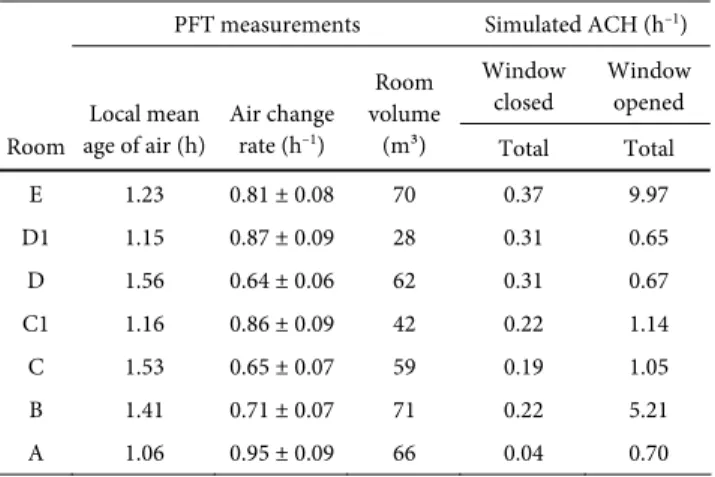
Table 5 Lx13 PFT gas tracer summer measurements and simulation results
PFT measurements Simulated ACH (h–1) Window closed Window opened Room Local mean age of air (h) Air change rate (h–1) Room volume (m3) Total Total E 1.23 0.81 ± 0.08 70 0.37 9.97 D1 1.15 0.87 ± 0.09 28 0.31 0.65 D 1.56 0.64 ± 0.06 62 0.31 0.67 C1 1.16 0.86 ± 0.09 42 0.22 1.14 C 1.53 0.65 ± 0.07 59 0.19 1.05 B 1.41 0.71 ± 0.07 71 0.22 5.21 A 1.06 0.95 ± 0.09 66 0.04 0.70
Table 6 Lx13 PFT gas tracer winter measurements and simulation results
PFT measurements Simulated ACH (h–1) Window closed Window opened Room Local mean age of air (h) Air change rate (h–1 ) Room volume (m3) Total Total E 4.50 0.22±0.02 70 0.22 9.0 D1 5.57 0.18±0.02 28 0.19 0.55 D 4.51 0.22±0.02 62 0.19 0.50 C1 7.27 0.14 ± 0.01 42 0.15 0.87 C 2.64 0.38 ± 0.04 59 0.13 0.72 B 7.34 0.14 ± 0.01 71 0.17 4.02 A 4.83 0.21 ± 0.02 66 0.04 0.45 2.5 Ventilation modelling
The multizone ventilation model, CONTAM (version 3.0.1.1 (Walton and Dols 2013)) was used to model the airflow in each of the two CDCC under analysis. It is a
Table 7 Lx17 PFT gas tracer summer measurements and simulation results
PFT measurements Simulated ACH (h–1)
Room Local mean age of air (h) Air change rate (h–1) Room volume (m3) Window closed Window opened D 2.75 0.36 ± 0.03 163 0.18 0.90 E 3.20 0.31 ± 0.03 113 0.14 1.73 F 3.82 0.26 ± 0.03 124 0.12 1.18 G 1.59 0.63 ± 0.06 105 0.66 2.05
Table 8 Lx17 PFT gas tracer winter measurements and simulation results
PFT measurements Simulated ACH (h–1 ) Room Local mean age of air (h) Air change rate (h–1) Room volume (m3) Window closed Window opened D 8.39 0.12 ± 0.01 163 0.16 0.50 E 5.51 0.18 ± 0.02 113 0.13 0.98 F 8.87 0.11 ± 0.01 124 0.13 0.70 G 6.13 0.16 ± 0.02 105 0.16 1.74
widely used computer code made available to scientific and technical communities by National Institute for Standards and Technology and may be downloaded from internet (http://www.bfrl.nist.gov/IAQanalysis/CONTAM/).
Air exchange between the rooms and the external environment is assumed to occur just via windows and doors. The measured air permeability was extrapolated from the length of the opening joint and from the dimension of the gap between the casement and the ground sill when relevant. The internal doors that during the visits to the buildings have been found usually opened were kept opened in every simulation. The action of the wind on the building envelope may be described as a pressure ΔP which is directly proportional to wind stagnation pressure as described by
Table 3 Lx13 CO2 gas tracer measurements and simulation results
Temperature Wind Air change rate
Location Indoor Outdoor Velocity Direction Measured Predicted
Test room 2 19.0℃ 14℃ 4.89 m/s 235° (0.35 ± 0.01) h–1
0.33 h–1
Test room 3 19.0℃ 14℃ 4.11 m/s 281° (0.42 ± 0.02) h–1
0.41 h–1
Table 4 Lx17 CO2 gas tracer measurements and simulation results
Temperature Wind Air change rate
Location Indoor Outdoor Velocity Direction Measured Predicted
Restaurant 17.0℃ 16.0℃ 1.83 m/s 171° (0.47 ± 0.02) h–1 0.46 h–1
Eq. (2), where Cp is the wind pressure coefficient, ρ¥ is the
air density and vwind is the wind velocity:
2 p wind 1 Δ 2 P=C ρ v¥ (2)
In order to estimate the values of Cp for the location of
external windows and doors, the Cp Generator made available
by TNO Building and Construction Research at the site http://cpgen.bouw.tno.nl was used. The Cp values obtained
in this way were compared with the correspondent values recommended by the standard EN 1991-1-4 (2005). Since the values obtained by the Cp Generator were coherent with
that given by the standard and more detailed than the standardized ones, they were used in the simulations. The pressure coefficients are shown in Fig. 6 where the direction 0° corresponds to north. The label of each curve indicates the direction of the facade, the horizontal distance from the reference and the vertical distance from the reference. The reference for facades of Lx13 building is the lower north corner of each facade. The reference for north and south facades of Lx17 is the lower west corner of the building. The reference for Lx17 west facade is the lower north corner of the building. The pressure coefficient of roof windows of Lx13, which does not depend on wind direction, is –1.0.
Fig. 6 Pressure coefficients for Lx13 (a) and Lx17 (b)
In order to simulate the ventilation conditions corre-sponding to CO2 tracer gas concentration tests, steady-state
conditions were assumed. The weather data is shown in Tables 3 and 4. Transient simulations were carried out for the periods for which results from PFT tracer gas technique measurements are available. For example, the weather conditions for summer period are shown in Fig. 7. Room temperature during summer period in the case of Lx13 varied from 23℃ to 29℃ and averaged 26.1℃ and in the case of Lx17 varied from 22℃ to 30℃ and averaged 25.7℃. During the winter period, the room temperature in the case of Lx13 varied from 13℃ to 19℃ and averaged 16.4℃, and in the case of Lx17 varied from 14℃ to 20℃ and averaged 16.8℃.
CONTAM simulations were also performed to assess the potential improvements in ventilation performance. Three strategies employed with this objective were con-sidered: (i) improving the ventilation through windows and/or doors opening, (ii) using cross ventilation due to wind and (iii) providing mechanical ventilation. The first strategy does not require works on the buildings and it only relies on the procedures that can be adopted by users. It represents the most economical strategy to implement, although it may seriously affect the thermal comfort conditions. Any other possibility requires works to be done in buildings.
Fig. 7 Weather in Lisbon in September 2011 and in January 2012 (dotted lines represent the daily average)
The simulations carried out for both CDCC with the weather data of the year 2012 considered the following scenarios:
(1) Windows and doors are closed; (2) Windows and doors are always opened;
(3) Windows and doors are opened from 9:00 to 18:00 during weekdays;
(4) Windows and doors are opened from 17:00 to 18:00 during weekdays;
(5) Windows and doors are opened from 12:00 to 14:00 and from 17:00 to 18:00 during weekdays;
(6) Windows and doors opened are from 11:00 to 11:15, from 12:00 to 14:00, from 15:00 to 15:15 and from 17:00 to 18:00 during weekdays;
(7) Windows are always opened while doors are closed; (8) Windows are opened from 9:00 to 18:00 during weekdays
while doors are closed;
(9) Doors are always opened and windows are always closed; (10) Doors are opened from 9:00 to 18:00 during weekdays
and windows are closed;
(11) Cross ventilation with self-regulating vents;
(12) Cross ventilation with self-regulating vents and conduits (to avoid airflow crossing other rooms).
(13) Mechanical ventilation (designed to 1 h–1);
For simulations with “windows opened” only one window per activity room was assumed to be opened in the case of Lx17, while in the case of Lx13 all windows are opened.
In scenario 11 self-regulating vents were assumed to be applied to activity rooms and connected spaces in order to provide cross ventilation. The performance of the vents is described by Eq. (3), where Q0 is the reference flow rate
(ventilation rate of 1.0 h–1 was adopted), ΔP is the pressure
difference through the vent, ΔP0 is the reference pressure
(0.8 Pa was adopted) and f is the reverse flow fraction (the value –2 was adopted to provide smaller head loss for outgoing flow when compared with incoming flow; for incoming flow f = 1).
( Δ / Δ0)
0 1 e
P f P
Q= f Q éêë - - ùúû (3) In scenario 12, the self-regulating vents (with the performance given by Eq. (3)) were assumed to be applied through the external wall of the activity room and a conduit is connecting the activity room to the opposite facade. Conduits (and the corresponding openings) are designed to reach a pressure loss of 8.0 Pa for 1.0 h–1 of the activity room
(only in rooms A, B, C and D1 of Lx13 and D and E of Lx17). In scenario 13, exhaust fans are assumed to be applied to each activity room adjusted to 1.0 h–1 (only in rooms A,
B, C and D of Lx13). The same self-regulating vents as before were used as air inlets.
It was assumed that the main sources of CO2 are the
human body emissions. This assumption is justified by the fact that the kitchens are well ventilated and separated from the rest of the rooms by a door normally kept closed. The CO2 human emissions G were estimated according to
Eq. (4), where M is the metabolic rate and Ab is the body
surface area.
5 b
4 10
G= ´ - MA (4) For an average sedentary adult, M=70 W/m2 and A
b=
1.8 m2 (Awbi 2003). For children, the surface A
b is given by
Eq. (5), where m is the body mass and H is the body height.
0.425 0.725
b 0.202
A = m H (5) For children, the 50 percentile was assumed for m and H, according to age (Saúde Infantil e Juvenil: Programa Tipo de Actuação (Direcção-Geral da Saúde 2002)). It was also assumed a metabolic rate of 1.4 met (81 W/m2) in activity
rooms and 1.2 met (70 W/m2) in baby nurseries (ISO 7730
2005). As the number of children in every room may vary from year to year, it was assumed the maximum number of children allowed by Portuguese regulation. Two teachers were considered in each activity room. In the case of Lx17, the allocation of children age to activity room is kept from year to year; therefore, the CO2 emission rate was estimated
considering the average children age corresponding to every activity room. For Lx13 that allocation is not so well defined, therefore the CO2 emission rate corresponding to
a 3-year old child was considered for every activity room.
2.6 Ventilation analysis
In order to better understand the ventilation process of this type of buildings, the results obtained from the simulations were compared with results obtained using a simple analytical approach. The flow rate through an opening characterized by an opening area A and a friction loss coefficient ξ is given by Eq. (6). This equation is similar to Eq. (1), but the CD was replaced by 1 / ξ. The pressure difference term
ΔP is given by Eq. (7), where g is the gravity acceleration, h is the height between the neutral plane (plane where indoor and outdoor pressures are equal) and the centre of the opening and T is the indoor temperature. Together Eqs. (6) and (7) form the quadrature method (Awbi 2003).
1 2ΔP Q A ρ ξ ¥ = (6) 2 p wind 1 Δ 1 2 T P C ρ v ρ g h T ¥ ¥ ¥ = +
(
-)
(7) For the buildings under study, the windows and doors may be considered as a combination of openings (whenwindows or doors are closed the movable joints form these openings) in series, Eq. (8), or in parallel, Eq. (9).
eq 2 1 i i i A ξ ξ A =
å
( )
(8) eq i i i A A ξ =å
ξ( )
(9) It was assumed in scenario 1 (windows and doors are closed), that the physical system corresponds to the associa-tion in series of the head losses of the windows closed (wc), the head losses of the doors closed (dc) and the head losses that occur when the windows and doors are opened (wo+do) (see Eq. (10)). Similarly, scenarios 2 (windows and doors are always opened), 7 (windows are always opened and doors are closed) and 9 (doors are always opened and windows are closed) may be described by Eqs. (11), (12) and (13), respectively. * 1 2 wc 2 dc 2 wo+do 1 Δ 2 P Q ρ ξ ξ ξ A A A ¥ = + +(
) ( )
( )
( )
(10) * 2 2 wo+do 1 Δ 2 P Q ρ ξ A ¥ =( )
( )
(11) * 7 dc wo+do 2 2 1 2 P Q A A ( ) ( )
( )
(12) * 9 2 wc 2 wo+do 1 Δ 2 P Q ρ ξ ξ A A ¥ = +( )
( )
( )
(13)The term (Δ /P ρ¥)* includes now the effect of the wind
pressure and stack effect during the time of simulation. The terms ξ⁄A2 may be assessed by inspection and combining
openings in series or in parallel (Eqs. (8) and (9)). When the terms ξ⁄A2 and one of the terms Q
i are known, any particular Qi term may be estimated. Therefore, the principle of this simplified method is based on the Eqs. (8) and (9) and on the evaluation of the term (Δ /P ρ¥)*.
From these equations it is possible to obtain the Eqs. (14) to (16). 2 2 2 dc 2 wo+do 7 1 ξ Q ξ Q A A é ù =ê - ú ê ú ë
( )
û( )
( )
(14) 2 2 2 wc 2 wo+do 9 1 ξ Q ξ Q A A é ù =ê - ú ê ú ë û( )
( )
( )
(15) 2 2 2 2 1 2 7 9 1 1 1 1 Q + Q = Q + Q( ) ( ) ( ) ( )
(16) The Eq. (16) corresponds to a condition that must be satisfied if the assumption of association in series of head losses is correct. With Eqs. (14) and (15) it is possible to estimate the terms ξ2A given Qi and 2 wo+do
ξ A
( )
.3 Results and discussion
3.1 Simulation of short term tracer gas tests conditions
The results obtained from simulations for CO2 tracer gas
tests are shown in Tables 3 and 4.
The air change rates obtained from the simulations for Lx13 are close to the measured values. This indicates that the set of parameters and data used as input for CONTAM are coherent with the measurements. It should be noted that the days on which the measurements were performed were relatively windy (gentle breeze, according to Beaufort scale) and that the direction of the wind (approximately south-west) favours the occurrence of maximum pressure differences between this building facades. Despite of this, the air change rate is rather low (below 0.5 h–1), which can
be explained by the low air permeability of modern windows and the lack of ventilation devices.
Regarding the measurements in Lx17, they were carried out in a day when the wind velocity was rather low (light air and light breeze, according to Beaufort scale). The simulations in this case indicate also low air change rates (below 0.5 h–1), which are consistent with measurements.
3.2 Simulations for the PFT measurement periods
During the period when the measurements with PFT technique were performed (two weeks), the occupants were asked to behave as they normally would with respect to ventilation. Since during the normal use of the buildings people are opening and closing windows and doors according to their needs (Andersen et al. 2013), it is very difficult to know which of the windows and doors were opened and when and how long. It is reasonable to assume that internal doors are usually closed in order to avoid interference from other people during lessons and that external windows are opened when the weather is good (warm and dry). In the preliminary field survey carried out in these CDCC we observed the characteristics of 6 activity rooms which are shown in Table 1. The visual observations confirm that the windows and doors are not all opened or closed at the same time and that they are usually closed during the heating
season. In general the CO2 concentration is unacceptably
high (higher than 1000 ppm), a fact which indicates a poor ventilation rate. The exceptions are the room B of Lx13, in which external window was opened, and the room C of Lx 13 (although it is higher than 1000 ppm, it is very close to this limit), in which internal door was opened. These observations highlight the importance of windows and doors opening in improving the ventilation in the absence of a properly designed ventilation system.
Due to the uncertainty regarding the position of the windows and doors, two simulations have been carried out for each measurement period for each CDCC. In one simulation the external windows were assumed opened (rooms A, B, C, C1, D and E of Lx13, all the time, and all rooms of Lx17 between 09:00 and 18:00 during the weekdays, only). In the other simulation all windows were assumed closed permanently. The purpose of these simulations was to show that the measurements fall within the range of the two predictions. The internal doors were assumed to be closed permanently. The averaged results obtained for the whole periods are shown in Tables 5 to 8 together with the PFT measurements.
The values shown in Tables 5 to 8 indicate that predicted airflow rate is generally lower than or equal to the measured airflow rate when the windows are closed. Moreover, when the windows are opened the predicted airflow rate is generally higher than the measured airflow rate. However, some exceptions were found:
(1) In the case of rooms B, C1 and D1 of Lx13 and rooms D and F of Lx17, when windows are assumed closed during the winter period, the difference between measurements and predictions is very small and in the case of two of the rooms the difference is even within error interval; therefore, it is considered that measurements agree with predictions.
(2) In the case of rooms A and D1 of Lx13 during the summer period, when windows are assumed opened, for room A it is reasonable to assume that two windows are opened instead of one, as considered in the simulation; for room D1 it is possible that the internal door may be left opened in order to increase the ventilation. It is important to stress that the indoor temperature was sometimes above 26℃, which is perfectly appropriate to have internal doors open to create air drafts and improve thermal comfort.
On the basis of the above data, one can conclude that predictions agree with measurements. Moreover, the close agreement between the predictions and measurements of rooms B, C1, D, D1 and E, of Lx13, and rooms D, F and G, of Lx 17, for winter period (when windows are assumed closed), indicates that the windows were actually closed, and demonstrates the accuracy of the simulations.
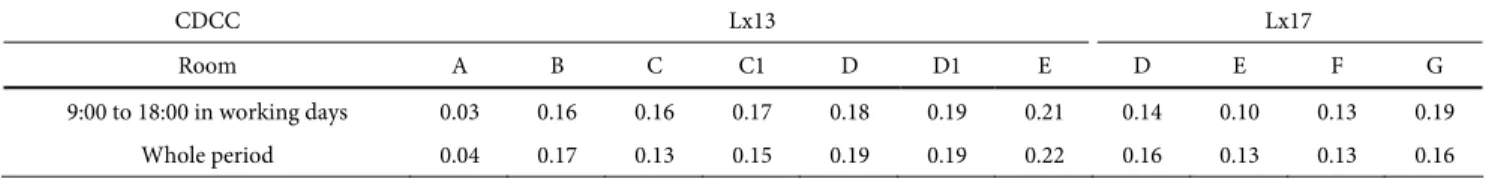
As is well known, PFT method provides only an average value of ventilation for the entire measurement period. Since this period includes weekends and nights (periods with no occupancy), it is questionable if the averaged value is relevant for the period of use of CDCC. When weather is good, users may open the windows during occupancy period, while during the night the external windows are closed for safety reasons. For this reason, the average ventilation rate during the occupancy period may be quite different from the average ventilation rate for the two weeks period. However, during winter, when external windows are usually kept closed, simulations may be used to estimate the difference between average ventilation rates corresponding to different conditions (occupancy versus mixed, occupancy with no occupancy together). Different ventilation rates can also be induced by the differences noted between day and night weather conditions in terms of wind and temperature. Table 9 compares the simulated average ventilation rates of the occupancy periods (from 9:00 to 18:00 in working days) with the simulated average ventilation rates of the entire period (from 2012-01-10 to 2012-01-26) for Lx13 and Lx17 buildings. It is clear that the differences between values are very small, which allows to conclude that the measured values with PFT technique are also similar to ventilation rates that would occur just in the occupancy period.
3.3 Validation of simulations
CONTAM is a well-known computer code that has been extensively validated against measurements (Emmerich and Nabinger 2000; Emmerich 2001; Axley et al. 2002). The accuracy of the predictions depends on the detail and accuracy of the input data, namely the boundary conditions, such as the air permeability of the windows and doors, the wind pressure coefficients, the weather conditions and the indoor environment (temperature). For this reason, a com-parison of the predictions with measurements is required. In this respect, the good agreement found between the
Table 9 Lx13 and Lx17 comparison between predicted average ventilation rates (h–1) for winter period
CDCC Lx13 Lx17
Room A B C C1 D D1 E D E F G
9:00 to 18:00 in working days 0.03 0.16 0.16 0.17 0.18 0.19 0.21 0.14 0.10 0.13 0.19
simulations, the short term CO2 concentration tracer gas
measurements (see Section 3.1) and the medium term PFT measurements (see Section 3.2) confirms the validity of the input data. Therefore, it is expected that further predictions can provide results close to real situations which can serve as basis for researching the best strategies to improve the ventilation performance of these buildings, at least when the predicted values are of the same order of magnitude of the values that supported the validation.
3.4 Effect of external temperature and wind
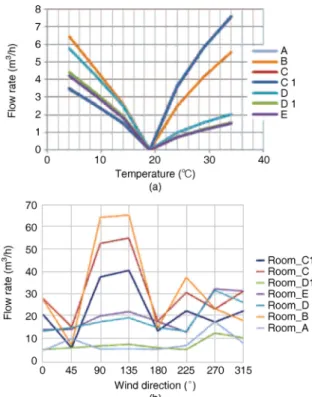
In order to assess the effect of the difference between indoor and outdoor temperature on the ventilation performance, a set of simulations (Fig. 8(a)) have been carried out for Lx13 assuming a constant indoor temperature of 19℃ and a wind velocity equal to 0 m/s. The external windows were assumed closed all the time and the outdoor temperature was ranged from 4℃ to 34℃. The effect of the wind direction on the ventilation performance was analysed in another set of simulations (Fig. 8(b)). The wind velocity was assumed equal to 10.0 m/s, whereas indoor and outdoor temperatures were assumed equal to 19℃. The external windows were assumed closed as well.
Since Lx13 is a taller building, it was expected a more pronounced stack effect would be seen. The results, however, do not support this expectation, the airflow rate values being rather low under these conditions. Besides, the reverse stack effect (indoor temperature lower than outdoor temperature)
Fig. 8 Stack effect and wind direction effect (Lx13)
is imposing similar airflows and the airflow values are depending significantly on the flow paths (rooms at the same level have different airflow rates). Due to assumption of the closed door between floor levels 1 and 2, the ventilation of upper levels is relatively independent from the ventilation of lower levels. This is the reason why the flows due to stack effect are not much higher in lower and upper floor levels. The wind effect is varying strongly with the wind direction and is more effective when the wind is facing west or east facades. For the period between 10 and 26 January 2012, during the occupancy period (from 9:00 to 18:00) the average external temperature was 11.9℃ (the minimum 9℃ and the maximum 17℃ with standard deviation of 2.5℃) and the average internal temperature was 16.4℃. It is possible to see that for a difference of temperature between indoor and outdoor of 4.5℃ the flow rate due to stack effect is not higher than 2.5 m3/h (for the room E this represents
0.04 h–1). For the same period the average wind velocity is
3.0 m/s (the minimum 0.0 m/s and the maximum 9.3 m/s with standard deviation of 1.5 m/s), which corresponds to 30% of the flow rate shown in Fig. 8(b). When comparing the flow rate due to wind action and stack effect, it is clear that only rooms A and D1 have similar flow rates. In the remaining cases the wind action is the main driver for ventilation. In the case of Lx17 the stack effect is also less effective due to smaller height of the building. For other seasons of the year the difference between outdoor and indoor temperature is smaller, therefore the wind action is more important to ventilation than stack effect (during summer, when the wind velocity is higher and the windows are opened, the difference between and indoor and outdoor temperatures is reduced even more). These conclusions point out that the wind action is the main driver for natural ventilation.
The computer code CONTAM needs the indoor and outdoor temperatures to be specified by user, which is a short-coming. For the yearly simulations, no information on indoor conditions is available. However, as the stack effect is not the most important action that drives the natural ventilation in these cases, the need of accurate information on indoor temperatures along the year is less relevant. On this basis, a constant indoor temperature of 20℃ was assumed for yearly simulations. This limitation was overcome by assuming the same indoor and outdoor weather conditions in each simulation in order that their results are comparable.
3.5 Analysis of ventilation
The average predicted values of airflow and ventilation rate for the year 2012 are shown in Appendix A. The values corres-ponding to ventilation performed with outdoor and indoor air (Qtot) and only with outdoor air (Qoa) are reported. The
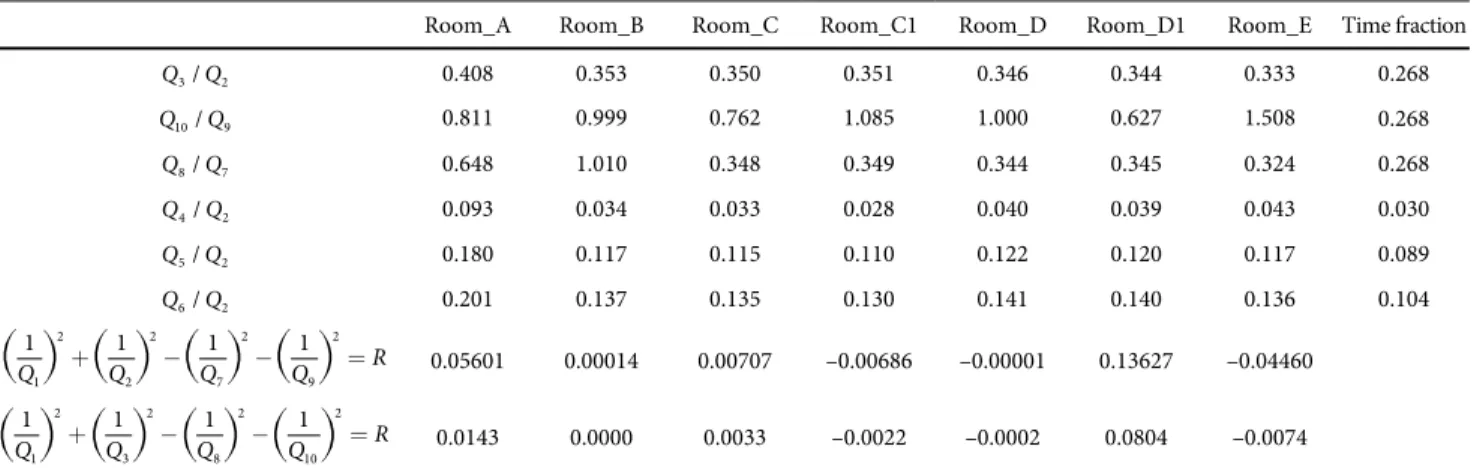
For simulations 1, 2, 7 and 9 the positions of the windows and doors are assumed unchanged all the time. Since it is also relevant to assess the impact of opening the doors and windows for a short amount of time, a comparison of flow rates between simulations with windows and doors opened permanently and with short time opening is shown in Tables 10 and 11 for every activity room. The fraction of time when the windows or doors are opened is shown in the last column of the tables. The flow rate ratio is higher than the time fraction in all cases. This means that the periods (during the day) when the windows and/or doors are opened correspond to stronger wind action (in summer during the day the wind action in general is stronger than during night). This comparison shows that opening the windows and doors during the day is an effective way of improving ventilation.
Appendix A shows that the ventilation rate obtained with mechanical ventilation (case 13) is, in general, higher than the design ventilation rate (1 h–1). It is assumed that
this is due to infiltrations and the external actions (mainly the wind).
For the design of natural ventilation (cases 11 and 12) it
is shown in Appendix A that the average ventilation rate per room obtained for year round simulations varies between 0.6 h–1 and 0.9 h–1 in the case of Lx 17, and between 0.6 h–1
and 2.0 h–1 in the case of Lx13. This clearly shows that
design pressure difference (see Eq. (3)) is too high as design condition for some of the rooms because the ventilation rate is in general below 1.0 h–1. However, for some rooms
the predicted ventilation rate is higher than the design ventilation rate. Since the risk of thermal discomfort is higher in these cases, care should be taken to avoid over ventilation (the envelope air permeability shall be very low and means to control the flow rate of ventilation openings when pressure difference is high shall be adopted).
The flow of outdoor air that contributes to the ventilation of the activity rooms (Qoa in the table of the Appendix A)
corresponds to just a fraction of the total ventilation flows. This may pose indoor air quality related problems due to transport of pollutants (e.g., human body emissions, furniture and construction materials emissions, VOC emissions from cleaning products) from other rooms of the CDCC. The adoption of a natural ventilation system with ducts (case 12 applied to rooms D and E of Lx17, and rooms A, B, C and
Table 10 Comparison of simulation results for Lx13
Room_A Room_B Room_C Room_C1 Room_D Room_D1 Room_E Time fraction
3/ 2 Q Q 0.408 0.353 0.350 0.351 0.346 0.344 0.333 0.268 10/ 9 Q Q 0.811 0.999 0.762 1.085 1.000 0.627 1.508 0.268 7 8/ Q Q 0.648 1.010 0.348 0.349 0.344 0.345 0.324 0.268 2 4/ Q Q 0.093 0.034 0.033 0.028 0.040 0.039 0.043 0.030 5/ 2 Q Q 0.180 0.117 0.115 0.110 0.122 0.120 0.117 0.089 6/ 2 Q Q 0.201 0.137 0.135 0.130 0.141 0.140 0.136 0.104 2 2 2 2 1 2 7 9 1 1 1 1 Q + Q - Q - Q =R
(
)
(
)
(
)
(
)
0.05601 0.00014 0.00707 –0.00686 –0.00001 0.13627 –0.04460 2 2 2 2 1 3 8 10 1 1 1 1 Q + Q - Q - Q =R( ) ( ) ( ) ( )
0.0143 0.0000 0.0033 –0.0022 –0.0002 0.0804 –0.0074Table 11 Comparison of simulation results for Lx17
Room_D Room_E Room_F Room_G Time fraction
3/ 2 Q Q 0.383 0.406 0.340 0.371 0.268 10/ 9 Q Q 0.943 0.992 0.961 0.819 0.268 7 8/ Q Q 0.468 0.365 0.396 0.330 0.268 2 4/ Q Q 0.060 0.058 0.045 0.061 0.030 5/ 2 Q Q 0.140 0.144 0.118 0.138 0.089 6/ 2 Q Q 0.160 0.166 0.136 0.157 0.104 2 2 2 2 1 2 7 9 1 1 1 1 Q + Q - Q - Q =R
( ) ( ) ( ) ( )
0.0001 0.0000 0.0003 0.0004 2 2 2 2 1 3 8 10 1 1 1 1 Q + Q - Q - Q =R( ) ( ) ( ) ( )
–0.0002 –0.0002 –0.0003 0.0001D1of Lx13) is used in order to reduce the cross contamination between rooms. The comparison of case 11 (natural ventilation with self-regulating vents) with case 12 (ventilation is with ducts) highlights the fact that the average flow rate of outdoor air increases from 0.38 h–1 (case 11) to 0.89 h–1. In
addition, it is possible to see that there is also an increase in the total ventilation rate (0.90 h–1 in case 11 and 1.14 h–1 in
case 12). In order to assess the effectiveness of this solution the ratio between ventilation rate with outdoor air (Q/V)oa
and total ventilation rate (Q/V)tot is compared for both
cases. For case 11 [(Q/V)oa/(Q/V)tot]11 = 0.42 while [(Q/V)oa/
(Q/V)tot]12 = 0.79 for case 12. Although this design with
conduits is not able to completely avoid the contamination between rooms, the results show that it is very successful in increasing the incoming of outdoor air. For achieving the best results, it is recommended to reduce the air permeability of internal connections.
3.6 Analysis of CO2 concentration
While the activity rooms of Lx17 are located on the top of the building or in one side of the corridor (see Fig. 5), in
the case of Lx13 the activity rooms are located near both external facades of the building (see Figs. 2 and 3). As a consequence, in the case of Lx13 the ventilation flow crossing the building from one facade to the other is carrying pollutants due to human occupancy from the activity room located upstream to the activity rooms located downstream. In the case of Lx17 this process is much less important. In order to assess the impact of the pollution released by human occupancy in activity rooms, CO2 emissions were
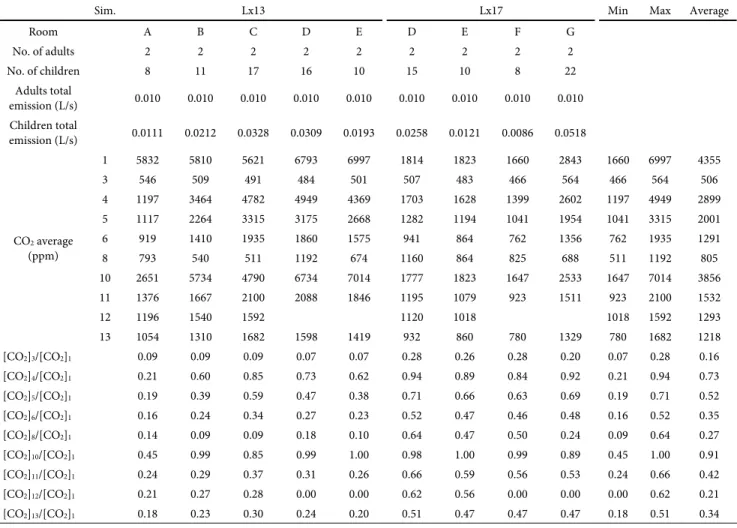
included in simulations as a surrogate marker of human body emissions. As the pollution is relevant for children only during the periods of use of CDCC, the average values shown in Table 12 correspond only to the occupancy periods (from 9:00 to 12:00 and from 14:00 to 16:00 during weekdays). For better understanding the impact of each simulation on pollution, Table 12 also shows the ratios between average CO2 concentrations for every simulation
and simulation 1. Also, for better understanding the processes that drive the variation of the CO2, examples of the predicted
evolution of CO2 concentration in rooms C of Lx13 and E of
Lx17, for weather conditions of 18 January 2012, are shown in Fig. 9.
Table 12 Predicted CO2 concentration for the period of use of Lx13 and Lx17
Sim. Lx13 Lx17 Min Max Average
Room A B C D E D E F G No. of adults 2 2 2 2 2 2 2 2 2 No. of children 8 11 17 16 10 15 10 8 22 Adults total emission (L/s) 0.010 0.010 0.010 0.010 0.010 0.010 0.010 0.010 0.010 Children total emission (L/s) 0.0111 0.0212 0.0328 0.0309 0.0193 0.0258 0.0121 0.0086 0.0518 1 5832 5810 5621 6793 6997 1814 1823 1660 2843 1660 6997 4355 3 546 509 491 484 501 507 483 466 564 466 564 506 4 1197 3464 4782 4949 4369 1703 1628 1399 2602 1197 4949 2899 5 1117 2264 3315 3175 2668 1282 1194 1041 1954 1041 3315 2001 6 919 1410 1935 1860 1575 941 864 762 1356 762 1935 1291 8 793 540 511 1192 674 1160 864 825 688 511 1192 805 10 2651 5734 4790 6734 7014 1777 1823 1647 2533 1647 7014 3856 11 1376 1667 2100 2088 1846 1195 1079 923 1511 923 2100 1532 12 1196 1540 1592 1120 1018 1018 1592 1293 CO2 average (ppm) 13 1054 1310 1682 1598 1419 932 860 780 1329 780 1682 1218 [CO2]3/[CO2]1 0.09 0.09 0.09 0.07 0.07 0.28 0.26 0.28 0.20 0.07 0.28 0.16 [CO2]4/[CO2]1 0.21 0.60 0.85 0.73 0.62 0.94 0.89 0.84 0.92 0.21 0.94 0.73 [CO2]5/[CO2]1 0.19 0.39 0.59 0.47 0.38 0.71 0.66 0.63 0.69 0.19 0.71 0.52 [CO2]6/[CO2]1 0.16 0.24 0.34 0.27 0.23 0.52 0.47 0.46 0.48 0.16 0.52 0.35 [CO2]8/[CO2]1 0.14 0.09 0.09 0.18 0.10 0.64 0.47 0.50 0.24 0.09 0.64 0.27 [CO2]10/[CO2]1 0.45 0.99 0.85 0.99 1.00 0.98 1.00 0.99 0.89 0.45 1.00 0.91 [CO2]11/[CO2]1 0.24 0.29 0.37 0.31 0.26 0.66 0.59 0.56 0.53 0.24 0.66 0.42 [CO2]12/[CO2]1 0.21 0.27 0.28 0.00 0.00 0.62 0.56 0.00 0.00 0.00 0.62 0.21 [CO2]13/[CO2]1 0.18 0.23 0.30 0.24 0.20 0.51 0.47 0.47 0.47 0.18 0.51 0.34
Firstly, it should be stressed that the predictions for simulation 1 (windows and doors are always closed) are far beyond the measured values (see Table 1), in particular for Lx13 case. At the time of the measurement the occupancy of the rooms was equal or even higher than the maximum allowed occupancy. Moreover, the measurement was per-formed much later than 14:00 (except for room D of Lx17), which is the time of the beginning of the activity period. However, the measured CO2 concentrations are much lower
than the predicted yearly average. This means that the occupants often keep external windows and/or internal doors opened to improve ventilation (but they close them when teaching lessons, in order to avoid disturbances). The reason of the high simulated CO2 concentrations is due to
low ventilation rate during the night, which is not sufficient to eliminate the pollutants from day before. Therefore, in the following day (see Fig. 9 for case 1) the initial concentration is already well above the outdoor concentration (440 ppm). This is a daily cumulative process that drives to high pollution levels.
Opening windows and doors from 17:00 to 18:00 (during the cleaning period) has the potential to reduce CO2
concentration to outdoor concentration level (see Fig. 9 for simulation 4). In average, this strategy has the potential to reduce the average CO2 concentration to 73% ([CO2]4/
[CO2]1 = 0.73) for the analysed CDCC. Additionally opening
the windows and doors from 12:00 to 14:00 (simulations 5 and 6) and another 15 minutes at 11:00 and at 15:00 (simulation 6) has the potential to reduce the indoor CO2
concentration to the outdoor concentration level several times during the day. This can result in a very effective reduction of average CO2 concentration ([CO2]5/[CO2]1 =
0.52 and [CO2]6/[CO2]1 = 0.35). The impact of simulation 4
on indoor comfort is very low because the indoor climate may be conditioned (heating) during the whole night. However, strategies of simulations 5 and 6 may have some
impacts on indoor comfort while the indoor temperature is being conditioned.
Keeping windows and doors opened from 9:00 to 18:00 (simulation 3) appears to be the most successful ventilation strategy ([CO2]3/[CO2]1=0.16). However, it is sometimes not
feasible because it can potentially cause thermal discomfort (it can impair weather tightness during rainy period and teaching lessons will be disturbed by events occurring outside the activity room). Keeping the internal doors closed during this period (simulation 8) increases the predicted average CO2 concentration ([CO2]8/[CO2]1=0.27) but much
less than in the case when doors are kept opened and the windows are kept closed (simulation 10). The predictions for simulation 10 show that keeping internal doors opened does not improve significantly the IAQ ([CO2]10/[CO2]1=0.91).
This is due to the high air permeability of the internal doors when compared to the air permeability of the external windows (see Table 2). Therefore, the impact on ventilation rate of the doors is very limited.
As expected, mechanical ventilation (simulation 13) proves to be a good strategy ([CO2]13/[CO2]1=0.34). Predictions
show that for these CDCC wind driven cross-ventilation (simulations 11 and 12) has a performance similar to that of mechanical ventilation ([CO2]11/[CO2]1=0.42 and [CO2]12/
[CO2]1=0.21). As for mechanical ventilation, the performance
may be improved adopting other design requirements. The adoption of a ventilation system as for simulations 11, 12 and 13 minimizes the impact of outdoor conditions (weather and noise) on indoor comfort (thermal and acoustical) and reduces the disturbances in activity room due to noise emitted from adjacent rooms.
As a general recommendation, a properly designed ventilation system (natural or mechanical) needs to be installed in activity rooms. Such system could include sound attenuators to avoid disturbances caused by external noise in class rooms. In the absence of a properly designed ventilation