Influence of extraction time and volume of extracting solution on the
phenolic compounds and antioxidant activity of strawberry
Ana Cristina Ferrão;[email protected]
CI&DETS Research Centre/Dep. Food Industry-ESAV, Polytechnic Institute of Viseu, Portugal Raquel P. F. Guiné - [email protected]
CI&DETS Research Centre/Dep. Food Industry-ESAV, Polytechnic Institute of Viseu, Portugal Fernando J. A. Gonçalves - [email protected]
CI&DETS Research Centre/Dep. Food Industry-ESAV, Polytechnic Institute of Viseu, Portugal Paula M. R. Correia - [email protected]
CI&DETS Research Centre/Dep. Food Industry-ESAV, Polytechnic Institute of Viseu, Portugal João Carlos Gonçalves - [email protected]
CI&DETS Research Centre/Dep. Food Industry-ESAV, Polytechnic Institute of Viseu, Portugal
Abstract
This work aimed at comparing different extracting conditions in order to enhance the extraction of phenolic compounds with antioxidant activity from strawberry. For the laboratorial tests, the strawberries were triturated and samples of 5 g were taken to perform extractions with methanol, for different times (15 and 60 min.) and using different volumes of the extraction solvent (25 and 50 mL). For each of the combinations three successive extractions were made and in each extract were quantified the total phenolic compounds (TPC), anthocyanins (ANT) and the antioxidant activity (AOA), all by spectrophotometric techniques. The results indicated that the more adequate conditions for the extraction of phenolic compounds and anthocyanins with antioxidant activity from strawberries corresponded to three successive extractions using each lasting for 60 min and using 50 mL of methanol. These conditions potentiated the extraction of high amounts of phenolic compounds with antioxidant activity. The TPC contents in the fresh strawberry varied from 2.2 to 3.2 mg GAE/g, the ANT contents varied from 131 to 149 mg Mv3G/g and the AOA was evaluated in the range 12.6 to 23.9 µmol TE/g.
Keywords
Influence of extraction time and volume of
extracting solution on the phenolic compounds
and antioxidant activity of strawberry
1. Introduction
Nowadays consumers´ attention to the importance of the association between food consumption and health benefits has increased, especially regarding fruits and vegetables consumption [1], [2]. The results of various epidemiologic studies suggest a consistent association between the consumption of diets rich in fruits and vegetables and a lower incidence of several chronic pathologies, including cancer, cardiovascular and neurodegenerative diseases [3]–[5]. Therefore, most of the dietary guidelines worldwide recommend increased consumption of fruits and vegetables and the intake of fruits like berries, because of their health benefits [6].
Berries, specially members of several families such as Rosaceae (strawberry, raspberry, blackberry), and Ericaceae (blueberry, cranberry), belong to the best dietary sources of bioactive compounds [7] and provide significant health benefits due to their high levels of polyphenols, antioxidants, vitamins, minerals, and fibers [8].
Strawberries (genus: Fragaria) are members of the Rosaceae family [1] and possesses a high nutritional quality, due to their remarkable content of phenolic compounds and micro-nutrients such as folate, vitamin C, and minerals [9], [10]. In addition, these fruits are also low in total calories, with a 100 g serving providing only 32 kcal, and their sweet flavor makes them a delicious snack alternative to processed foods [3]. Hence, they represent a healthy food choice and are an important and common fruit present in the Mediterranean diet [11]. Strawberries are considered a functional food, offering multiple health benefits, such as antioxidant, anti-inflammatory, antihyperlipidemic, antihyper-tensive, or antiproliferative effects [12].
When compared to other foods, strawberries are among the richest dietary sources of phytochemicals, mainly represented by phenolic compounds, a large and heterogeneous group of biologically active non-nutrients, showing many non-essential functions in plants and huge biological potentialities in humans [13].
Regarding the phenolic compounds in strawberry, the major class present in that fruit is represented by flavonoids (mainly anthocyanins, with flavonols, and flavanols giving a minor contribution), followed by hydrolysable tannins (ellagitannins and gallotannins) as the second most abundant class, and phenolic acids (hydroxybenzoic acids and hydroxycinnamic acids) together with condensed tannins (proanthocyanidins) being the minor constituents [1], [3]. As for anthocyanins, there have been reported more than 25 different anthocyanin pigments in strawberry from different varieties and selections, being the Pelargonidin-3-glucoside the most abundant [14], [15].
There are several factors affecting the physicochemical quality and antioxidant activity of the strawberries, such as climatic conditions, the cultivars used, harvest locations, and agroecosystems [16]–[18]. Other factors, such as ripening degree, the harvesting period, storage conditions, growing methods and processing, can also influence the contents of micronutrients, phytochemicals and antioxidant capacity of strawberries. For example, one of the key factors that affects the stability of phenolic antioxidants in fruits, during postharvest storage, is the storage temperature [1], [19], [20].
Usually, strawberries are consumed as fresh fruits. Nevertheless, there are many strawberry-processed products, such as juice, nectar, puree, jam and jellies, available in the market [3]. The objectives of this work were to quantify the total phenolic compounds, anthocyanins and antioxidant activity in strawberries and study the effect of variable extraction times and volumes of extracting solution, considering also different successive extractions.
2. Experimental Procedure 2.1. Samples
The strawberries used for this work were acquired in the local market and brought to the laboratory for analyses. The leaves were removed and the fruits were washed before being grounded. In this way, a uniform mass was obtained and from this mass the samples were taken for the different extraction trials. In each case always 5 g of strawberry mass were used.
2.2. Extraction
The 5 g of strawberry were used in each case for the extraction, made in three successive steps (over the same sample), thus allowing to obtain three extracts: first (E1), second (E2) and third (E3). The extraction solution used was methanol, varying however the volume (25 and 50 mL). Also the time of extraction was varied, being 15 or 60 min. For each set of experimental conditions used, the process was repeated exactly the three times. The obtained extracts were later used for analysis.
2.3. Analysis of total phenolic compounds
The total phenolic compounds (TPC) were analyzed using the Folin-Ciocalteu method [21], [22]. For that, 0.125 mL of each extract were added to 0.75 mL of deionized water and 0.125 mL of the Folin-Ciocalteu reagent. The solution was left to stand for 6 min, and then 2 mL of a 5 % (m/v) solution of Na2CO3 were added and the mixture was left to rest in the dark for 90
min at room temperature. For the calibration, standard solutions of gallic acid were prepared and the absorbance was measured in a spectrophotometer at 760 nm. The results were expressed as milligrams of gallic acid equivalents (GAE) per gram of fresh sample, being calculated as a mean of three measurements.
2.4. Analysis of anthocyanins
The total anthocyanins (ANT) were evaluated using the SO2 bleaching method [23], [24]. For
that 1 mL of each extract was added to equal volume of ethanol acidified with 0.1% HCl and 20 mL of 2% HCl (pH 0.6). In one tube, 2 mL of the previous solution was added to 0.8 mL of water (t1). In another tube (t2) were mixed 2 mL of the previous solution and 0.4 mL of HNaSO3 solution (15% w/v). After 20 min in the dark and at room temperature, the
absorbance was measured at 520 nm. The ANT content was calculated using the following equation:
ANT (mg Mv3G/g) = 875 × (abst1 - abst2) (1)
The results were expressed as malvidin equivalents. The analyses were performed in triplicate for each sample.
2.5. Analysis of antioxidant activity
The antioxidant activity (AOA) was determined by the ABTS+
(2,2'-azino-bis(3-ethylbenzthiazoline-6-sulphonic acid)) method. For that, 1 mL of ABTS+ solution was diluted in 80 mL of ethanol or buffer solution. In a tube was placed 2 mL of ABTS+ solution with 0.1
mL of the sample extract and after agitation it was left to rest in the dark for 15 minutes [22], [25]. Then the absorbance was measured at 734 nm. The percentage of inhibition was calculated using a calibration curve prepared with the standard Trolox. The analyses for AOA were performed in triplicate for each of the extracts analysed. The results were expressed as μmol Trolox equivalents (TE) per gram of sample.
3. Results and Discussion 3.1. Total phenolic compounds
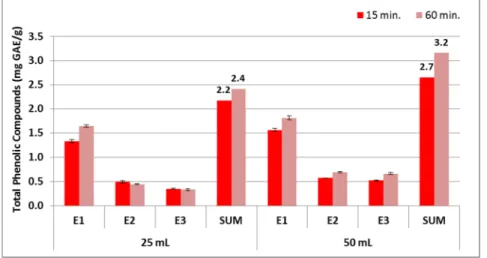
The graph in Figure 1 presents the TPC for the three strawberry extracts (E1, E2 and E3) and the sum (E1+E2+E3), for extraction times of 15 and 30 min and for different methanol volumes (25 and 50 mL). It is shown that for all cases, i.e., for the two times of extraction and for the two volumes of methanol, the 1st extract (E1) was always richer in phenolic
compounds in comparison with the 2nd and 3rd extracts. However, when comparing the 2nd with the 3rd extracts the differences were not so evident.
Regarding the sum of TPC, thus accounting for all the phenolic recovered from the samples with the adopted procedures, increasing extraction time or volume of methanol seems to increase slightly the amount of TPC quantified.
In global, the TPC obtained for the strawberry samples varied between 2.2 and 3.2 mg GAE/g. Adak et al. [26] reported values of TPC in fresh strawberries of 4.6 mg GAE/g, which is higher than the value obtained in the present work. However, the value reported by Maraei and Elsawy [27] also for fresh strawberries was about 1.6 mg GAE/g, which was lower when compared to our results.
Figure 1 – Total phenolic compounds in the strawberry extracts (E1, E2 and E3 are the 1st, 2nd and 3rd extracts,
respectively; SUM represents the sum of the values obtained for the three extractions).
Figure 2 represents the relative importance of the different extractions in relation to the overall yield. The 1st extraction accounted for more than half of the extracted TPC, with percentages varying from 57.3% to 68.0%. The 2nd extraction corresponded to 18.3% to 22.6%
of TPC and finally the 3rd extraction represented between 13.7% and 20.9%. Although the 2nd and 3rd extractions were comparatively less important, still they were justified and the global
procedure considering the 3 extraction steps allowed extracting a high amount of phenolic compounds. The results were similar for both volumes of methanol and for both extraction times considered in the study.
Figure 2 – Percentage of extracted TPC (E1, E2 and E3 are the 1st, 2nd and 3rd extracts, respectively).
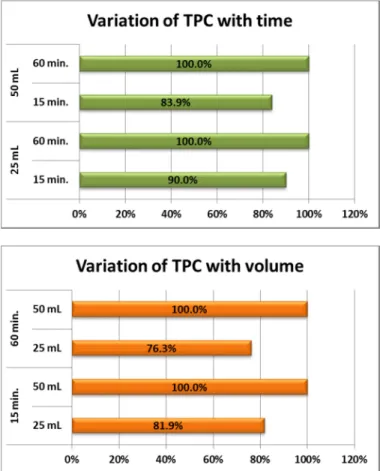
The results in Figure 3 (top) reveal that increasing the extraction time from 15 to 60 min is beneficial to extract phenolic compounds, but that increase was relatively low (about 10% when 25 mL of methanol were used and about 16% when 50 mL were used). Hence, it must be evaluated if the increase in extraction efficiency is worth for an increase in time of four times. A similar trend was observed in Figure 3 (bottom), about the effect of increasing the volume of methanol on the extraction of phenolic compounds. In this case, by increasing the volume to the double the efficiency increases by 18% and 24%, respectively for 15 and 60 min.
Figure 3 – Variation of TPC (sum of extracts) with extraction time (top) and with volume of methanol (bottom).
Figure 4 shows the ANT quantified in the three extracts as well as the global value obtained by summing the amounts present in the 3 extracts, for different times and volumes of methanol. Again, and similarly to what was previously seen for TPC, the 1st extract was much
richer when compared to the other extracts, and the trend are equal for all cases.
The amounts anthocyanins varied from 131 to 149 mg/g, expressed as malvidin equivalents. Maraei and Elsawy [27] evaluated anthocyanins in fresh strawberries and found values of ∼12 mg/g, however expressed in cyanidin. Also Adak et al. [26] expressed the anthocyanins in strawberry in terms of cyaniding and reported values of 0.012 mg/g, which was a low value.
Figure 4 – Anthocyanins in the strawberry extracts (E1, E2 and E3 are the 1st, 2nd and 3rd extracts, respectively; SUM
represents the sum of the values obtained for the three extractions).
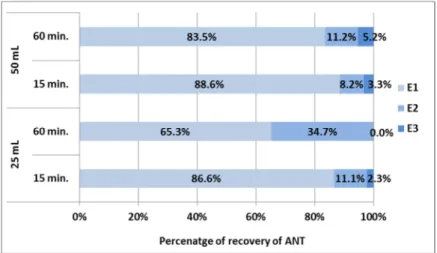
The results presented in Figure 5 reveal again the relative importance of the different extractions performed successively on the same sample of strawberry, in terms of recovery of anthocyanins. As previously seen for TPC, the amounts of ANT quantified in the 1st extracts were always considerably superior to the other extracts, so that the 1st extract accounted for a percentage ranging from 65% to almost 90% of the total quantity extracted.
However, and unlike what happened for TPC, in the case of ANT the 3rd extraction had a very lower importance, allowing the recovery of a maximum of 5.2% of these compounds.
The observed trends were very similar for the different cases studied, with just a little exception of the extraction lasting 60 min and using 25 mL of methanol.
Figure 5 – Percentage of extracted ANT (E1, E2 and E3 are the 1st, 2nd and 3rd extracts, respectively).
Figure 6 shows the effects of increasing extraction time and volume of methanol on the overall efficiency of the extraction of ANT. When 25 mL of methanol were used (Figure 6 (top)), the increase in drying time from 15 to 60 min allowed an increase of about 11% in the
quantification of ANT. However, if the volume was higher (50 mL) increasing the extraction time did not show beneficial. These results were also confirmed in the graph in Figure 6 (bottom).
Figure 6 – Variation of ANT (sum of extracts) with extraction time (top) and with volume of methanol (bottom).
3.3. Antioxidant activity
The results in Figure 7 show a similar pattern for AOA as that previously reported for TPC and for ANT, i.e., the considerable importance of the 1st extraction in comparison with the other two extractions that followed. In this case for both volumes of methanol and for both extraction times, the 2nd and 3rd extractions were apparently much less relevant when compared for example with the case of TPC. The AOA for the sum of extracts varied from 12.9 to 23.9 µmol TE/g.
Figure 7 – Antioxidant activity in the strawberry extracts (E1, E2 and E3 are the 1st, 2nd and 3rd extracts, respectively;
SUM represents the sum of the values obtained for the three extractions).
Figure 8 confirms that the AOA quantified in the 1st extract corresponds to the highest portion in all cases (72.1% - 91.1%), and in this case, the 3rd extraction was considerable negligible for most cases (corresponding to only 1.2% – 3.0%), with exception of the essay made with 50 mL of methanol during 15 min (for which the 3rd extraction represented a slightly higher portion, 10.2%). This means that if only two extractions were performed most of the compounds with antioxidant activity would have been extracted from the strawberry samples.
Figure 8 – Percentage of AOA (E1, E2 and E3 are the 1st, 2nd and 3rd extracts, respectively).
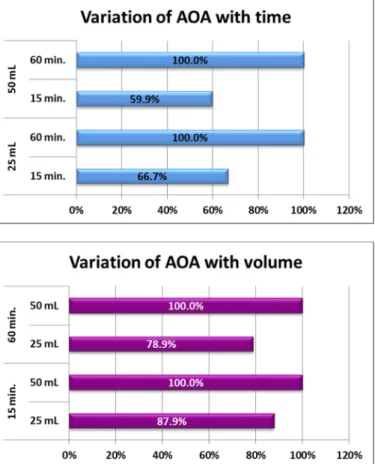
Figure 9 presents the effects of varying the extraction time and the methanol volume on the global AOA of the strawberry samples. Considering the variation of AOA with time, and regardless of the volume of methanol used, apparently increasing the extraction time from 15 to 60 min almost doubled the amount on compounds with antioxidant activity. However, the effect of increasing the solvent volume was not so evident, although it was still worth, namely because doubling the volume from 25 to 50 ml allowed an increase in AOA of about 12% – 21%.
Figure 9 – Variation of AOA (sum of extracts) with extraction time (top) and with volume of methanol (bottom).
3.4. Correlations
Because it is well known that the phenolic compounds in general, and anthocyanins in particular, have demonstrated important antioxidant properties, the relations between AOA and TPC and ANT were investigated. Figure 10 shows the linear fits for the graphs of AOA
versus TPC (left) and AOA versus ANT (right), and they demonstrate a good fitting of the linear functions obtained. Hence, these results showed that the trends observed for the different variables (TPC, ANT and AOA) are quite similar in all cases, because they are intimately related, i.e., extracts with high amounts of phenolic compounds and high amount of anthocyanins exhibit high antioxidant properties.
This is according to what would be expected and in the present cases two linear relations were found between AOA and the two variables, TPC and ANT:
AOA [µmol TE/g ] = 13.518×TPC [mg GAE/g] + 4.890 ; R2 = 0.976 (2)
AOA [µmol TE/g ] = 0.185×ANT [mg GAE/g] – 0.316 ; R2 = 0.989 (3)
The values of the regression coefficient (very high and close to 1) indicate that the relations between AOA and TPC and between AOA and ANT are strong.
Figure 10 – Correlations between AOA and TPC (left) and ANT(right).
4. Conclusions
The results obtained with the present work showed that some selection of conditions for the extraction of phenolic compounds and anthocyanins with antioxidant activity from strawberries could be established relatively to the extraction time and volume of methanol used. Therefore, it was found that the methodology of performing three extractions over the same sample mass might be beneficial allowing to increase the TPC, although with lower effects on the ANT and AOA. Moreover, it was observed that the highest volume tested (50 mL of methanol) and the longer extraction time (60 min) proved adequate to maximize most of the beneficial properties of the extracts.
5. Acknowledgement
This work was financed by FCT - Fundação para a Ciência e Tecnologia, I.P., project UID/Multi/04016/2016. Furthermore we would like to thank the Instituto Politécnico de Viseu and CI&DETS for their support, thought project CI&DETS/2015/0004.
6. References
[1] S. Afrin et al., «Promising Health Benefits of the Strawberry: A Focus on Clinical Studies»,
J. Agric. Food Chem., vol. 64, n. 22, pp. 4435–4449, Jun. 2016.
[2] S. H. Nile e S. W. Park, «Edible berries: Bioactive components and their effect on human health», Nutrition, vol. 30, n. 2, pp. 134–144, Fev. 2014.
[3] F. Giampieri et al., «The potential impact of strawberry on human health», Natural
Product Research, vol. 27, n. 4–5, pp. 448–455, Mar. 2013.
[4] M. Etminan, B. Takkouche, e F. Caamaño-Isorna, «The role of tomato products and lycopene in the prevention of prostate cancer: a meta-analysis of observational studies»,
Cancer Epidemiol. Biomarkers Prev., vol. 13, n. 3, pp. 340–345, Mar. 2004.
[5] Y.-F. Chu, J. Sun, X. Wu, e R. H. Liu, «Antioxidant and antiproliferative activities of common vegetables», J. Agric. Food Chem., vol. 50, n. 23, pp. 6910–6916, Nov. 2002. [6] L. A. Bazzano, «Dietary intake of fruit and vegetables and risk of diabetes mellitus and
cardiovascular diseases», apresentado na Background paper of the joint FAO/WHO workshop on Fruit and Vegetables for health, Japan, 2005, pp. 1–65.
[7] S. Skrovankova, D. Sumczynski, J. Mlcek, T. Jurikova, e J. Sochor, «Bioactive Compounds and Antioxidant Activity in Different Types of Berries», Int J Mol Sci, vol. 16, n. 10, pp. 24673–24706, Out. 2015.
[8] Yanyun Zhao, Ed., Berry Fruit. CRC Press, 2007.
[9] F. Giampieri, J. M. Alvarez-Suarez, e M. Battino, «Strawberry and Human Health: Effects beyond Antioxidant Activity», J. Agric. Food Chem., vol. 62, n. 18, pp. 3867–3876, Mai. 2014.
[10] F. Giampieri et al., «Strawberry as a health promoter: an evidence based review», Food
[11] S. Tulipani, B. Mezzetti, e M. Battino, «Impact of strawberries on human health: insight into marginally discussed bioactive compounds for the Mediterranean diet», Public Health
Nutr, vol. 12, n. 9A, pp. 1656–1662, Set. 2009.
[12] A. Basu, A. Nguyen, N. M. Betts, e T. J. Lyons, «Strawberry As a Functional Food: An Evidence-Based Review», Critical Reviews in Food Science and Nutrition, vol. 54, n. 6, pp. 790–806, Jan. 2014.
[13] S. H. Häkkinen e A. R. Törrönen, «Content of flavonols and selected phenolic acids in strawberries and Vaccinium species: influence of cultivar, cultivation site and technique», Food Research International, vol. 33, n. 6, pp. 517–524, Jul. 2000.
[14] P. Bridle e C. García-Viguera, «Analysis of anthocyanins in strawberries and elderberries. A comparison of capillary zone electrophoresis and HPLC», Food Chemistry, vol. 59, n. 2, pp. 299–304, Jun. 1997.
[15] F. L. da Silva, M. T. Escribano-Bailón, J. J. Pérez Alonso, J. C. Rivas-Gonzalo, e C. Santos-Buelga, «Anthocyanin pigments in strawberry», LWT - Food Science and Technology, vol. 40, n. 2, pp. 374–382, Mar. 2007.
[16] S. Y. Wang e P. Millner, «Effect of different cultural systems on antioxidant capacity, phenolic content, and fruit quality of strawberries (Fragaria x aranassa Duch.)», J. Agric.
Food Chem., vol. 57, n. 20, pp. 9651–9657, Out. 2009.
[17] Y.-J. Kim e Y. Shin, «Antioxidant profile, antioxidant activity, and physicochemical characteristics of strawberries from different cultivars and harvest locations», J Korean
Soc Appl Biol Chem, vol. 58, n. 4, pp. 587–595, Ago. 2015.
[18] J. P. Reganold et al., «Correction: Fruit and Soil Quality of Organic and Conventional Strawberry Agroecosystems», PLOS ONE, vol. 5, n. 10, p. 10.1371/annotation/1eefd0a4-77af-4f48-98c3-2c5696ca9e7a, Out. 2010.
[19] C. Kevers, M. Falkowski, J. Tabart, J.-O. Defraigne, J. Dommes, e J. Pincemail, «Evolution of antioxidant capacity during storage of selected fruits and vegetables», J.
Agric. Food Chem., vol. 55, n. 21, pp. 8596–8603, Out. 2007.
[20] S. Tulipani, S. Romandini, F. Capocasa, B. Mezzetti, e M. Battino, «The Nutritional Quality of Strawberries (Fragaria x ananassa) after Short-refrigeration: genetic Influences», Functional Plant Science and Biotechnology, vol. 4, n. 1, pp. 84–89.
[21] F. J. Gonçalves, S. M. Rocha, e M. A. Coimbra, «Study of the retention capacity of anthocyanins by wine polymeric material», Food Chem, vol. 134, n. 2, pp. 957–963, Set. 2012.
[22] S. C. R. V. L. Santos, R. P. F. Guiné, e A. Barros, «Effect of drying temperatures on the phenolic composition and antioxidant activity of pears of Rocha variety (Pyrus communis L.)», Food Measure, vol. 8, n. 2, pp. 105–112, Fev. 2014.
[23] R. Boulton, «The Copigmentation of Anthocyanins and Its Role in the Color of Red Wine: A Critical Review», American Journal of Enology and Viticulture, vol. 52, n. 2, pp. 67–87, Jan. 2001.
[24] V. Cheynier, J. Rigaud, J. M. Souquet, J. M. Barillère, e M. Moutounet, «Effect of Pomace Contact and Hyperoxidation on the Phenolic Composition and Quality of Grenache and Chardonnay Wines», American Journal of Enology and Viticulture, vol. 40, n. 1, pp. 36– 42, Jan. 1989.
[25] R. P. F. Guiné, S. M. A. Soutinho, e F. J. Gonçalves, «Phenolic compounds and antioxidant activity in red fruits produced in organic farming», Croatian Journal of Food
Science and Technology, vol. 6, n. 1, pp. 15–26, Jul. 2014.
[26] N. Adak, N. Heybeli, e C. Ertekin, «Infrared drying of strawberry», Food Chemistry, vol. 219, pp. 109–116, Mar. 2017.
[27] R. W. Maraei e K. M. Elsawy, «Chemical quality and nutrient composition of strawberry fruits treated by γ-irradiation», Journal of Radiation Research and Applied Sciences, vol. 10, n. 1, pp. 80–87, Jan. 2017.