Universidade de Trás-os-Montes e Alto Douro
Ecophysiological and biochemical characterization of different
varieties in Douro Region
Dissertação de Mestrado em Engenharia Agronómica
Nisanka Ambriz Kehel Kotuwe Gedara
Orientadora: Doutora Lia-Tânia Rosa Dinis
Co-orientadora: Doutora Ana Catarina Gonçalves Luzio
“The greater our knowledge increases the more our ignorance unfolds.”
To my heart grandmother, Maria de Lourdes dos Correia de Miranda and to my father, Abeyratne Kehel Kotuwe Gedara
ACKNOWLEDGMENTS
VII ACKNOWLEDGMENTS
Concluded the preparation of this master thesis, I want to formally thank the people involved in my academic and professional journey, becoming an achievement of my dream and personal goal.
To the course director, Professor Virgílio Alexandre Cardoso and Falco da Costa, for the availability and support in the areas related to the course and the knowledge transmitted as a teacher.
To Professor José Manuel Moutinho Perreira, for the knowledge and the teachings transmitted throughout my academic journey. Thank you also for your friendship and for presenting me as my dissertation advisors.
To Dr. Lia-Tânia Dinis and Dr. Ana Gonçalves Luzio, my thesis advisors, for their orientation and teaching of laboratory technologies, as well as for the availability, support, patience, friendship and all the teachings transmitted.
Master Helena Ferreira and Master Sara Bernardo, thank you for the help you have given me in performing my experimental work and in all laboratory processes, for your patience and friendship and for all the knowledge taught.
To the future graduates in Biologia and Geologia, Marisa Carvalho and Helder Peixoto who gave me an aid in the accomplishment of the experimental part of the member of his Biology Internship and for the new bond of friendship that was created.
To my colleagues and friends of course of my academic career, Filomena Vicente, Alexandre Martins, Luis Fernando, João Pereira, Teresa Santos, César Mendes, Eduardo Baptista, Samuel Reis and André Oliveira, for the good moments, for the friendship, for the great spirit of being help.
To Professor Armando Figueiredo, for his knowledge in mathematical area, advice and friendship when I was in Camilo Castelo Branco high school in Vila Real and my teachers remain.
The brothers Mr. José and Mr. Filinto Gomes, for their help both personal and professional, have always given me good councils and orientations.
ACKNOWLEDGMENTS
VIII
To my mother, Cândida Maria Ambriz, and my sister, Veronica Kehel thank you also to my godfathers Dr. Emilia Novais and Mr. Mauro Tavares, the sisters Dr. Irene Novais, Mrs. Lurdes Novais, Dr. Salustiano Fernandes, Mr. Anibal Pita and Mr. Nuno Xavier for the love and affection they have for me during all these years.
RESUMO
IX RESUMO
Nos últimos anos, tem-se verificado de forma crescente o efeito das alterações climáticas na agricultura e sobretudo no sector vitícola perspetivando-se assim alterações significativas na viticultura sobretudo no velho mundo vitícola (Europa). O aumento da temperatura já se tem verificado em Portugal e sobretudo na Região Demarcada do Douro (DDR) nos últimos anos. Embora a videira tenha várias estratégias de sobrevivência torna-se necessário a adoção de medidas de adaptação e mitigação neste sector. O objetivo do trabalho foi avaliar uma das medidas de adaptação de longo prazo, visando a seleção das castas mais tolerantes aos efeitos do stresse estival, e avaliar as que melhor se adaptam à sub-região Baixo-Corgo da DDR. Para esse fim, foram escolhidas 10 castas localizadas na sub-região em estudo com uma orientação E-O, no Campo Ampelográfico da Escola Profissional do Rodo, Peso da Régua em iguais condições edafoclimáticas e hídricas e foram feitas análises de parâmetros ecofisiológicos (folha) e bioquímicos (fruto) em duas datas: 23 de Agosto e 12 de Setembro de 2018. Relativamente às respostas fisiológicas no período do meio-dia (mais severa), as variedades que apresentaram melhor resposta, são a Aragonês, a TBarroca, a TFranca e a TNacional. Quanto aos parâmetros bioquímicos no fruto, as variedades Aragonês, TFranca e TNational apresentaram maior concentração de carboidratos, compostos fenólicos, antocianinas e taninos. Com os resultados deste trabalho podemos concluir que as castas Aragonês e TBarroca são as castas melhor adaptadas/tolerantes a este Terroir e as castas Trincadeira e TFrancisca mostraram ser a menos tolerantes ao mesmo.
ABSTRACT
ABSTRACT
XI ABSTRACT
In recent years, there has been a change in climate in agriculture and, above all, in the wine sector, with the growing problem of global warming, with significant changes in viticulture, especially in the old wine world (Europe). This increase in temperature has already occurred in the Douro Demarcated Region (DDR) in recent years. Although the vine has several survival strategies, it is necessary to adopt adaptation and mitigation measures in the viticulture sector. The objective of this study was to evaluate one of the long-term adaptation measures to select the strains that are most resistant to the effects of summer stress, and to evaluate those that best fit the Baixo Corgo subregion DDR.
For this purpose, 10 grape varieties located in the sub-region under study with an E-W orientation were chosen in the Ampelographic Field of the Professional School of Rodo, Peso da Régua in equal conditions and soil and water with the analysis of eco-physiological (leaf) and biochemical (fruit) parameters in two dates: August 23 and September 12 of 2018,.
Relatively physiological response in midday period (more severe), the varieties that showed best response, are the Aragonês, TBarroca, TFranca and Touriga Nacional.
Regarding biochemical parameters, Aragonês, TFranca and TNational varieties presented higher concentration of carbohydrates, phenolic compounds, anthocyanins and tannins.
With results of this work we can conclude that, the varieties Aragonês and TBarroca are the varieties better adapted to this Terroir and the varieties Trincadeira and TFrancisca both proved to be less adapted to it.
In conclusion, in view of the results, we can affirm that the selection of grape varieties in the grapevine, compared to other annual non-perennial crops such as cereals and vegetables, is a critical mitigation strategy due to the investment to be made that is generally much larger and the commitment is for a longer period of time and more difficult to reverse. Therefore, it should be well considered in the year of installation of the crop, because the strategy is more expeditious and the costs are lower.
INDEX
INDEX XIII INDEX ACKNOWLEDGMENTS ... VII RESUMO ... IX ABSTRACT ... XI INDEX ... XIII LIST OF FIGURES ... XV LIST OF TABLE... XVII ABBREVIATIONS ... XIX
1. INTRODUCTION ...1
1.1. Douro Demarcated Region characterization ...1
1.2 Effects of climate change in grapevine physiology ...2
1.4. Selection of grape varieties ...6
1.5. Objective of the study...7
2. MATERIAL AND METHODS ...9
2.1. Experimental design and plant material ...9
2.2. Gas exchange, leaf water status and chlorophyll a fluorescence ... 10
2.4. Phytochemical analysis ... 11
2.4.2. Carbohydrate determination ... 11
2.4.3. Anthocyanin quantification ... 12
2.4.4. Tannins quantification ... 12
2.5. Fruit sugar and alcohol degree ... 13
2.5.1. Brixº ... 13
2.5.2. Percentage of alcohol probable ... 13
2.5.3. Reducing sugar ... 13
2.6. Fruit acidity parameters ... 13
2.7. Statistical analysis ... 13
3. RESULTS AND DISCUSSION ... 15
3.1. Ecophysiological parameters ... 15
3.2. Carbohydrates ... 19
3.3. Phenols ... 20
INDEX
XIV
3.5 Anthocyanins ... 21
3.6 Fruit sugar and alcohol degree ... 22
3.7 Acidity parameters ... 23
4. CONCLUSION ... 25
5. REFERENCES ... 27
LIST OF FIGURES
XV LIST OF FIGURES
Figure 1: The Douro Demarcated Region and the tree sub regions. ( http://www.advid.pt/imagens/comunicacoes/13782178013801). ...1
Figure 2: Monthly values of maximum temperature and precipitation of 2018 in the
experimental field ...9
Figure 3: Acid parameters of the ten red varieties under study in harvest (September 2018):
Tartaric acid, Malic acid and Total acidity. Statistical analysis was performed using a two-way factorial ANOVA. Different lower case letters represent significant differences between the varieties in September (p<0.05). Absence of superscript indicates no significant differences ... 24
LIST OF TABLES
LIST OF TABLES
XVII LIST OF TABLE
Table 1: Characterization of the 3 Sub-Regions (IVDP, 2010). ...2 Table 2: Grapevine leaf water potential (Ψ) measured at both predawn (Ψpd) and midday
(Ψmd) of August and September 2018. Statistical analysis was performed using a two-way factorial ANOVA. Different lower case letters represent significant differences between the varieties in the same month (p<0.05). Absence of superscript indicates no significant differences ... 15
Table 3a: Gas exchange parameters in the morning period of August and September 2018.
Statistical analysis was performed using a two-way factorial ANOVA. Different lower case letters represent significant differences between the varieties in the same month (p<0.05), and * represent significant differences between months within the same variety (p<0.05). Absence of superscript indicates no significant differences.. ... 16
Table 3b: Gas exchange parameters in the midday period of August and September 2018.
Statistical analysis was performed using a two-way factorial ANOVA. Different lower case letters represent significant differences between the varieties in the same month (p<0.05), and * represent significant differences between months within the same variety (p<0.05). Absence of superscript indicates no significant differences. ... 17
Table 4: Foliar pigments of the ten red varieties under study in the months of August and
September 2018. Statistical analysis was performed using a two-way factorial ANOVA. Different lower case letters represent significant differences between the varieties in the same month (p<0.05), and * represent significant differences between months within the same variety (p<0.05). Absence of superscript indicates no significant differences. ... 18
Table 5: Fruit biochemistry of the ten red varieties under study in the months of August and
September 2018. . Statistical analysis was performed using a two-way factorial ANOVA. Different lower case letters represent significant differences between the varieties in the same month (p<0.05), and * represent significant differences between months within the same variety (p<0.05). Absence of superscript indicates no significant differences. ... 19
Table 6: Fruit biochemistry of the ten red varieties under study in harvest (September 2018).
LIST OF TABLES
XVIII
letters represent significant differences between the varieties in September (p<0.05). Absence of superscript indicates no significant differences. ... 22
Table 7a: Summary of the best and worst varieties results of different variables under study
(Ecophysiological) of August. ... 36
Table 7b: Summary of the best and worst varieties results of different variables under study
(Ecophysiological) of September. ... 37
Table 8: Summary of the best and worst varieties results of different variables under study
ABBREVIATIONS
XIX ABBREVIATIONS
Ψ, water potential
Ψmd, water potential midday Ψpd, water potential predawn
1103P, grapevine rootstock Paulsen 1103
A, net CO2 assimilation rate or photosynthesis A470, absorbance at 470 nm wavelength
A645, absorbance at 645 nm wavelength A663, absorbance at 663 nm wavelength A/gs, ratio (intrinsic water use efficiency) ANOVA, analysis of Variance
Ca, chlorophyll a Car, carotenoids Cb, chlorophyll b
Ci/Ca, internal CO2 concentration/ ambient CO2 ratio Chl, chlorophyll
CO2, carbon dioxide
DDR, Douro Demarcated Region
DOC, Controlled denomination of origin DW, dry weight
E, transpiration rate
ε, molar extinction coefficient
F´v/F´m, ratio about the quantum efficiency of photosystem II GHG, greenhouse gases
gs, stomatal conductance
HCl, chloride acid
IPPC, Intergovernmental Panel on Climate Change IVDP, Instituto dos Vinhos do Douro and Porto NaOH, sodium hydroxide
OIV, International Organisation of Vine and Wine PPFD, photosynthetic photon flux density
ABBREVIATIONS
XX SS, soluble solid
Tmax, maximum temperature μL, microliter
μmol, micromoles
INTRODUCTION
1 1. INTRODUCTION
1.1. Douro Demarcated Region characterization
The Grapevine (Vitis vinifera) is an important agricultural crop in the world mainly because of the wine production (Pulvirenti et. al., 2015). This plant present a great adaptation capacity to different geographic places and to conditions not favorable (Graça, 2012). Portugal is the 11th Mediterranean wine producer country in the world, in which the wine industry is well rooted with great stability and economic development. The Douro Demarcated Region (DDR) is one of the main wine regions of the continental country with greater density of vineyards (OIV, 2017 and 2018; Fraga et al., 2015) located in the northeast of Portugal and producing the well-known port wine, classified by UNESCO as a world heritage cultural in 2011 (Anderson et al., 2004). The climate is characterized as being typically Mediterranean with rainy and mild winter, such as hot and dry summer. The hottest period is between June and September and the coldest is between November and February (Moutinho-Pereira et al., 2012). The DDR is divided in three sub-regions (Figure 1) very distinct in climatologic and anthropologic: Douro Superior, Cima Corgo and Baixo Corgo. The Douro Superior sub-region is located to the East and its climate is the most severe with semi-arid characteristics with little precipitation (400 mm) and with higher mean temperatures (21°C) (Zamith, 2001; Magalhães, 2008).
Figure 1– The Douro Demarcated Region and the tree sub regions. ( http://www.advid.pt/imagens/comunicacoes/13782178013801).
INTRODUCTION
2
The Cima Corgo sub-region is located in the central part of the Douro region, is influenced by a climate with lower precipitation compared to the Baixo Corgo sub-region (710 mm), and with higher mean summer temperatures (19°C) (Zamith, 2001; Magalhães, 2008) and the Baixo Corgo is the sub-region located in the west and its climate is on the action of the humid currents that come from the Atlantic Ocean although it is surrounded by the Marão and Montemuro mountains (980 mm) (Magalhães, 2008) and is the one with the lowest mean annual temperature oscillating between 18ºC (Zamith, 2001). The Baixo Corgo sub-region is the smallest one, accounting for only 18% of the total area of the DDR. However, is the sub-region where the density of occupation of vineyards is more important, translated in 32% of its total area, against 22% of Cima Corgo and about 9% of the Douro Superior (Table 1). Presenting high unitary productions with potential for the elaboration of quality wines such as controlled denomination of origin (DOCs) Douro (Magalhães, 2008).
Table 1– Characterization of the 3 Sub-Regions (IVDP, 2010).
SUB REGIONS Total area (ha) % Vineyard area (ha) %
Baixo Corgo 45000 18 14501 32.2
Cima Corgo 95000 38 20915 22
Douro Superior 110000 44 10197 9.3
TOTAL 250000 100 45613 18.3
1.2 Effects of climate change in grapevine physiology
The climate change causes a change in the current cultivation of grape varieties. Global warming is heterogeneous in the higher latitudes of the northern hemisphere where there is greater warming of the earth (IPPC, 2014). Forecasts indicate that the global average temperature increases from 1ºC to 3.7ºC at the end of this century compared to the period 1985-2005 due to the increasing rate of increase of greenhouse gases. Precipitation is considered a discontinuous phenomenon can only be evaluated in terms of its change over a considerable period of several decades (IPCC, 2014) but there are models of climate change projecting a reduction in precipitation in subtropical wine regions and an increase in precipitation in northern latitudes and the equator. In addition, changing climate patterns will put more pressure on the supply of fresh water, where some regions have become even drier
INTRODUCTION
3
(Hannah et al., 2013). Besides the soil and the varieties, the environmental factors are the most influence on the vegetative cycle of grapevine. The climate is also considered a determining factor for success in any agricultural system and for agribusiness as evident as wine production and viticulture (Jones, 2012).
Future scenarios predict an increase in lower wine quality, due to production variability, in years whose production is too high, resulting in economic loss losses for the wine row (Bindi et al., 1996). The north of Portugal is also part of this scenario, an increase in the number of days whose temperatures are higher than 40ºC, through projections of bioclimatic indices made for Southern Europe (Fraga et al., 2013).
Until the end of the century, it is estimate an increase of the temperature and changes in precipitation in DDR (Jones, 2012). Predicting an annual average temperature increase of 0.5ºC -1.4ºC in 2020, 1.4ºC -3.3ºC in 2050, and 2.1-5.1 in 2080. For the year 2080, the projections indicate a decrease of precipitation about 10-42%. Douro-Superior is the sub-region that will have the highest level of dryness, changing from dry to very dry compared to other sub-regions (Jones, 2012).
The high temperature promotes precocity in the development and general advancement of the phenological phases of the grapevine and cultural practices (Parker et al., 2011), particularly an earlier onset of flowering, veraison, and harvest (Keller, 2010a) and increase the risk of sunburn of the berries causing changes in the quality of the grapes (Schultz, 2000) translating in to increasing sugar concentration, acidity decrease, mainly malic acid, being the constant tartaric acid with increasing temperature (Coombe, 1987), inhibition of anthocyanin biosynthesis and reduction of grape color (Fraga et al., 2012a) and restrictions in terms of photosynthesis and assimilation of carbon dioxide and reduction of stomatal conductance (Dinis et al.,2014).
The high water deficit in the growing season of grapevine, leads to negative effects (Bou et al., 2019) in leaf transpiration and photosynthesis (Chaves et al., 2010), root development (Dry et al., 2000), leaf and berry mineral nutrition (Gonzalez-Dugo et al., 2010) and also in the plant (Stevens et al., 1995). These effects we may observe in the grapevine, shoot growth (Smart, 1992; Mathews et al., 1989), elevated basal leaf senescence (Lopes et al., 2001), grape sunburn (Grossi et. al., 2012), reduction of total leaf area and carbon assimilation (Chaves et al. 2010; Lebon et al., 2006). The sensitivity of the vine to water deficit, it depends on factors like location which includes soil type and management and varies by nature of the scion and rootstock combination (Lider et al., 1978; Lovisolo et al.,
INTRODUCTION
4
2016). Physiological mechanisms of osmotic adjustment and reduction of stomatal conductance (Rodrigues et al., 2008) like stomatal leaf transpiration control, it constitutes a mechanism for physiological drying by optimizing the use of crop water while avoiding embolism (Lovisolo et al., 2002a, b).
Water deficit along with elevated temperatures lead to leaf fall and a source-sink imbalance, decreasing consequently the plant canopy photosynthesis capacity and incomplete maturation of berries due to the limited availability of starch (Chaves et al., 2007). Time and duration are considered factors that influence the final size and composition of the berries, in addition to the severity of a drought. (Deloire et al., 2004). It is often considered that moderate water stress is good for complete maturation, allowing an optimum concentration of sugars at harvest (van Leeuwen et al., 2009) and increasing tannin and anthocyanin levels in berries (Matthews and Anderson, 1989; Koundouras et al., 2006). In terms of berries acidity is not well-defined yet the water stress there are a few clues that's indicates that water stress leads to a decrease in the amount of organic acids present in the grape in which the main one to be decreed is malic acid (Conde et al., 2007).
Annual and perennial plants like the grapevine with the increase in of CO2 level
responds with an incising of biomass, crop yield, light, net photosynthesis and water-use efficiency (Griffin and Seemann, 1996), but carbon fixation in grapevine is constrained by CO2 levels at any rate up to 800 ppm (Long et al., 2006). Subsequently, the expanded carbon
absorption under raised CO2 frequently prompts an over-gathering of starch in the leaves,
which results in photosynthesis restraint (Paul and Pellny, 2003). Besides that, it remains unclear to what extent the higher carbohydrate levels in the leaves may be translocated to berries altering the ripening process (Mira de Orduña, 2010).
Also, the continuous increase of ultraviolet radiation by climate change has some effects in the grapevine, reduction of photosynthesis, inactivating the photosystem II and the photosynthetic enzymes, with the reduction of chlorophylls and carotenoids with effects in the metabolism of nitrogen, flowering and phenology. At the level of the composition of the grape mainly changes the aromatic fraction of the grape, accumulation of anthocyanin, flavonoids and other metabolites such as amino acids (Schultz, 2000). With these variations of climate, producers and winemakers cannot control these factors directly; they can only control effects on crops by predicting and adopting mitigation strategies (Fraga et al., 2012b).
INTRODUCTION
5
1.3. Climate changes mitigation strategies
There are two categories of measures to address climate alter and its impacts, mitigation measures and adapting measures. Climate change mitigation measures are characterized as measures that require human mediation for a brief period to diminish sources and/or decrease sink of greenhouses gases (GHGs), in specific CO2 (IPCC, 2014), adapting
measures are characterized as measures of reaction of common frameworks or human frameworks to current and future climate change (IPCC, 2014). Climate mitigation and adapting measures build up a confounded relationship and what are the variables of activity of one or the other, mitigation measures are decided by universal assertions and national open arrangements, whereas adapting measures include local entities and private activities (Klein et al. 2007).
In DDR, like other wine-growing regions, the research and adoption of measures are not only relevant to wine-growers, but also to all the different socio-economic sectors that are, to a certain extent, directly or indirectly influenced by winegrowing and winemaking (Fraga et al. al., 2013). In view of this, we must also consider the wine-growing potential of the region, both qualitatively and quantitatively, as a result of the interactions between varieties, rootstocks, soil and climatic conditions and cultural techniques. The regulatory and orography limitations of the region limit winegrowers in the possibility of manipulation of the soil, or even of the characteristics of the soil and climate (Moutinho-Pereira, 2000). Alternatively, winemakers can choose the cultural techniques, the installation of the vineyard, the production phase of the vine, allowing the cultivation to be controlled according to the characteristics of the environment, guaranteeing the characteristics and qualities of the products, considering the costs of interventions and production costs (Reynier, 1986).
The adaptation strategies of the wine and vine sector vary from country to country and the willingness to adopt new practices is related to the degree of change already predicted, regardless of climate change (Battaglini et al., 2009).
The short-term adaptation measures include the following:
Changes in the conduction system that follows the physiological components of the vine, especially in photosynthesis, from the use of medium assets, e.g. light, temperature, water, grape supplements, etc. (Moutinho-Pereira, 2000);
Use of foliar protector depending on the application of a thin film of synthetic containers dispersed in water after spraying in vines (Glenn and Puterka, 2005);
INTRODUCTION
6
The manager water system has reduced the use of water for irrigation to increase the efficiency of water use by the plant (Fraga et al., 2012a);
Fertilization, after soil analysis, is corrective and necessary fertilizer(s), in order to allow the development of production, providing higher yield, productivity and quality of raw material (Magalhães, 2012);
Long-term adaptation measures include the following:
Genetic improvement incentivizes the development of several grape varieties from the addition of genes that confer beneficial characteristics such as abiotic resistance and biotic factors. (Vivier and Pretorius, 2000);
The preparation of the land consists of knowledge of the soil, which allows water and mineral feeding to the plant. The constitution and texture of the soil and subsoil and the existence or not of some impermeable layer are implicit in this knowledge. (Moutinho-Pereira, 2000);
The location of vineyards and vineyards for wine production in the Douro region is regulated by legislation so that position and soil are ideal for wine production and quality. (Magalhães, 2012);
The selection of grape varieties and grafts is a fundamental procedure that the graft type must control the vigor and behavior of each variety, i.e. adapt to different environmental conditions (Moutinho-Pereira, 2000; Magalhães, 2012). This adaptation measure will be the theme under study in this work, selecting grapes varieties more precisely.
1.4. Selection of grape varieties
The varieties recommended or authorized for the production of DOC Porto and DOC Douro wines are regulated by Ministerial Order no. 383/2017 of 20 December, under the provisions of Article 6 of the statute of designations of origin and geographical indication of the DDR, approved by Decree-Law no. 173/2009, of August 3, modified by Decree-Law No. 77/2013 of June 5. In addition to the legislation of varieties officially authorized in DDR must take into consideration the environment in which they are planted, the adaptation of each variety to the region is distinct (IVDP, 2012). Nowadays, the reduction of the varietal range, resultant in part from the widespread unknown about the ensured success of genetic diversity in viticulture in the past, will cause long-term effects mainly related with the influence of climatic changes and global warming on the geographical distribution of vineyards and the
INTRODUCTION
7
steadiness of wine quality (Jones, 2005). Moreover, the lost varieties may be more resistant than those who are used in new vineyards. The success of more resistant varieties to abiotic stresses shows that there is great for a friendly sustainable viticulture.
1.5. Objective of the study
With this work we intend to apply one of the long-term adaptation measures which is the selection of the grapevine varieties best tolerant, in this case to Baixo Corgo sub-region in the DDR. In order to reach this aim, we selected ten national red grapevine varieties among which we wanted to choose the most tolerant ones regarding to: i) eco-physiological parameters and ii) fruit quality parameters.
INTRODUCTION
MATERIAL AND METHODS
9 2. MATERIAL AND METHODS
2.1. Experimental design and plant material
The experiment was undertaken during summer of 2018 in the ampelographic field of Professional School of Rodo, located in Godim, Peso da Régua, specifically in Baixo Corgo sub-region wine-growing of DDR, north of Portugal. Leaves and grape berry samples and physiological parameters were obtained from ten different red varieties (Vitis Vinifera L.) grafted on the 1103 P rootstock. The varieties selected were Touriga Nacional (TNacional), Tinta Barroca (TBarroca), Tinto Cão (TCão), Tinta Fransisca (TFrancisca), Aragonês, Bastardo, Trincadeira, Touriga Franca (TFranca), Touriga Fêmea (TFêmea) and Donzelinho Tinto (DTinto).
Per each vineyard row, 20 grapevine plants were selected and located side-by-side (ensuring the same edaphoclimatic conditions) with an E-W orientation. The 7-year old vines were managed without irrigation and grown using standard cultural practices as applied by commercial farmers. The climate is Mediterranean-like, with a warm-temperate, dry and hot summers (Kottek et al., 2006), with higher precipitation during the winter months and lower during the summer. The soil, essentially of schist origin with a loam- dominated texture, is classified as dystric-surribi aric anthrosols (Agroconsultores and Coba, 1991). Monthly maximum temperature (Tmax) and precipitation values (May to October) are shown in Figure
2.
MATERIAL AND METHODS
10
Temperature values were higher in August (35ºC) and September (34ºC), while in general the value of the precipitation was low (less than 60 mm per month), in July until September was the period that registered less values.
At the dates on which the samples were taken and the measurements of the eco-physiological parameters were carried out on August in veraison and September in harvest, 2018, the maximum temperatures were respectively 35.9°C and 36.1°C and the precipitation value on these two dates was nil.
2.2. Gas exchange, leaf water status and chlorophyll a fluorescence
Relating to physiological monitoring gas exchange parameters (n=6) and water potential (n=5) were determined at morning (9:00–10:30) and midday (13:30–14:30) periods 23th August and 12th September with a portable gas exchange system (LCpro+, ADC, Hoddesdon, England) and a pressure chamber (PMS Instrument Company, Model 1000, Albany, USA), respectively. Incident photosynthetic photon flux density (PPFD) on the leaves was always greater than 1500 μmol m−2 s−1, which is above light saturation point in this species (Flexas et al., 2002). Net CO2 assimilation rate (A), stomatal conductance (gs),
transpiration rate (E), and internal CO2 concentration/ ambient CO2 ratio (Ci/Ca) were
calculated (von Caemmerer and Farquhar, 1981). The A/gs ratio (intrinsic water use
efficiency) was used as an estimate of the water use efficiency.
Chlorophyll a fluorescence features were measured in situ, in the same period of gas exchange measurements, with a pulseamplitude-modulated fluorimeter (FMS 2, Hansatech Instruments,Norfolk, England). Maximum quantum efficiency of photosystem II (PSII) was calculated as Fv/Fm = (Fm − F0)/Fm by measuring the fluorescence signal from a dark-adapted leaf when all reaction centres are open using a low intensity pulsed measuring light source (F0) and during a pulse saturating light (0.7 s pulse of 15,000 "mol photons m−2 s−1 of white light) when all reactions centres are closed (Fm). Leaves were dark-adapted for 30 min using dark-adapting leaf-clips for these measurements.Following Fv/Fm estimation, after a 20 s exposure to actinic light (1500 "mol m−2 s−1), light-adapted steady-state fluorescence yield (Fs) was averaged over 2.5 s, followed by exposure to saturating light (15000 "mol m−2 s−1) for 0.7 s to establish F′m. The sample was then shaded for 5 s with a far-red light source to determine F′0. From these measurements, several fluorescence attributes were calculated (Bilger and Schreiber, 1986a, 1986b;Genty et al., 1989).
MATERIAL AND METHODS
11
2.3. Foliar photosynthetic pigments
The determination of the total concentration of Carotenoids (Car) carried out using an UV/Vis VARIAN spectrophotometer (CARY 100 Bio, Australia) according to Lichtenthaler (1987). Leaves were ground with liquid nitrogen and crushedin 80% acetone. The absorbance was measured at 663, 645 and 470 nm. The results were expressed in mg per g of dry weight extract (mg/g DW) extract according the followed equation: (1000×A470 –1.82Ca–85.02Cb)
/198; where Ca (chlorophyll a) a= 12.25×A663–2.79×A645 and Cb (chlorophyll b) b=21.50×
A645–5.10×A663
2.4. Phytochemical analysis
Berry samples were randomly collected from different positions in the clusters and in the vine (n=100 3 = 300 per row and treatment) in two different dates: 23th August – veraison, and 12th September – maturation (close to harvest) Samples (leaves and fruits) were frozen in liquid nitrogen and stored at −80 °C, posteriorly lyophilized and converted to a fine dried powder.
2.4.1. Total phenols determination
The total phenolic contents (TPC) were determined by the Folin–Ciocalteu method (Zou et al.2011). Briefly, the extract is added, 20 μL sample (4 mg/ml) or gallic acid standards in MeOH, 90 μL distilled H2O and 10 μL of Folin–Ciocalteau reagent solution. After 6 min, 80 μL of 7% Na2CO3 is added and mix gently. The reaction mixture was kept in dark for 2 hours and its absorbance was measured at 750 nm in microplate. TPC was expressed as mg gallic acid equivalents per gram of extract (mg/g DW).
2.4.2. Carbohydrate determination
Soluble sugars (SS) were quantified according to the method with anthrone (Leyva et al. 2008). Summarily, for the extraction the samples (2mg mL-1) were heated to 60 min at 80 ºC, centrifuged at 12000 g and the supernatant removed. For the quantification 750 µL of anthrone was added to 250 μL of sample or glucose standards and incubated 20 min at 100 ºC. Finally, the samples were left 20 min at room temperature and read (microplate) at 625 nm. Carbohydrates was expressed as mg glucose per gram of extract (mg/g DW).
MATERIAL AND METHODS
12
2.4.3. Anthocyanin quantification
Anthocyanins were quantified according to the differential pH method (Lee et al., 2005). The reagents used in this method were a 0.025 M potassium chloride solution at pH 1.0 and a 0.4 M sodium acetate solution at pH 4.5. Thus, two dilutions of the samples to be tested, one with a solution of pH 1.0 and one with a solution of ph4.5, were prepared.
After 25 minutes of the preparation of the samples to be tested, the absorbances were read at 520 nm and 700 nm. The difference in the absorbance value of the anthocyanin pigments at 520 nm is proportional to the pigment concentration of the anthocyanins. The reason why an absorbance measurement at 700 nm occurs is turbidity correction. The degraded anthocyanins in polymer form are resistant to colour change irrespective of pH and therefore are not included in the measurements because they absorb both pH 4.5 and pH 1.0
The concentration of anthocyanin pigment concentration, expressed as cyanidin-3-glucoside equivalents, as follows equation:
[ ] ( )
A = (
MW (Molecular Weight) = 449,2 g/mol DF = Dilution Factor
(molar extinction coefficient) = 26900 L/(mol.cm)
2.4.4. Tannins quantification
The tannin quantification was done according to (Price et al., 1978) with a 4% vanillin solution and a concentrated solution of HCL as reagents at 500 nm using standard solutions of catechin as calibration line. The samples (10 μl) or standard cathechin solutions were mixed with 200 μl of 4% vanillin solution and 100 μl of concentrated HCl in well of a 96 well plate. After 15 min the absorbance of the mixture was measured using the microplate reader (SPECTROstarNano, BMG labtech, Ortenberg,Germany) The results were expressed in mg equivalents of catechin per gram of extract (mg/g DW)
MATERIAL AND METHODS
13
2.5. Fruit sugar and alcohol degree 2.5.1. Brixº
Brixº were measured in triplicate (n = 30 per treatment and variety) using an ATAGO digital refractometer (CO., LTD. Tokyo, Japan). The Brix scale or degrees Brixº is numerically equal to the percent of sugar and other dissolved solids in the solution (Ball, 2006). In many cases it is assumed that all of the dissolved solute is sugar. The Brixº scale is probably the most common scale used in winemaking, because the Brixº of the initial juice or must can be directly related to the alcohol content of the final fermented product, assuming that the dissolved solutes are all sugar.
2.5.2. Percentage of alcohol probable
The method used was by refractometry, using a hand refractometer (OPTIKA HR-110N, Italy) and the juice was extracted directly from the berries (Carbonneau and Champagnol, 1993).
2.5.3. Reducing sugar
The internal method for the determination of reducing sugars (RS) translates into the reduction of a cupro-alkaline solution by titration (Lane and Eynon, 1923).
In a 250 ml Erlenmeyer flask, 5 ml of Fehling A solution, 5 ml of Fehling B solution, 50 ml of distilled water and boiling regulators are charged. The erlenmeyer is boiled, 3 drops of 1% methylene blue solution is added and titrated with the sample until the deep blue color disappears. The titration must take place in the maximum time of 3 minutes, always in boiling and agitation.
The amount of reducing sugars is determined by the amount of reducing sugars: RS (g/L) = 50/V (sample spent volume in mL).
2.6. Fruit acidity parameters
The quantification of total acidity was, performed using Fourier transform infrared spectrometry (FTIR) and the quantification of tartaric and malic acids were measured enzymatically using Miura (One, TDI S.A).
2.7. Statistical analysis
Data analysis was performed through descriptive and inferential statistics, using SPSS-23.0 software (Statistical Package for the Social Sciences). In order to perform the inferential
MATERIAL AND METHODS
14
analysis and taking into account the fulfillment of the necessary criteria for the performance of parametric hypothesis tests, we conclude that the sample follows a normal distribution in the variables under study. Thus, to verify the existence of differences in the parameters under study in function of the Variety and the Stage, as well as their respective interaction, the two-way factorial ANOVA test was applied, followed by the post hoc Tukey´s test. In this sense, we will analyze the effect not only of each of the factors but also the possible influence that each of the factors can exert on the response of the dependent variable to the other factor. This effect is called the effect of interaction (or moderation) between the factors (Marôco, 2014).
RESULTS AND DISCSSION
15 3. RESULTS AND DISCUSSION
3.1. Ecophysiological parameters
Analyzing the leaf water potential (Ψ) measured at both predawn (Ψpd) and midday
(Ψmd) in August (Table 2), Trincadeira showed the lowest value of Ψpd (p<0.05), as well as,
TBarroca, for Ψmd variable (p<0.05). In September (Table 2), TFrancisca has the highest
values, whereas relating to Ψmd the lowest value was obtained from TNacional and TCão.
Table 2– Grapevine leaf water potential (Ψ) measured at both predawn (Ψpd) and midday (Ψmd) of August and
September 2018. Statistical analysis was performed using a two-way factorial ANOVA. Different lower case letters represent significant differences between the varieties in the same month (p<0.05). Absence of superscript indicates no significant differences.
Stage × Variety Ψpd Ψmd Ψpd Ψmd
(Mpa) (Mpa) (Mpa) (Mpa)
August September TNacional -0.590±0.338 ab -1.11±0.624 ab -0.793±0.043 b -1.23±0.026 c TBarroca -0.638±0.057 ab -1.48±0.068 b -0.742±0.036 b -0.744±0.418 a TCão -0.573±0.015 ab -1.20±0.041 ab -0.680±0.021 b -1.14±0.030 bc TFrancisca -0.460±0.012 a -0.932±0.112 a -0.496±0.086 a -0.658±0.022 a Aragonês -0.658±0.040 ab -1.33±0.089 ab -0.758±0.067 b -0.922±0.031 ab Bastardo -0.598±0.068 ab -1.22±0.051 ab -0.740±0.027 b -0.748±0.041 a Trincadeira -0.810±0.174 b -1.31±0.117 ab -0.744±0.055 b -0.816±0.040 a TFranca -0.710±0.037 ab -1.15±0.015 ab -0.743±0.024 b -0.850±0.059 ab TFemêa -0.642±0.090 ab -1.17±0.047 ab -0.700±0.073 b -0.810±0.026 a DTinto -0.633±0.018 ab -0.917±0.029 a -0.732±0.116 b -0.732±0.042 a
In August, for the gas exchange parameter in the morning period (Table 3a) the varieties TNacional, TCão and DTinto and TFrancisca presented the lowest values. However, in the midday period (Table 3b) TBarroca had the high values for gs, and A. Also, TFranca showed the higher values of A, WUE, E and Fv‟/Fm‟. Regarding TFrancisca and TNacional varieties showed lowest values in morning, the variety TFrancisca also showed the lowest values in midday parameters with the variety TCão.
RESULTS AND DISCSSION
16
Table 3a– Gas exchange parameters in the morning period of August and September 2018. Statistical analysis was performed using a two-way factorial ANOVA. Different lower case letters represent significant differences between the varieties in the same month (p<0.05), and * represent significant differences between months within the same variety (p<0.05). Absence of superscript indicates no significant differences.
Stage × Variety gs A WUE
Ci/Ca F´v/F´m E
(mmol m–2 s–1) (μmol m–2 s–1) (mmol.mol-1) (mmol m–2 s–1)
August Morning TNacional 135.3±11.7 b 8.96±1.92 de* 64.1±5.63 a* 0.648±0.029 d* 0.642±0.043 4.25±0.587 c* TBarroca 229.5±32.2 a 10.3±2.47 cd 48.7±8.43 bc 0.711±0.041 bc 0.683±0.019 5.85±0.855 ab* TCão 187.2±35.2 ab 9.31±1.94 cd 42.9±6.07 bc 0.739±0.023 ab* 0.687±0.007 6.00±0.797 a* TFrancisca 130.6±35.5 b 6.40±0.924 e 53.2±6.38 b* 0.704±0.029 bc* 0.602±0.092 4.40±0.848 bc* Aragonês 235.6±64.1 a 13.4±0.857 ab* 50.5±5.15 bc* 0.681±0.023 cd* 0.725±0.122 * 6.16±1.725 a* Bastardo 262.2±57.7 a* 12.0±1.66 abc* 47.5±2.27 bc* 0.729±0.020 ab* 0.674±0.014 * 4.86±0.590 abc* Trincadeira 226.4±64.9 a* 14.1±1.61 a* 45.8±7.91 bc 0.718±0.024 abc 0.628±0.018 5.74±0.640 ab* TFranca 238.3±47.9 a* 10.2±1.16 cd 42.1±4.67 c* 0.742±0.025 ab 0.743±0.186 5.17±0.576 abc* TFemêa 252.9±49.9 a* 11.2±1.52 bcd* 40.6±6.63 c 0.747±0.028 ab* 0.622±0.066 5.01±0.549 abc* DTinto 210.1±46.2 ab* 9.40±1.32 cd 42.1±5.18 c 0.758±0.021 a 0.599±0.043 * 4.85±0.556 abc*
September
TNacional 167.6±9.99 bc 11.07±2.63 a 57.3±5.11 a 0.695±0.036 e 0.643±0.028 a 2.88±0.491 ab TBarroca 235.8±32.3 a 11.0±0.936 ab 52.2±5.06 ab 0.729±0.027 de 0.662±0.010 a 3.26±0.377 a TCão 179.5±10.2 abc 8.22±0.684 c 43.4±3.56 cde 0.766±0.024 abcd 0.646±0.033 a 2.96±0.350 ab TFrancisca 125.4±30.9 c 5.38±0.441 d 44.8±4.96 bcde 0.772±0.023 ab 0.560±0.022 bc 2.21±0.206 b Aragonês 228.6±45.7 a 9.96±0.819 abc 38.9±3.05 e 0.771±0.014 abc 0.639±0.027 ab 3.57±0.193 a Bastardo 197.0±40.6 ab 8.31±1.62 abc 39.6±4.73 de 0.768±0.020 abcd 0.609±0.053 ab 2.96±0.394 a Trincadeira 151.4±51.7 bc 8.12±1.58 c 48.1±6.48 bcd 0.741±0.024 bcd 0.612±0.044 ab 2.58±0.503 ab TFranca 152.1±28.6 bc 9.22±0.953 abc 49.8±2.79 abc 0.729±0.012 cde 0.609±0.043 ab 2.96±0.356 ab TFemêa 180.6±29.1 abc 8.02±1.29 c 40.5±6.39 de 0.788±0.018 a 0.468±0.035 c 3.20±0.560 a DTinto 167.0±26.3 bc 8.75±1.44 bc 45.7±4.75 bcde 0.755±0.029 abc 0.574±0.056 bc 2.98±0.285 a
RESULTS AND DISCSSION
17 Table 3b– Gas exchange parameters in the midday period of August and September 2018. Statistical analysis was performed using a two -way factorial ANOVA. Different lower case letters represent significant
differences between the varieties in the same month (p<0.05), and * represent significant differences between months within the same variety (p<0.05). Absence of superscript indicates no significant differences.
Stage × Variety gs A WUE
Ci/Ca F´v/F´m E
(mmol m–2 s–1) (μmol m–2 s–1) (mmol.mol-1) (mmol m–2 s–1)
August Midday
TNacional 130.9±26.4 ab* 7.41±1.29 ab* 61.5±4.27 a 0.658±0.025 b 0.664±0.107 * 2.87±0.714 b* TBarroca 179.7±56.4 a* 9.00±2.05 a* 50.7±7.90 b 0.708±0.038 a 0.615±0.118 * 4.28±1.09 a* TCão 111.3±25.3 ab* 6.17±1.38 ab* 55.7±3.59 ab 0.692±0.018 ab 0.641±0.059 * 3.18±0.268 b* TFrancisca 87.9±12.7 b* 4.73±0.671 b* 47.8±7.86 bc* 0.737±0.037 a 0.574±0.088 * 2.68±0.337 ab* Aragonês 144.8±25.2 ab* 7.62±1.37 ab* 49.6±4.81 bc* 0.712±0.017 a 0.645±0.076 * 3.97±0.479 ab* Bastardo 136.0±49.9 ab* 6.82±2.18 ab* 54.3±6.33 ab 0.691±0.027 ab 0.632±0.098 * 3.68±0.387 ab* Trincadeira 158.4±57.6 ab* 8.96±1.69 a* 49.1±6.36 bc 0.709±0.019 a 0.690±0.073 * 3.97±0.839 ab* TFranca 165.5±35.7 a* 8.25±1.23 a* 51.0±6.37 abc 0.701±0.027 ab 0.661±0.086 * 4.43±0.576 a* TFemêa 132.1±52.3 ab* 6.68±1.05 ab* 51.3±5.04 abc 0.711±0.016 a 0.601±0.071 * 3.90±0.745 ab* DTinto 110.7±47.9 ab 6.49±1.87 ab 43.2±6.55 c 0.744±0.034 a 0.640±0.086 * 3.50±1.22 ab*
September
TNacional 47.5±6.9 e 4.97±0.595 ab 53.5±12.4 ab 0.657±0.117 0.421±0.039 c 1.90±0.618 bc TBarroca 66.9±10.7 bcde 2.97±0.676 de 65.3±11.3 a 0.676±0.075 0.442±0.035 bc 1.97±0.442 bc TCão 60.3±18.2 cde 3.81±0.677 bcd 58.6±8.70 ab 0.703±0.055 0.511±0.049 abc 1.95±0.446 bc TFrancisca 42.4±6.40 e 1.68±0.426 f 53.8±10.2 ab 0.726±0.049 0.503±0.053 abc 1.63±0.177 c Aragonês 75.2±24.7 bcd 4.50±0.851 ab 55.7±6.88 ab 0.698±0.024 0.550±0.021 a 2.77±0.970 ab Bastardo 88.2±19.6 ab 4.01±1.99 bcd 57.1±5.58 ab 0.693±0.022 0.501±0.054 abc 2.67±0.449 ab Trincadeira 51.5±10.3 de 2.61±0.489 ef 49.9±5.89 b 0.705±0.056 0.466±0.036 abc 2.07±0.706 abc TFranca 108.2±20.8 a 5.30±0.910 a 59.4±2.78 ab 0.682±0.016 0.536±0.033 ab 3.06±0.646 a TFemêa 67.1±12.3 bcde 4.17±0.600 abc 56.2±5.76 ab 0.711±0.039 0.427±0.022 c 2.23±0.360 abc DTinto 84.1±9.07 ab 4.33±0.848 ab 60.2±5.15 c 0.736±0.612 0.504±0.053 bc 2.80±0.457 bcd
RESULTS AND DISCSSION
18
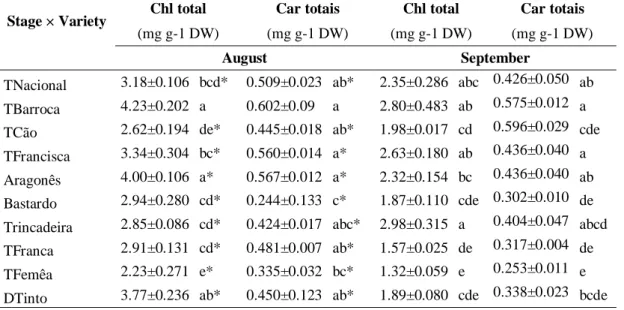
Analyzing the month of September, for the gas exchange parameters in the morning period (Table 3a) the Aragonês and TBarroca were the varieties with the highest values. However, in the midday period (Table 3b) TFranca had the highest values of gs, A, and E. Also, Aragonês showed high values of A, WUE, E and Fv‟/Fm‟. Leaf temperature increases in the midday period, because of the decline in evaporative cooling under lower E, A can be inhibited through decayed electron transport rate and reduced ribulose-1,5-biphopshate (RuBP) regeneration capacity (Medrano et al., 2003). This effect is probably what happen with TFrancisca and Trincadeira. Also, stomatal limitations seem to occur in these varieties due the high Ψmd values obtained and low gs and consequently A. Stomatal aperture
regulation limits the CO2 entry into leaves and subsequently leads to a decrease of A as a
result of the reduced CO2 availability (Centritto et al., 2005). The variation in gs is also in
close association with the lower E values obtained as reported by Poni et al. (2009). Taking into account these factors, TBarroca and Aragonês seems to be well adapted to this terroir. The foliar pigments (Table 4) corroborate this sentence due the high values of Chl and also the Car of both TBarroca and Aragonês, which has an important role in preventing Chl degradation, contrarily to TCão with the lower Total Chl concentration which is a sign of oxidative stress due to Chl degradation and/or reduced Chl synthesis (Smirnoff, 1993). Thus, the relationship between Chl and Car may be used as a potential indicator of photooxidative damage (Moutinho-Pereiraet al 2007).
Table 4–-Foliar pigments of the ten red varieties under study in the months of August and September 2018.
Statistical analysis was performed using a two-way factorial ANOVA. Different lower case letters represent significant differences between the varieties in the same month (p<0.05), and * represent significant differences between months within the same variety (p<0.05). Absence of superscript indicates no significant differences.
Stage × Variety Chl total Car totais Chl total Car totais
(mg g-1 DW) (mg g-1 DW) (mg g-1 DW) (mg g-1 DW)
August September
TNacional 3.18±0.106 bcd* 0.509±0.023 ab* 2.35±0.286 abc 0.426±0.050 ab TBarroca 4.23±0.202 a 0.602±0.09 a 2.80±0.483 ab 0.575±0.012 a TCão 2.62±0.194 de* 0.445±0.018 ab* 1.98±0.017 cd 0.596±0.029 cde TFrancisca 3.34±0.304 bc* 0.560±0.014 a* 2.63±0.180 ab 0.436±0.040 a Aragonês 4.00±0.106 a* 0.567±0.012 a* 2.32±0.154 bc 0.436±0.040 ab Bastardo 2.94±0.280 cd* 0.244±0.133 c* 1.87±0.110 cde 0.302±0.010 de Trincadeira 2.85±0.086 cd* 0.424±0.017 abc* 2.98±0.315 a 0.404±0.047 abcd TFranca 2.91±0.131 cd* 0.481±0.007 ab* 1.57±0.025 de 0.317±0.004 de TFemêa 2.23±0.271 e* 0.335±0.032 bc* 1.32±0.059 e 0.253±0.011 e DTinto 3.77±0.236 ab* 0.450±0.123 ab* 1.89±0.080 cde 0.338±0.023 bcde
RESULTS AND DISCSSION
19
3.2. Carbohydrates
Analyzing the results obtained for the carbohydrate (Table 5), we can see that Aragonês, Trincadeira, TFranca and TNacional present the highest concentration in August compared to the other varieties. However, TFêmea and Bastardo presented the lowest values for this parameter.
Table 5– Fruit biochemistry of the ten red varieties under study in the months of August and September 2018.
Statistical analysis was performed using a two-way factorial ANOVA. Different lower case letters represent significant differences between the varieties in the same month (p<0.05), and * represent significant differences between months within the same variety (p<0.05). Absence of superscript indicates no significant differences.
Stage × Variety Carbohydrates Phenols Tannins Antocianins
(mg/g DW) (mg/g DW) (mg/g DW) (mg/g DW)
August
TNacional 127.1±7.70 ab* 91.9±4.91 bc 14.9±0.904 d* 4.58±0.453 b* TBarroca 124.0±7.63 bc* 81.9±4.20 de* 6.86±0.588 f* 2.36±0.177 cd* TCão 122.5±9.08 bcd* 87.5±3.73 cd 15.6±0.490 cd 1.12±0.135 g* TFrancisca 111.4±6.90 cde* 91.4±3.73 bc* 3.85±0.335 g* 2.05±0.030 de* Aragonês 139.4±8.48 a* 91.5±4.92 bc 17.0±0.335 b* 2.67±0.76 c* Bastardo 109.4±3.51 de* 82.7±2.49 de* 18.5±0.864 a* 1.09±0.059 g* Trincadeira 139.4±7.82 a* 78.1±3.22 e* 12.0±0.296 e* 1.12±0.235 g* TFranca 128.5±6.76 ab* 93.8±2.14 bc* 16.6±0.896 bc* 5.37±0.482 a* TFemêa 105.2±5.84 e* 104.6±8.07 a 11.6±0.481 e* 1.62±0.209 ef* DTinto 123.7±5.75 bc* 98.0±2.50 ab 16.2±0.274 bc* 1.42±0.101 fg* September TNacional 152.7±5.60 e 92.5±4.34 b 20.3±1.18 c 5.21±0.210 b TBarroca 209.5±4.42 bc 62.8±4.65 e 17.8±1.55 def 2.86±0.319 d TCão 163.8±12.2 de 90.1±3.71 bc 16.0±1.14 fg 3.09±0.478 cd TFrancisca 235.8±12.5 a 64.1±2.56 e 18.8±0.895 cde 3.19±0.284 cd Aragonês 225.6±14.6 ab 94.5±3.37 b 19.3±0.939 cd 3.58±0.058 c Bastardo 229.2±14.4 ab 89.1±10.1 bc 9.27±0.569 h 1.32±0.187 f Trincadeira 186.2±13.9 d 69.4±2.63 e 16.8±1.28 efg 3.27±0.351 cd TFranca 171.4±15.5 de 111.1±2.54 a 24.6±1.18 b 6.37±0.487 a TFemêa 187.0±14.9 cd 79.4±1.60 d 14.8±0.588 g 2.12±0.059 e DTinto 162.5±6.48 e 83.1±4.05 cd 29.7±1.14 a 2.09±0.227 e
In September, TFrancisca, Bastardo and Aragonês varieties showed the highest carbohydrate concentration, and all varieties had a significant increase compared to the previous month. The varieties TNacional, DTinto and TCão present the lowest values for this parameter. The carbohydrates are blocks of organic compounds, they store energy and, such as cellulose, hemicellulose and gluco-protein (Mahmoudzadeh et al., 2017). These are stored in perennial woody organs the year before and photoassimilates synthesized in leave in higher plants, like
RESULTS AND DISCSSION
20
grapevine, are stored in the cytoplasm or transitory starch accumulation in chloroplasts during the day (Hunter et al., 1995). Carbohydrates are the main source of energy and carbon for the grapevine and are also important signaling factors in response to pathogens and abiotic stresses, there is a linear correlation between leaf area to fruit ratio and the formation of carbohydrate reserves in woody parts and roots (Dunn Covington et al., 2016). Regarding to this parameter TFrancisca seems to be the variety with best results.
3.3. Phenols
Analyzing the results obtained for the phenols presented in Table 5 the TFêmea, DTinto and TFranca varieties present the highest concentration in August, contrarily to, Trincadeira, TBarroca and Bastardo, that show the lowest phenolic concentration in this month. In September, TFranca, Aragonês and TNacional varieties showed the highest phenols concentration and all varieties had a significant increase in this month (p<0.05). The varieties TBarroca, TFrancisca and Trincadeira, presents the lowest values in September.
Phenolic compounds are among the largest groups that plants have, being part of one of the largest classes of metabolites that give the plant functions such as pigmentation and growth, but also provide defense against biotic and abiotic factors (Naczk et al.2006), such as temperature changes, water shortages, radiation, mineral, ultraviolet nutrient shortages, among others (Król et al., 2014). It is in the grape berries, peels and seeds where we can find a greater amount of phenolic compounds (Waterhouse, 2002). In the plant growth process, environmental characteristics, such as hours of exposure to sunlight, amount of water available in the soil, affect the amount of total phenols present. A large amount of phenolic compounds will appear in fruit that the plant does not suffer from extreme stress because if so, the vine would use them in the leaf (Matthews et al., 1990; Singleton, 1988). Phenolic compounds are associated with antioxidant activity showing beneficial health effects (Dinis et al., 2016; Achkar et al., 2013). Based on the results obtainedand what was quoted in terms of literature, TFranca and Aragonês are the varieties with the great results for phenolic compounds. While, TBarroca, TFrancisca and Trincadeira are the varieties with the worst results presented the low concentration of phenolic compounds.
3.4. Tannins
Regarding to tannins concentration (Table 5), Bastardo, Aragonês and TFranca varieties present the highest values in August while, TFrancisca and TBarroca present the
RESULTS AND DISCSSION
21
lowest ones. In September, DTinto, TFranca, TNacional and Aragonês varieties showed the highest concentration and Bastardo, TFêmea and TCão varieties presents the lowest values. All varieties had a significant increase in tannins concentration (p<0.05). Tannins are polyphenolic compounds that cause protein precipitation. The tannins are divided into hydrolyzable and non-hydrolyzable classes. The types of tannins mostly found in wine are condensed. The condensed tannins or proanthocyanins are polyphenolic compounds that cause anthocyanins to develop. They are found in solid components (seed and skin), but also in grape pulp. In turn, hydrolyzable tannins are complex polyphenols that can be degraded in smaller fragments such as sugars and phenolic acids by pH changes as well as enzymatic and non-enzymatic hydrolysates (Garrido and Borges, 2013). Condensed tannins production route is part of the flavonoid synthesis pathway (Lacampagne et al., 2010), there is a positive association between temperature and the number of seeds or total proanthocyanidin levels per berry at harvest (del Rio and Kennedy, 2006; Ewart and Kliewer, 1977). Similar impacts in sun-exposed berries (Crippen and Morrison, 1986) have been recorded, reiterating the significance of discriminating between irradiation and temperature impacts. It should also be considered that the practice of winemaking can transform grape phenolic extraction into wine considerably (Kennedy, 2008; Zamora, 2003). Based on the results obtained, the variety DTinto, TFranca and TNacional seems to be the varieties best suited for this parameter, presenting the highest tannins concentration, while Bastardo and TFêmea varieties indicate higher levels of stress presenting the lowest concentration of tannins as a response to high temperature and irradiation.
3.5 Anthocyanins
Analyzing the results obtained for the anthocyanins (Table 5), the TFranca, TNacional and Aragonês varieties present the highest anthocyanins concentration in August compared to the other varieties, while Bastardo, TCão and Trincadeira presents the lowest values. In September all varieties had a statistically significant increase in anthocyanins concentration. TFranca, TNacional and Aragonês varieties showed the highest concentration and the varieties Bastardo, DTinto and TFêmea showed the lowest ones.
Anthocyanins are secondary metabolites that result from the complex under-regulation of multiple genes at the transcriptional level being synthesized by the flavonoid pathway. Temperature and UV radiation stimulate anthocyanin synthesis gene expression (He et al., 2010). Also important in the production of anthocyanins are the hormones that regulate grape
RESULTS AND DISCSSION
22
growth. Anthocyanins are particularly influenced bylow temperatures (14/9 ºC day/night) are not conducive to large anthocyanin concentrations (Coombe, 1987), temperatures of 30 ºC and above also result in reduced synthesis of anthocyanin (Buttrose and Hale., 1971; Spayd et al., 2002; Tarara et al., 2008) which may be completely and irreversibly inhibited at very elevated temperatures as Kliewer (1977) showed for Emperor grapes at 37 ºC day temperatures irrespective of exposure to light. This suggested that the temperature of grape juice can frequently achieve concentrations in hot environments that prevent the development of anthocyanins and thus decrease the color of grapes.
Based on the results obtained,the variety TFranca seems to be the variety best suited for this parameter, presenting the highest anthocyanin production. While, Bastardo, DTinto and TFêmea varieties indicates lower levels of stress compared to TFranca. The Bastardo variety presented the lowest concentrations of anthocyanin possibly as a response to high temperatures, concluding that this may be less tolerant.
3.6 Fruit sugar and alcohol degree
Analyzing the Table 6 the Bastardo, TNacional and Aragonês varieties present the highest concentration of the reduction sugar which probably gives high alcohol, that are also correlated with the highest water potential for September period (Table 2) and higher evaporative demand (E) (Table 3). The varieties DTinto, TFrancisca and TCão presented the lowest value for brix degree, reducing sugar and for the probable alcohol.
Table 6– Fruit biochemistry of the ten red varieties under study in harvest (September 2018). Statistical analysis
was performed using a two-way factorial ANOVA. Different lower case letters represent significant differences between the varieties in September (p<0.05). Absence of superscript indicates no significant differences.
Stage × Variety Brixº Reducing sugars Probable Alcohol
(g) (% vol.) September TNacional 24.5±0.691 ab 241.43±7.23 ab 14.2±0.437 abc TBarroca 23.7±1.93 abc 239.53±11.0 ab 13.5±0.920 bcd TCão 23.1±0.104 bc 226.3±1.21 bc 13.4±0.075 dcd TFrancisca 21.8±0.458 cd 212.2±4.61 cd 12.5±0.260 de Aragonês 25.1±0.318 ab 247.6±3.58 a 14.6±0.202 ab Bastardo 25.6±0.214 a 253.2.7±2.37 a 14.9±0.133 a Trincadeira 23.4±0.584 abc 229.4±6.07 bc 13.5±0.321 bcd TFranca 24.2±0.185 ab 238.4±2.05 ab 13.4±0.105 abc TFemêa 23.2±0.720 bc 227.2±8.15 bc 13.2±0.749 cd DTinto 20.9±0.930 d 194.9±7.16 d 11.6±0.370 e
RESULTS AND DISCSSION
23
Reducing sugars are a type of sugars that have a free carbonyl and ketone group capable of oxidizing in the presence of oxidizing agents in alkaline solutions. The main reducing sugars in the grape are glucose and fructose accumulated in the vacuole of flesh cells (Fontes et al., 2011), their increase of concentration in grape berry composition is s due to a blockage of phloem transport into the berries so that the water and sugar supplied by phloem sap was cut of (Coombe and McCarthy, 2000) it is also especially related with the warm climate. We can also say that the increase of Brixº degree is correlated with the diminution of the berry weight (Coombe and McCarthy, 2000) due to height temperatures (30 ºC) which may lead to higher suspended solid concentrations. Brix levels higher than 24–25 Brixº are likely not due to photosynthesis and sugar transport from leaves and wood, but to concentration by evaporative loss (Keller, 2009, 2010a, b) values has we may observe in Table 6. Based on the results obtained and what was cited in the literature, the DTinto and TFrancisca varieties presented the best results, according the new trend market, due the low sugar and alcohol content.
3.7 Acidity parameters
Analyzing the results obtained for the acidity parameters (Figure 3), the variety TFrancisca present the highest acidity concentration in September, the month of harvest, compared to the other varieties. The Aragonês present the lowest value for this parameter in the same month. Acidity in grapes and wine depends on the ratio of organic acids to potassium concentration (Coombe, 1987; Tarara et al., 2008). The tartaric and malic acids are mostly synthesized in grape berry and accumulated during the first growth period of the grape berry. The tartaric acid is accumulated shortly after the bloom (also flowering or anthesis) during of the cell division is synthesized from a precursor ascorbic acid, during the rippening phase its concentration decreases due to dilution in terms of temperature this stable acid is not very affected (Ollat et al., 2002). Malic acid is the acid most affected by environmental conditions than tartaric acid especially by temperature its concentration also varies according to the variety (Ollat et al., 2002). Lower concentrations of acidity are also associated with greater pH, although potassium accumulation, which depends on temperature itself, affects the connection. In particular, potassium concentrations rise considerably during grape maturation in grape clusters linked to redistribution from other vegetative vine organs above ground. (Hale, 1977; Williams and Biscay, 1991). Boulton (1980a) suggested that potassium enters in berry cells in direct exchange for protons thus affecting berry and must pH for a
RESULTS AND DISCSSION
24
given total acidity (Boulton, 1980b, c). Based on the results obtained and what was quoted in terms of literature the variety TFrancisca showed the best results because presents the highest concentration of malic acid and total acidity.
Figure 3– Acid parameters of the ten red varieties under study in harvest (September 2018): Tartaric acid, Malic
acid and Total acidity. Statistical analysis was performed using a two-way factorial ANOVA. Different lower case letters represent significant differences between the varieties in September (p<0.05). Absence of superscript indicates no significant differences.
CONCLUSION
25 4. CONCLUSION
The considerations presented in this paper should be understood with a reservation that reflects only the Baixo Corgo, a sub-region of the DDR. Therefore, its generalization should be done cautiously in terms of eco-physiological and biochemical parameters of the grapevine. However, these parameters studied during the summer season allowed the analysis of the responses to abiotic stress of ten red grapevine varieties. Relatively physiological response in midday period (more severe), the varieties that showed best response, are the Aragonês, TBarroca, TFranca and Touriga Nacional. Regarding to biochemical parameters, the varieties Aragonês, TFranca and TNacional present higher carbohydrates, phenolics, anthocyanins and tannins compounds. In this way, the varieties Aragonês, TFranca and TBarroca are the varieties with best results in this terroir and the varieties Trincadeira and TFrancisca both showed the worst ones. These results are scientifically important because they reinforce the selection of vine varieties as a good measure of long-term mitigation, which will be widely implemented in the sub-region under study and in the other sub regions of the DDR, since there is no contrary trend to climate change and failure to adopt such a measure could undermine the practice of viticulture as we know it today.
CONCLUSION