Faculty of Engineering of the University of Porto
Detection and Location of Non-Technical Losses
in Low Voltage Distribution Networks
Luís Acácio Mendes Marques
F
INAL VERSIONDissertation conducted under the
Integrated Master in Electrical and Computers Engineering
Major Energy
Supervisor: Helder Filipe Duarte Leite (Prof. Dr.)
Co-supervisor: Nuno Filipe Gonçalves da Silva (Dr.)
ii
iii
Abstract
The undergoing changes in the paradigm of distribution networks, and particularly in Low Voltage (LV) networks, which are starting to integrate decentralized and smart management systems such as smart meters, enable the implementation of an Advanced Metering Infrastructure (AMI). These changes provide an opportunity to the deployment of new features such as the detection and location of Non-Technical Losses (NTLs). In fact, the problem of non-technical losses occurs mainly in LV networks as the majority of the consumers is present in these networks.
An efficient electrical power system, which supplies energy to customers in the most economical way, is the main goal of network’s users. NTLs represent energy supplied that is not billed despite being reflected in the price paid by all the customers. In addition, these losses affect the quality of service and increase not only the technical losses in networks but, moreover, the amount of energy that needs to be produced in power plants. Therefore, the detection and location of NTLs is of the utmost importance for reducing the system’s operational costs, increasing the revenues for distribution system operators as well as reducing the energy price for customers.
This dissertation advances a new approach that leverages the information (e.g. electrical measures) provided by the smart meters installed at the costumers’ premises to perform, in the first algorithmic step, the detection of NTLs and, in the second algorithmic step, proceed to their location. Even in the presence of an AMI, the distribution system operator frequently does not have all the data that characterizes the low voltage network (e.g. branches’ physical parameters). Nonetheless, the proposed method is applicable even when most of these characteristics are unknown. In addition, the advanced methodology is not dependent of an accurate estimation of technical losses, reducing the uncertainty in the overall process. A case study of a real LV network is assessed to validate the adequacy of the advanced methodology under different scenarios of knowledge of the characteristics of the network.
v
Resumo
As atuais mudanças no paradigma das redes de baixa tensão, nas quais começam a ser integrados sistemas de gestão descentralizados e com funcionalidades avançadas, como os contadores inteligentes, possibilitam a implementação de uma infraestrutura avançada de medição nestas redes. Estas mudanças proporcionam uma oportunidade singular para o desenvolvimento de novas ferramentas e funcionalidades como a deteção e localização de perdas não técnicas em redes de baixa tensão. O potencial da deteção e localização de perdas não técnicas em redes de baixa tensão está diretamente relacionado com o facto da maioria dos consumidores estar presente nas mesmas.
Um sistema elétrico de energia eficiente, que alimenta os seus utilizadores da forma mais económica possível é o principal objetivo para os intervenientes presentes na cadeia de valor do sector elétrico. A perdas não técnicas representam energia fornecida que não é faturada, apesar de ser refletida no preço da energia pago por todos os consumidores. Além disso, estas perdas afetam a qualidade de serviço e energia, aumentando não só as perdas técnicas como também a quantidade de energia produzida nas centrais elétricas. A deteção e localização de perdas não técnicas, é assim da maior importância, no sentido de reduzir os custos de operação do sistema, aumentando as receitas para os operadores do sistema e diminuindo a fatura energética para os clientes.
Esta dissertação propõe uma nova abordagem que, utilizando as medidas fornecidas pelos contadores inteligentes nas instalações de consumo, realiza numa primeira fase a deteção de perdas não técnicas e na segunda fase procede à sua localização. Mesmo na presença de uma infraestrutura avançada de medição, frequentemente o operador da rede de distribuição não tem todos os dados que caracterizam a rede de baixa tensão, como por exemplo os parâmetros físicos das linhas/cabos. Não obstante, a metodologia desenvolvida é aplicável mesmo quando a maior parte destas características são desconhecidas. A metodologia desenvolvida não depende de uma estimativa das perdas técnicas na rede, reduzindo a incerteza no processo.
A metodologia desenvolvida é avaliada usando como caso de estudo uma rede típica de baixa tensão. A sua validade é testada sob diferentes cenários de conhecimento das características da rede de baixa de tensão.
vii
Acknowledgements
First of all, I would like to acknowledge my supervisor, Professor Doctor Helder Leite, for his advice and trust since the first moment.
I would like to express my gratefully to my co-supervisor Dr. Nuno Silva for all of his support and for the opportunity to develop my dissertation at EFACEC.
I also would like to address my special thank to Eng. Eduardo Rodrigues and to Dr. Ismael Miranda. I have no words to express all of my gratitude for their availability and encouragement. Their guidance has been essential for the conclusion of my dissertation.
Finally, I would like to acknowledge all of my friends and family for supporting me in the difficult moments.
ix
Contents
Abstract ... iii
Resumo ... v
Acknowledgements ... vii
Contents ... ix
List of figures ... xi
List of tables ... xiii
Abbreviations and Symbols ... xv
Chapter 1 ... 1
Introduction ... 1
1.1 - Smart Grid Concept: Benefits of an Advanced Metering Infrastructure ... 1
1.2 - NTLs Detection Relevance for Network’s Users ... 3
1.3 - Motivation and Objectives ... 5
1.4 - Structure of the Dissertation ... 6
1.5 - Results Dissemination ... 7
Chapter 2 ... 9
Non-Technical Losses: Literature Review ... 9
2.1 - Definition of Non-Technical Losses ... 9
2.2 - Causes and Origins of Non-Technical Losses ... 10
2.3 - Technical and Economic Impacts of NTLs ... 11
2.4 - Detection and Location of NTLs ... 15
2.5 - Summary ... 19
Chapter 3 ... 21
Modelling of Low Voltage Distribution Networks ... 21
3.1 - Characterization of Low Voltage Networks ... 22
3.2 - Challenges for the Detection and Location of NTLs in LV Networks ... 24
3.3 - Smart Meters and Distribution Transformer Controller ... 25
3.4 - Power flow in Low Voltage Networks ... 27
3.5 - Estimation of Branches Currents in LV Networks ... 30
3.6 - Summary ... 32
x
NTLs Detection and Location in Low Voltage Networks ... 35
4.1 - Methodology Description: Detection of NTLs ... 35
4.2 - Methodology Description: Location of NTLs ... 40
4.3 - Summary ... 46
Chapter 5 ... 47
Case Study: Detection and Location of NTLs in an Overhead LV Network ... 47
5.1 - Case Study: Description ... 47
5.2 - Results Analysis: Detection of NTLs ... 53
5.3 - Results Analysis: Location of NTLs ... 56
5.4 - Summary ... 63
Chapter 6 ... 65
Conclusions and Future Work ... 65
6.1 - Conclusions ... 65
6.2 - Work Contribution and Methodology Limitations ... 66
6.3 - Future Work ... 67
References ... 69
xi
List of figures
Figure 1.1 – Advanced Metering Infrastructure [4]. ... 2
Figure 1.2 - Non-Technical Losses in Europe [6] (TL – Technical Losses). ... 3
Figure 1.3 - Revenue Losses due to NTLs in Netherlands [7]. ... 4
Figure 1.4 – Evolution of the total losses during the last years. ... 4
Figure 1.5 - Monetary Value of the Incentive Mechanism ... 5
Figure 2.1 - Causes of NTLs in electric power systems [6]. ... 11
Figure 2.2 - Incentive Mechanism to Reduce Losses ... 12
Figure 2.3 - A particular type of neural networks – Kohonen networks [23]. ... 15
Figure 2.4 - Hyperplane example [25]. ... 16
Figure 2.5 - Training process used by OPF [26]. ... 16
Figure 2.6 – Communications infrastructure and meter data sources [26] ... 17
Figure 3.1 – Example of a radial network [33]. ... 22
Figure 3.2 – Example of KCL application ... 23
Figure 3.3 – Topology recognition using G3 PLC [41]. ... 25
Figure 3.4 - Smart Meter Example. ... 26
Figure 3.5 - Example of a DTC [45]. ... 27
Figure 3.6 - Complete LV line model [46]. ... 28
Figure 3.7 - Line model after Kron’s reduction [46]. ... 30
Figure 3.8 - Residual currents calculation example [47]. ... 31
Figure 3.9 - Model of a three-phase 4-wire line (adapted from [49]). ... 31
Figure 4.1 - Methodology Flowchart for detection of NTLs ... 36
xii
Figure 4.3 – Representation of the consumer connection to the network (adapted from
[17]). ... 40
Figure 4.4 - Flowchart of the NTLs location. ... 41
Figure 4.5 - Representation of unbalanced loads in networks. ... 42
Figure 4.6 - Network’s levels exemplification. ... 45
Figure 5.1 - Network used as test case. ... 48
Figure 5.2 - Example of 6 six load’s diagrams. ... 49
Figure 5.3 - Production Profile. ... 49
Figure 5.4 – PFE evolution during the day. ... 51
Figure 5.5 – Evolution of the TE during the day. ... 52
Figure 5.6 – Determination of the LE to use in the location of NTLs ... 52
Figure 5.7 - Results of the detection considering the topology available. ... 53
Figure 5.8 – Detection of NTLs – Full absence of network’s knowledge ... 54
Figure 5.9 – Evolution of the accuracy varying the PFE. ... 55
Figure 5.10 – Evolution of the accuracy varying the average PFE ... 55
Figure 5.11 - Results for the location varying the number of locations, N, with NTLs in scenario 1. ... 59
Figure 5.12 - Results for the location varying the number of locations, N, with NTLs in scenario 2. ... 60
Figure 5.13 - Impedance variation comparing with the real value using 10 days of historic records. ... 60
Figure 5.14 - Impedance variation comparing with the real value using a day of historic records. ... 61
Figure 5.15 - Results for the location of NTLs in scenario 3, varying the number of locations, N. ... 61
xiii
List of tables
Table 2.1 - Reference values for the period between 2015 and 2017 ... 12
Table 3.1 - Technical Characteristics of SMs. ... 26
Table 4.1 - Impedance estimation example. ... 43
Table 4.2 - Cases Expected - x: available or present; - unavailable or not present; ... 43
Table 4.3 - Characterization of the different analyses ... 44
Table 5.1 – Microgeneration Data ... 48
Table 5.2 – Cases used to assess the advanced methodology x: available; - unavailable ... 49
Table 5.3 - Simulated NTLs – Example 1. ... 53
Table 5.4 – Simulated NTLs: Location ... 56
Table 5.5 - Calculation of the error EN|K. ... 56
Table 5.6 - Recalculation of the error EN|K. ... 57
Table 5.7 - Simulated NTLs. ... 57
Table 5.8 - NTLs Found. ... 58
Table 5.9 - Calculation of the error for NTL present in busbar 12. ... 58
Table 5.10 - Error after the recalculation of CCB. ... 58
Table A1 – Consumers’ Contracted Powers ... 73
xv
Abbreviations and Symbols
List of abbreviations
AMI Advanced Metering Infrastructure DA Distribution Automation
DER Distributed Energy Resources DRP Demand Response Programs DSO Distribution System Operator DTC Distribution Transformer Controller
HV High Voltage
MDMS Meter Data Management System ERSE Energy Services Regulatory Authority
LV Low Voltage
MV Medium Voltage
NEV Neutral to Earth Voltage NTLs Non-Technical Losses QoE Quality of the Energy QoS Quality of Service
SCADA Supervisory Control and Data Acquisition
SMs Smart Meters
TLs Technical Losses
TS Transmission System
TSO Transmission System Operator List of symbols A Amperes R Resistance X Reactance V Volt Ω Ohm
1
Chapter 1
Introduction
The main objective of this work is to study the problem of Non-Technical Losses (NTLs) in distribution networks, and to advance a methodology that is capable of tackling this problem, particularly in Low Voltage (LV) networks. Therefore, a methodology has been developed consisting of the methodological steps, first, to detect the presence of NTLs and, second, to proceed to their location.
In this first Chapter, the motivation, the objectives and the structure of the dissertation are presented.
1.1 - Smart Grid Concept: Benefits of an Advanced Metering
Infrastructure
The smart grid concept represents the last and the most evolved generation of electric power grids designed so far. It may be defined as an electricity network that is able to integrate the behaviour and actions of all users connected to it. Nevertheless, this integration is performed in a cost efficient manner in order to ensure economically efficient, sustainable power system with reduced losses and high levels of quality and security of supply and safety [1]. This concept is achievable through the transformation of electric power grids using automatic control, the communications infrastructures and other forms of information technologies [2]. Smart Grids have been designed to introduce an intelligent management system in conventional networks, providing an opportunity to tackle some of the present challenges in LV networks. In fact, the smart grid concept will enable the monitoring, in real time, of the operational conditions of LV networks which is not feasible in the majority of the current LV networks. Therefore, the Distribution System Operator (DSO) will have available additional information regarding the network, such as electrical measures as voltages in nodes and the consumers’ load diagrams. This information leverages the development of new tools, as the detection and location of NTLs, which may be used to maximize the efficient and the Quality of Service (QoS) in LV networks in a smart grid environment.
The implementation of smart grids relies on the use of an Advanced Metering Infrastructure (AMI) since this structure allows two-way communications between different
2 Introduction
2
entities present in the grid, namely consumers at one side and the Meter Data Management System (MDMS) on another side, with the onus of collecting data into software application platforms [3]. The information exchanged between these entities is performed through the use of communication networks at different levels of the infrastructure hierarchy as shown in Figure 1.1.
Figure 1.1 – Advanced Metering Infrastructure [4].
These changes enable the integration of consumers in the system’s management, enhancing its operability. With the presence of an AMI, the consumers and the system’s operators will have in real time information about the consumption. Thus it is possible, for example, to implement Demand Response Programs (DRP). In DRP, consumers may reduce or shift their consumption during peak periods. This enables a cooperation, in real time, between the system’s operator and consumers with the main goal of increasing the benefits for both parts. The participation of consumers in DRP may provide a reduction in their energy bill and system’s operator will have an additional resource, for instance to solve congestions issues in the network.
AMI is based on Distribution Automation (DA) which refers to a set of technologies, incorporated in Supervisory Control and Data Acquisition (SCADA) systems and in communication infrastructures [5]. These technologies enable the operation of electrical networks, being capable of monitoring (e.g. voltages and currents) and operating in real time (automatically) remote units, providing a higher flexibility to the system’s operation. The implementation of DA in LV networks may be performed through smart metering, i.e., through the incorporation of individual devices all over the network (at the costumers’ premises) for measuring electrical variables (e.g. voltages) and communicate such measurements. Smart metering will the gateway between the consumers and the centralized management systems.
Smart Grid Concept: Benefits of an Advanced Metering Infrastructure 3
3
AMIs and sensorization systems are already implemented in the majority of Transmission Systems (TS) in Medium Voltage (MV) and High Voltage (HV) distribution networks as the operation of these networks requires the implementation of an intelligent management system, namely SCADA systems. These systems enable the monitoring of high quantities of energy flowing through electrical grids and control its impacts on the assets (e.g. faults).
Nevertheless, when the focus is turned to distribution networks, namely to LV networks, which have always been explored without a centralized management system or without considering DA, the development of smart metering will completely change the paradigm of these networks in the overall system. In fact, smart metering will become the foundation of AMIs in LV networks. The presence of an AMI in LV networks will improve their observability from the point of view of its operational conditions, leading to the development of new features such as State Estimation (SE) and enabling the implementation of the smart grid concept.
1.2 - NTLs Detection Relevance for Network’s Users
The problem of NTLs in this work will be treated as all energy supplied to consumers that is not billed regardless of its causes and origins. Despite being most related to undeveloped countries, this problem is found in the majority of the countries all over the world. Actually, according to [6], each year European utilities have revenue losses around 3700 million euros as seen in Figure 1.2.
Figure 1.2 - Non-Technical Losses in Europe [6] (TL – Technical Losses).
For instance, the DSOs of the Netherlands have estimated a total of 23% of NTLs in their networks comparing with the total losses registered [7]. The respective revenue loss impact in different parts of the chain value is shown in Figure 1.3. Around 47% of the revenue loss (120M€) is related with taxes not charged due to the energy not billed. The profit loss due to the increase of technical losses in distribution networks is around 85M€. Finally, the revenue
4 Introduction
4
loss due to the reduction in the energy sale is about 30 M€ which implies a reduction in the retail margin around 20 M€. These costs are charged to all customers since it is reflected in the price of electricity tariffs.
Figure 1.3 - Revenue Losses due to NTLs in Netherlands [7].
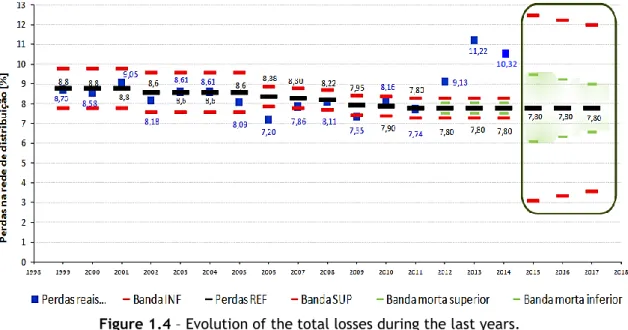
In Portugal, the Energy Services Regulatory Authority (ERSE) is responsible for the regulation of electric sector, with the objective of controlling the activities of the DSO and the Transmission System Operator (TSO). The regulated tariff has a mechanism based on incentives that remunerates the DSO taking into account the losses registered in each year. If losses are lower than a pre-set reference value, the DSO is economically rewarded. Otherwise, the DSO is penalised. The Figure 1.4 represent the evolution of the total losses in distribution networks in Portugal and the reference values defined by the regulator for the period between 2015 and 2018. The evolution of the value of the incentive mechanism during the last years is shown in Figure 1.5.
NTLs Detection Relevance for Network’s Users 5
5
As can be seen in Figure 1.4. the total losses in the period between 2012 and 2014 were higher that the superior band, therefore the DSO had revenue losses around 5M € as shown in Figure 1.5.
Figure 1.5 - Monetary Value of the Incentive Mechanism
Furthermore, NTLs represent additional currents flowing through branches of the entire system and, thus, network’s operators may be driven to invest in the reinforcement of the lines capacity. These additional currents increase the technical losses and the probability of congestions issues deteriorating the reliability and the Quality of Service (QoS) in distribution networks. Additionally, the presence of NTLs increases the quantity of energy that needs to be produced in power plants comparing with the value that would be produced in the absence of NTLs. Once all energy produced is paid, the operational costs of the entire electric system rises, being reflected in the price paid by all consumers. Depending on the value of NTLs and its evolution over time, the need to make investments in new capacity of generation may be increased. This may jeopardize the achievement of the European Energy Strategy for 2030 which requires a reduction of 40% in greenhouse gas emissions and at least 27% in energy savings [8]. Concluding, NTLs represents a transversal problem that implies drawbacks for all the parts of the electrical value chain, from consumers to systems operators.
1.3 - Motivation and Objectives
The NTLs occurs main in LV distribution networks, as a distribution company may have millions of domestic customers [6] and the monitoring of energy losses in these networks has not been accomplished due to the high cost of the installation in equipment such as Current Transformers (CTs) and Voltage Transformers (VTs). Additionally, the on-site inspections by utilities’ teams are time consuming and, therefore, present significant costs. Nevertheless, with the directive publish by the European Union (EU) [9] in order to implement in the majority of the LV networks smart meters provides an opportunity to tackle the absence of monitoring in these networks. In fact, it is expected that until 2020 over than 200 million of SMs will be installed in customers’ premises. These undergoing changes in the paradigm of LV networks allows the development of an AMI.
6 Introduction
6
This work aims to present the advantages of the smart metering/ AMI deployment in LV networks and to detail its intrinsic characteristics that may be used to tackle the problem of NTLs. The assessment of the NTLs problem is also addressed, exposing its drawback for network operators and global society.
In order to address the problem of NTLs a methodology is advanced to systematically detect and locate them. The detection is performed by comparing the currents measured at the secondary substation by the Distribution Transformer Controller (DTC) with the sum of the currents measured by consumers with SMs. The location of NTLs is performed comparing the currents in branches, based on the measured currents consumed and using the Kirchhoff’s Current Laws (KCL), with an estimation of the real currents in branches considering the voltages in nodes provided by SMs. Nonetheless, even in the presence of an AMI, the DSO most of the times does not have all the data that characterize the network (such as the topology and the branches impedances). Therefore, this work addresses some of the technical challenges of the implementation of the detection and location of NTLs in LV networks.
The adequacy of the advanced methodology is tested in a real LV network. The case study used is based on a typical Portuguese LV network where the main features of a smart grid such as microgeneration and SMs are already implemented. Different scenarios, that characterize the majority of expected real situations, have been defined to demonstrate the adaptability and the robustness of the proposed methodology.
1.4 - Structure of the Dissertation
This work is composed by six Chapters. In Chapter 1 is presented a framework of the problem of NTLs, where is expressed the future role of AMI in LV networks and the advantages of the smarting in these networks.
The Chapter 2 presents an overview of the problem, by clearly identifying the causes and origins behind it. It is also exposed the consequences of the problem to network’s users, namely to consumers and the DSOs. Lastly, the strategies developed used to tackle the problem are assessed and a critical analysis is performed.
The following chapter, Chapter 3, addresses a full characterization of LV networks in order to describe in detail the particular characteristics of these networks, as well as the smart metering features that may be used to address the problem of NTLs.
The Chapter 4 presents the developed methodology to detect and locate NTLs in LV networks considering different levels of network’s knowledge. A step by step explanation of the methodology is carried out by presenting in a first instance the process of detection and later the process of location.
In Chapter 5 the different case studies are presented to demonstrate the adequacy of the advanced methodology under different conditions that represent the majorly of real situations. The results are discussed in detail.
Lastly, in Chapter 6, the main conclusions of the developed work are exposed as well as the work contribution, the methodology limitations and future work perspectives.
Results Dissemination 7
7
1.5 - Results Dissemination
In consequence of the developed work during this dissertation, a paper will be submitted (the extended abstract has already been accepted) to the MedPower Conference 2016, Mediterranean Conference on Power Generation, Transmission, Distribution and Energy Conversion sponsored by the Institution of Engineering and Technology (IET). The conference will take place on November 6-9, 2016 in Belgrade, Serbia. The paper title is “Detection and Location of Non-Technical Losses in Low Voltage Distribution Networks” and presents the methodology proposed to detect and locate Non-Technical Losses in LV distribution networks.
9
Chapter 2
Non-Technical Losses: Literature Review
This chapter presents the characterization of Non-Technical Losses (NTLs) in the electric power systems distinguishing the types of losses that may occur, and explaining their causes and origins. It is also included a review of the technical and economic impacts of NTLs. Lastly, a review of the works related with the detection and location of NTLs is performed. A critical analysis is performed by explaining their advantages and disadvantages in tackling the challenge of NTLs.2.1 - Definition of Non-Technical Losses
Electrical power systems which have the main objective of supplying energy to consumers, are constituted by several components, namely lines and transformers. These components in virtue of their intrinsic resistance, consume energy when currents flow through them. This energy of losses is designated as Technical Losses (TLs). This phenomenon occurs mainly due to the Joule effect and is given by:
(2.1)
where R represent the resistance of the component and I is the current that flows through it.
Considering the difference between the total energy produced (Eproduced) and the total consumed energy (Econsumed) that is measured, the total losses (L) and given by Equation 2.2.
(2.2)
Without NTLs, the sum of TLs would be equal to the total losses. NTLs may, therefore, be calculated by the difference between the total losses and the TLs:
(2.3) consumed produced E E L
TLs
L
NTLs
2 I R TLs 10 Non-Technical Losses: Literature Review
10
NTLs may be defined as a portion of the energy of losses, being caused by an extern action to the power system [10]. The NTLs are also referred, in the literature, as commercial losses [11], as they represent energy supplied that is not billed, being, consequently converted into operational costs.
In practice NTLs are difficult to calculate, since the real value of TLs is obtained by estimation. The basic method for the estimation of NTLs is performed by calculating the difference between the energy supplied and the energy measured consumed, subtracted the technical losses [12]. These TLs are obtained using power flow studies considering the measured consumptions. An accurate estimation requires a full knowledge of the network, namely the topology and branches’ impedances. In addition, the losses in the networks are continuously changing due to the variations of consumption. Thus, it is also required that energy meters present the ability of providing the consumer’s load profiles measured at regular periods of the day.
2.2 - Causes and Origins of Non-Technical Losses
NTLs may have several origins and the most referred in the literature is related with the presence of fraudulent consumers, which consume energy without paying for it [13]. This problem is generally observed in Low Voltage (LV) networks where the ability of monitor the consumers’ consumption and estimate the conditions of operation of the network is lower than in other voltage levels. The reason behind this fact is associated with the absence of a structure with the ability of providing, in real time, electrical measurements from different locations of the LV network.
The most common techniques used by fraudulent consumers are [13-17]:
• Tampering energy meters in order to read a lower consumption than the real consumption: this may be performed by the interruption of the rotating disk in electromagnetic energy meters or using radio frequency devices to tamper the electronic energy meters;
• Tapping of low voltage wires: illegal connections to the network, mostly in overhead lines;
• Bypassing energy meters: for example, a three phase meter can be adulterated in order to read the consumption of only one phase;
• Grounding the neutral wire of the consumers’ premises: by disconnecting the neutral wire from the distribution feeder, and grounding the neutral wire of consumer’s load the voltage measured by the energy meter will be zero. Therefore, the energy consumed is not measured.
NTLs may also result from non-detected High Impedance Faults (HIFs) in LV networks, and energy meters’ parametrization errors. HIFs are faults which have currents of similar amplitude of the load currents [18] and, therefore, are non-detected by the conventional overcurrent protections such as fuses. The origins of non-detected HIF are mainly related with insulation cable defects (which typically occur in underground networks), or when a primary conductor comes in contact with a quasi-insulating object such as a tree, structure or equipment [19]. At the opposite side, the energy meters’ parametrization errors may be a
Causes and Origins of Non-Technical Losses 11
11
consequence of manufacturing errors, leading consumption measurements to present a significant difference comparing with the real consumption.
The Figure 2.1 summarizes the causes and origins of NTLs.
Figure 2.1 - Causes of NTLs in electric power systems [6].
2.3 - Technical and Economic Impacts of NTLs
In Portugal, the regulator for electricity ERSE, is responsible for monitoring and controlling the activity of the utilities present in the value chain of the electrical sector. This regulation is expressed through the Tariff Regulation Mechanism. For example, the DSO is required to accomplish some reference patterns, namely in terms of QoS and in what concerns to value of total losses in distribution networks. The DSO is rewarded or penalized according to the of total losses in the network as expressed in the mechanism of incentive to reduce losses in distribution networks.
2.3.1 Mechanism of Incentive to Reduce Losses in Distribution Networks
The current Regulated Tariff in Portugal [20], establishes an incentive mechanism to reduce losses in distribution networks, in order to stimulate the DSO to take investment decisions in projects with the objective of reducing losses. The investment decisions may be applied for instance in the reinforcement of the lines capacity or in the installation of capacitors banks to reduce the reactive energy in lines. The idea behind this mechanism is increasing the efficiency of the networks operation. Thus, the regulator defines for each year the reference value for the losses. Discounting a threshold, the DSO may have an additional profit for its performance, in case the losses are below of that value. Otherwise, the distribution operator is penalized. The losses are calculated by the difference between the energy delivered by the transmission system to the distribution networks and the consumed energy measured at all the customers’ locations present in the network.
12 Non-Technical Losses: Literature Review
12
The incentive mechanism is applied based on the difference between the real value of losses and the reference value of the losses, discounting a threshold. Nevertheless, the mechanism limits the maximum and the minimum value of the energy losses taking into account the following parameters:
Reference value of the losses – Pref Value of the unitary losses – Vp Maximum variation – ΔP
Deadband Variation (ΔZ) in which the losses valorisation is not applied
The Figure 2.2 presents the incentive mechanism for losses reduction in distribution networks.
Figure 2.2 - Incentive Mechanism to Reduce Losses
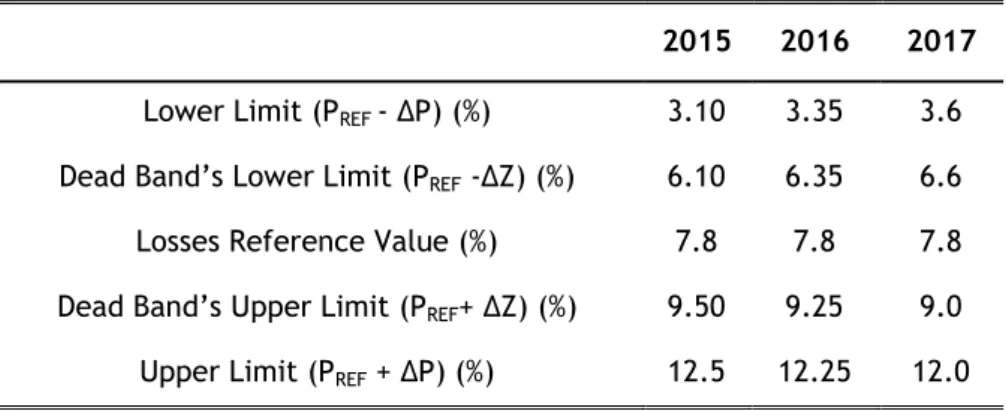
The reference values used for the period between the period of regulation between 2015 and 2017 are presented in the Table 2.1.
Table 2.1 - Reference values for the period between 2015 and 2017 2015 2016 2017 Lower Limit (PREF - ΔP) (%) 3.10 3.35 3.6 Dead Band’s Lower Limit (PREF -ΔZ) (%) 6.10 6.35 6.6 Losses Reference Value (%) 7.8 7.8 7.8 Dead Band’s Upper Limit (PREF+ ΔZ) (%) 9.50 9.25 9.0 Upper Limit (PREF + ΔP) (%) 12.5 12.25 12.0
The incentive mechanism to reduce losses in distribution networks (PPURD, t-2) depends of the losses, Pt-2, according to:
Technical and Economic Impacts of NTLs 13 13 When: Pt-2< PREF,t-2 – ΔZ (2.4) When: Pt-2> PREF,t-2 + ΔZ (2.5)
When: PREF, t-2- ΔZ ≤Pt-2≤ PREF, t-2 + ΔZ
(2.6)
Where:
(2.7)
PPURDj,t-2 is the value of the incentive for reducing losses by level of voltage in year t-2
IRPmax,t-2 is the maximum value of the incentive, in year t-2
IRPmax,t-2 is the maximum value penalization of the mechanism, in year t-2
Vp,t-2 is the losses valorisation value in distribution network in year t-2. This value is
defined in Euros/kWh by ERSE
PREF,t-2 is the losses reference level of the distribution network in year t-2, in percentage
Pt-2 is the level of losses in year t-2, in percentage
ED
t-2 is the total energy delivered in distribution networks in year t-2, in kWh
The reference level of losses (PREF, t-2) is defined for each year of the regulation period as can be seen in Table 2.1. The periods of regulation are generally constituted by 3 years.
2.3.2 Quality of Service
In Portugal the network’s operators are compelled by the regulator to accomplish some reference patterns in what concerns to the QoS and the Quality of the Energy (QoE) present in the regulation for the QoS [21]. For example, the QoE is assessed by monitoring the voltage waveform such as the frequency, amplitude (Root Mean Square (RMS) value), and voltage imbalance (between the 3 phases). The criteria used to assess the quality of the energy in distribution networks is expressed through the norm NP EN 50160:2001.
The norm expresses that the voltage in LV networks (Un =230 V) should accomplish the following patterns:
95% of the time the average RMS value should be within ±10% of Un;
min,t 2 REF,t 2 t 2 tD2 p,t 2
2 t
URD, MaxIRP , P ΔZ P E V
PP 0 PPURD,t2 2 t p, D 2 t 2 t min, 2 t max, IRP (ΔΔ ΔZ) E V IRP
max,t 2 REF,t 2 t 2 tD2 p,t 2
2 tURD, MinIRP , P ΔZ P E V
14 Non-Technical Losses: Literature Review
14
All of the average RMS values measured at each 10 minutes should be within +10% and -15% of Un.
NTLs represent additional currents flowing through branches of the entire system. These additional currents increase the TLs and increase voltage drop in branches. Considering the particular case of non-detected HIF, the fault implies additional currents through the lines, that besides the impact on the location of the fault, influences the voltages in all nodes. Therefore, the QoE is deteriorated since the measured voltages may not accomplish the aforementioned quality patterns.
A further impact of the NTLs is related with the system’s operation. Since NTLs represent additional loads, thus, increasing the power flows in lines of the distribution and transmission systems, the probability of congestions in the networks increases. The congestions occur when the power flow in the elements present in the networks (e.g. lines and transformers) surpass their thermal capacity. Consequently, the presence of NTLs reduces the reliability of systems [13]. The reliability of the systems decreases since the DSO may be impelled to curtail the loads in order to maintain the safety of supply. In addition, despite the operators may have an estimation of the NTLs, their behaviour over time is difficult to forecast. For instance, the current of an HIF depends on the voltages in the network. These currents will be as higher as the voltages in the network. Therefore, the presence of NTLs makes the system’s operation more challenging.
2.3.3 Economic Impacts
Non-Technical Losses represent additional loads for electric power systems and, therefore, their impacts are reflected in the overall system. NTLs increase the energy generated in power plants [7], therefore the need to have backup generation rises in order to maintain the security of supply. As the amount of energy produced in power plants is increased, the price of the energy rises.
The impacts of NTLs for network’s operators are related with the increasing of TLs due to the additional energy that flows through the networks. Due to the presence of NTLs, the DSO may be required by the regulator to invest in the reinforcement of the electric system’s infrastructures in order to accomplish the patterns concerning the losses in the network and the QoS. Nevertheless, the incentive mechanisms are calculated based on the difference between the energy supply and the energy measured consumed, meaning that NTLs influence directly the value of the total losses. Thus, the DSO may have revenue losses due to the incentive mechanisms. In practice, when the presence of NTLs in networks is observed, the most efficient way for the DSO to have revenue with the incentive mechanisms is through investments that enable the reduction of NTLs.
The NTLs represent an increase of the operational costs, by overloading the power plants and the need to the reinforcement of the system’s infrastructures. The increase of the operational costs is charged to costumers through tariffs. Taking into account that NTLs represent energy supplied that is not billed there will be as well revenue losses for the governments due to taxes not charged. The increasing the energy price for the companies that may result from the presence of NTLs reduces their competitiveness as their operational costs increase. This may be particularly relevant for energy intensive industries. Moreover,
Technical and Economic Impacts of NTLs 15
15
higher electricity tariffs reduce the economic power of consumers which in turn may affect the economy of the country.
2.4 - Detection and Location of NTLs
The detection and the location of NTLs can be performed using several methods that can be divided in two categories: Artificial Intelligence Methods (AIM), which have been the most widely investigated, are based on customers’ load profiles analysis and pattern recognition using data mining techniques; the second approach, Smart Metering Based Method, takes advantage of the existing Smart Meters in LV networks to perform the detection and location of NTLs.
The different methods may be evaluated and compared considering several characteristics:
The quantitate and the type of costumers’ data required; The computational effort;
The type of networks in which they are used and the modelling of the network required;
The impact on consumers; The type of NTLs identified;
2.4.1 AIM Methods
This category of methods extract relevant features from the data of the consumers such as the load profile and the ratio between the average load and the maximum load of the consumer [22]. Based on these features, these methods implement a training algorithm that provides the ability to classify consumers’ behaviour.
For example, in [23] is presented a scheme based on Artificial Neural Networks (ANNs), which is used when the exact relationship between the inputs and the outputs is unknown. Specifically, this scheme uses Kohonen networks (see Figure 2.3) that allows the design of an objective way of clustering data.
16 Non-Technical Losses: Literature Review
16
The selection of fraudulent consumers is performed by searching the similarities between the consumption pattern of the records and the consumption patterns of the customers’ database.
In [24] the author proposes a 4 class Support Vector Machines (SVM) to learn the behaviour of the electric demand considering four different load profiles. This process of training is performed in order to obtain a Quadratic Programing (QP) problem resulting in the definition of a hyperplane that divides the feature space in two or more labelled classes [25]. Considering a set of values that have similar characteristics, they will be included in a region of the space delimited by a hyperplane, being therefore defined as a specific labelled class. The Figure 2.4 shows a hyperplane that divides the featured space into 2 labelled classes.
Figure 2.4 - Hyperplane example [25].
Finally, the approach based in an Optimum-Path Forest [22], which uses the graphs theory, has been developed to tackle the problem of slow convergence evidenced by other methods as the SVM approach. The training process is carried out by constructing a complete graph, as represented in Figure 2.5, whose nodes are the samples and the arcs link all nodes [26]. A weighted function is after applied to arcs depending on the distances between the feature vectors of their corresponding nodes. Each class will be created by those nodes, which have arcs with low weights, meaning with similar characteristics.
Detection and Location of NTLs 17
17
The last step of these methods consists of the process of detection that is performed by comparing the present consumers’ loads profiles with the database’s profiles used during the process of training, assuming that NTLs are highly correlated with abnormal consumption behaviours.
This class of methods has the main advantage of being applicable in networks with conventional energy meters and/or smart meters. Additionally, these AIM methods only use the information of each specific consumer, being therefore independent of the LV network. However, their ability to detect NTLs may be limited as the historic data may be already affected by the presence of NTLs. In addition, they only are able to detect a part of the causes behind NTLs, related with the presence of fraudulent consumers. As the network is not considered they are not capable of detecting other NTLs such as HIF. A further limitation of these methods results from the need to take into account a large number of consumers which need to be verified individually, leading to a significant computational effort and a slow convergence. These methods are not able to pre-select different suspect locations of the network.
2.4.2 Smart Metering Based Methods
The second category of methods have been developed for detecting and locating NTLs under the presence of an AMI in LV networks. The work in [27] proposes a State Estimation (SE) of the Medium Voltage (MV) network to detect the presence of NTLs or inconsistent data measurements at the secondary side of the distribution transformers. The SE is performed using electrical measures provided by SMs present in each LV network, such as voltages and the power consumption, and the voltage (magnitude and angle) at the MV substation. Figure 2.6 shows the data required by this methodology and the communications infrastructure used.
18 Non-Technical Losses: Literature Review
18
The identification of the LV networks under the presence of NTLs is performed by analysing the difference between the aggregated consumption provided by the SE at each secondary substation with the sum of the SMs’ measured consumptions. By contrast, in [16, 17, 28] the advanced methodologies compare the total consumption registered by the clients’ meters with the energy supplied through the secondary substation. With the difference of the TLs, the total consumption must match the energy supplied. Whenever this balance does not occur, it is considered the presence of NTLs in the network. These approaches require a full model of the networks to calculate the TLs in the network. In case the technical characteristics of the network, such as the topology and the branches’ physical are unknown, the calculation of the TLs is a factor of uncertainty as TLs can only be estimated. The computational effort required may be high in the first approach. The SE is performed through an iterative process that requires the availability of electrical measures from different locations of the network and a full knowledge of the network.
In spite of the location in [27] being carried out based on pattern recognition by implementing the Analysis of Variance (ANOVA) method, in [16] the location of NTLs is identified by the feeders’ division into a certain number of segments, where Current Transformers (CTs) are installed. The control centre sends a load shedding command to all SMs and, in case of the presence of NTLs, the CTs will detect them, since there will be current flowing in the branches due to their presence. In order to locate NTLs, this approach requires the interruption of the electricity supply, as well as the investment in the deployment of several sensors. This method is not capable of locating NTLs due to tampered or parametrization errors in the energy meters. Nevertheless, the location can be performed without the knowledge of the network features (e.g. topology). At the opposite side, the work in [28] uses the currents measured by consumers’ SMs to calculate the Estimated Voltage Drop (EVD) between the distribution transformer and each costumer. The same process is performed using the voltage measured by SMs (Real Voltage Drop (RVD)). Calculating the difference between the RVD and the EVD, the result will be the voltage drop due to the presence of NTLs. Therefore, the current due to NTLs is obtained dividing by the respective impedance between the distribution transformer and each consumer. The location where the current estimated is high is probably under the presence of NTLs. The accuracy of this approach is quite variable with the number of NTLs and its value since the presence of NTLs affect the voltages in the overall system. This method requires a full network’s knowledge. Nevertheless, has the main advantage of being able to identify the different types of NTLs detailed in section 2.2. In addition, the location of NTLs is performed without interrupting the consumers’ loads.
Finally, considering a smart grid environment, where the widespread implementation of Demand Response Programs (DRP) is expected to become a reality, the work in [29] advances a technique to locate NTLs based on the use of a performance evaluation method, customer baseline load calculation. This evaluation method is generally used to assess the consumer´s performance after the participation in a DRP. This approach allows the determination of the expected consumption in each period of the consumer historic data. The proposed methodology firstly proceeds to the calculation of the best base-line function (parameters), which better represents the consumption behaviour over the different periods in study. After, some statistical indices, as the Whole Data Average (WDAVG) and Whole Standard Data Deviation (WDSTD), are introduced to evaluate the difference between the actual measured values and the estimated values. Considering that the above-mentioned indices have a higher
Detection and Location of NTLs 19
19
value to the actual consumption than the estimated consumption the consumer is considered suspect. This approach has the main disadvantage of being influenced by variations in the consumption that are not related with NTLs. It is also not applicable during the demand response programs. The modelling of the network is not performed in this approach, thus, the detection of NTLs is restricted to the presence of fraudulent consumers. In addition, the amount of data required and the computational effort may be high. A further limitation is related with the need to inspect all of the consumers present in the network.
2.5 - Summary
In electric power system the presence of TLs represents a natural occurring phenomenon due to their intrinsic physical characteristics. Nonetheless, there may be present an another type of losses, NTLs, which are due to externals actions to the system. The main causes of these additional losses are related with the presence of fraudulent consumers in the networks, which consume energy that is not billed. Nevertheless, beyond the causes related with fraudulent consumers, NTLs may result from non-detected HIFs and energy meters’ parametrization errors. These losses increase the system’s operation costs, which are reflected in the price paid by customers through higher tariffs and reduces the revenue of the network’s operators that could result from incentive mechanisms.
The detection and location of NTLs represent an effective way to reduce the system’s operation costs. Thus, some methodologies have been developed to tackle this challenge. The AIM methods, based on the consumer’s pattern recognition, uses the information provided by energy meters to identify abnormal consumption behaviours. The applicability of these methods is directed to networks in which there is a full absence of information about the network’s characteristics, thus, the only information available is provided by the energy meters. The smart metering methods, take advantage of the presence of an AMI in the networks to perform the detection and location of NTLs in LV networks. The challenges under the detection and location of NTLs, due to their diversity, require an integrated analysis, i.e., a combination of the information available from customers, provided by SMs, and their interaction with the network. By considering simultaneously this two entities, there is a great potential to fully address the problem of NTLs, since all the types of NTLs will be achievable to be detected and located. In addition, an approach that is capable to leverage the functionalities of the smart metering, reducing the uncertainty in the overall process, reduces the need of on-site inspections and reduces the area under inspection. Moreover, an approach that is capable of handling the lack of a full network knowledge increases the applicability of the detection and location of NTLs to the generality of the LV networks.
21
Chapter 3
Modelling of Low Voltage Distribution
Networks
The majority of the consumers are connected to Low Voltage (LV) networks. Nevertheless, these networks have always been explored in a passive way when compared with other voltage levels. In fact, in LV networks most of the times the Distribution System Operator (DSO), does not have information regarding their operation conditions. This may be justified by the large number of LV networks that may be operated by the DSO which would require a massive investment in the deployment of measurement sensors and communication infrastructures. On the contrary, in other networks such as Medium Voltage (MV) and High Voltage (HV) networks, their monitoring is required in order to ensure a safety supply of the energy and control the impacts of external actions to the systems (e.g. faults) in the assets. Consequently, the DSO redirects its investments to MV and HV networks. The presence of Non-Technical Losses (NTLs) mainly concerns LV networks due to the inexistence of monitoring in these works. Nevertheless, the integration of smart metering in LV networks provides an opportunity to explore and to monitor these networks in an active way since there will be information regarding the electrical variables (e.g. voltages in nodes) from different locations.
The definition and technical description of the modelling approach for LV networks is essential to understand and address the challenge of detecting and locating NTLs. Thus, a detailed literature review of the different configurations, underground and overhead networks, used in LV networks is included. The assumptions that may be used in each configuration to tackle the problem of NTLs are also explained. Additionally, a characterization of the technical functionalities of the smart metering is addressed, explaining the role of the smart meters and the Distribution Transformer Controller (DTC) in the process of detecting and locating NTLs in LV networks.
22 Modelling of Low Voltage Distribution Networks
22
3.1 - Characterization of Low Voltage Networks
3.1.1 – Particularities of Low Voltages Networks
LV networks ensure the delivery of energy from the secondary substations to the consumers’ locations. Despite the majority of the consumers being present in these networks, comparing with other voltage levels, the available information about the technical characteristics of LV networks is scarce. In fact, the DSOs often do not have all the data that characterizes LV networks such as the topology and the physical parameters of lines/cables. One reason behind the inexistence of information is due to the fact that the planning of LV networks is substantially different from the planning at other voltage levels, namely in Transmission Systems (TS) [30]. Additionally, the extension and electric demand of LV networks are continuously being changed due to the connection of new customers. These new connections are typically performed by the utilities technicians without a previous study of the network’s operation conditions such as the load imbalance. As consequence, the new single phase customers are randomly connected to the phases. Furthermore, the infrastructure of LV networks may present several decades of lifetime, and, therefore, the absence of digital databases and information systems makes difficult the storage of information [30].
3.1.2 Technical Aspects of Low Voltage Networks
In Portugal, LV networks may be divided in two main categories: the first one, underground networks, which is manly used in urban areas with a large number of habitants (typically>15000), uses underground cables to supply energy to consumers [31]. The second category, overhead networks, is mostly used in rural areas, where overhead lines are most commonly deployed. Overhead networks, due to the slower load densities allows a less expensive cost than underground networks [32].
LV networks typically have a radial configuration, i.e., an arborescent configuration, meaning that each consumer only has one electrical path to be supplied. The Figure 3.1 presents an example of a radial network.
Characterization of Low Voltage Networks 23
23
The application of the Kirchhoff Currents Laws (KCLs), which demonstrates that the algebraic sum of all currents entering and exiting a node must equal zero [34], allows the direct calculation of the currents in branches. Therefore, this means that the currents in the upstream branches will be the sum of all currents consumed in the downstream busbars.
The application of the KCLs to the simplified network schematic represented in Figure 3.2 is given by the Equation (3.1) and Equation (3.2).
Figure 3.2 – Example of KCL application
(3.1)
(3.2)
Where I2 is the current in line 2, I1 is the current in line 1, ILOAD2 is the current consumed in the end of line 2 and ILOAD1 is the current consumed in the end of line 1.
LV networks are typically constituted by 4-wire cables/lines corresponding to a 3-phase system plus neutral wire. This allows the connection of single-phase loads and 3-phase loads simultaneously in the same network. Due to this characteristic, LV networks may be quite unbalanced which may imply high currents flowing through the neutral wire and a high Neutral to Earth Voltage (NEV) in nodes. Nodes represent the connection between the busbar and the phase wire. The NEV depends of the neutral configuration, namely the number of locations where it is grounded. The Safety Regulation for Low Voltage Distribution Networks (RSRDEEBT) [35] establishes the configuration of neutral wire in LV networks.
3.1.2.1 Safety Regulation for Low Voltage Networks
According to the RSRDEEBT, the neutral wire should be grounded in the following locations:
At the distribution transformer (star connection at the secondary side); At every 300 m of line/cable length;
In singular points of the network, namely derivations from the primary canalization or locations with a high concentrate of loads;
In addition, the equivalent impedance of the neutral wire of the network should be lower than 10 Ω. LOAD2 2 I I 2 LOAD1 1 I I I
24 Modelling of Low Voltage Distribution Networks
24
The practical application of this regulation has some differences depending of the type of network. In underground networks, due to the high number of clients and, therefore, a high number of ramifications from the phase wires, the neutral wire is grounded in the majority of the consumers’ electrical installation. At the opposite side, in overhead lines, the distribution of the consumers alongside the network is sparser and, therefore, the number of locations where the neutral is grounded is lower than in underground networks. These differences influence the currents that flows through the neutral wire and its voltage throughout the LV network.
3.2 - Challenges for the Detection and Location of NTLs in LV
Networks
In HV and MV distribution networks, where the widespread of DA is verified, the monitoring of these networks may be performed. In fact, beyond the availability of electrical measures from different locations, the characteristics of the network, such as the topology and the branches’ impedances are also known. The combination of the electrical measures with the network’s data allows the implementation of State Estimation (SE) and power flow algorithms. SE provides a comprehensive and reliable view of the state of the networks in quasi-real time using the available measurements (e.g. voltages) [36]. At the opposite side, in LV networks, even if the networks characteristics are known, the absence of electrical measures from different locations does not allow the implementation of SE in these networks. Additionally, in LV networks the modelling of complex multi-phase asymmetric distribution, where the representation of the neutral wire is required, represent a challenge for developing an efficient and robust SE algorithm [37]. Consequently, the detection and location of NTLs in LV networks is difficult due to the inability of monitoring these networks.
The deployment of decentralized management systems through smart metering in LV networks, leverages the availability of electrical measures from different locations, such as the load’s diagrams of consumers. Thus, the use of power flow studies to assess the operation conditions of the networks may be performed a posteriori if the technical characteristics of the network are known. In fact, power flows with the ability of a fully LV network modelling, providing the voltages and the currents in the neutral wire may be found in literature [38, 39]. Therefore, the inexistence of information regarding the characteristics of LV networks is the main challenge for the implementation of NTLs detection and location in these networks. In order to tackle the problem of the lack of network’s knowledge, some advanced functionalities have been developed, leveraging the presence of smart metering in these networks. One of these functionalities, which may play an important role in the recognition of the LV characteristics, is the automatic feeder mapping / phase identification of loads [40]. This may be performed through the use of Power Line Communications (PLC) in LV networks. In G3 PLC protocol, it consists in choosing the optimal relay nodes (meter or Data Concentrator (DC)) to propagate data packets addressed to a specific destination node [41]. The representation of the network topology may be performed since the information sent can be retrieved from every node of the network as shown in Figure 3.3.
Challenges for the Detection and Location of NTLs in LV Networks 25
25
Figure 3.3 – Topology recognition using G3 PLC [41].
The integration of Distributed Energy Resources (DER) in LV networks poses many challenges for the detection and location of NTLs. DER introduces bidirectional power flows and causes disturbances in the voltages profiles throughout the network [42]. In fact, with DER the voltages in busbars may rise and lead to violations of the operational limits. An additional problem caused by the integration of DER is related with the load balancing between phases [43]. The unbalanced phase loading may lead to an increase in the neutral current and an increase of voltage unbalance, even in the case that the total phase current decreases. Under such conditions, the uncertainty regarding the presence of NTLs in LV networks may augment since the patterns of consumption and the behaviour of the electrical variables are directly influenced by the energy produced by DER.
3.3 - Smart Meters and Distribution Transformer Controller
Smart metering systems represent the next-generation of power measurement devices, that have several advanced features [44]. These advanced features comprise sophisticated measurement data and communication capabilities. A combination of the communication capabilities with the integration of advanced computing enables the enhancement of the networks’ reliability. In fact, the transition to networks where an AMI is implemented brings great benefits to the operation of LV networks. The DSO and customers may have information regarding the energy consumed measured at regular periods (e.g. hourly or 15 minutes’ periods. Thus, an improved management of the energy can be performed, increasing the systems’ efficiency and reducing the operational costs. Nevertheless, the SMs provide other electrical measures beyond the energy consumption, namely the voltage at the consumer’s energy point of delivery. On the contrary of the use of conventional energy meters which only have been designed for energy billing purposes, the SMs allow a real monitoring of the LV networks. The observability of the LV networks becomes possible which otherwise would26 Modelling of Low Voltage Distribution Networks
26
require a massive investment in measurement equipment such as CTs, Voltage Transformers (VTs) to perform the monitoring of these networks.
The Figure 3.4 presents an example of a single and three-phase smart meter.
Figure 3.4 - Smart Meter Example.
The Table 3.1 shows the general features of the SMs present in the market. Table 3.1 - Technical Characteristics of SMs.
General Features Single Phase SMs Poly Phase SMs Voltage 220(-20%) – 230(+15%) 3x230 V/400 V (±20%) Active Energy Class 1 or 2 per EN IEC 62053-21
Reactive Energy Class 2 or 3 per EN IEC 62053-23, 4 quadrants Instantaneous Values Current, Voltage, Power, Power Factor, Frequency
Communications PLC/ GPRS
As can be seen in Table 3.1, SMs have the ability of providing instantaneous electrical measures. Generally, these measures are obtained at regular periods of fifteen minutes and are sent once a day to a database that can be managed by the DTC. In practice, the DSO will have access to a several snapshots of the system’s electrical variables taken during the day.
The type of communications used may provide additional information about the consumers. For example, when the SMs use Power Line Communications (PLC) the phase to which the consumer is connected is available [41]. When General Packet Radio Service (GPRS) communications are used only the GPS coordinate of each consumer is available.
The DTC installed at the secondary substation interacts with SMs providing meter data management as well as electrical measures of each phase. The DTC will be the gateway between the SMs and the central system such as LV SCADA Systems present in high levels of the Advanced Metering Infrastructure (AMI) hierarchy. In the Figure 3.5 is shown a DTC equipment.
Smart Meters and Distribution Transformer Controller 27
27
Figure 3.5 - Example of a DTC [45].
The DTC may also provide several electrical measures such as:
Metering (3-phase active and reactive energy) for the LV side of the Distribution Transformer
Voltage Current
Power (3-phase active and reactive) Power Factor
3.4 - Power flow in Low Voltage Networks
The use of power flow studies is required in order to simulate the real networks’ behaviour, since the information provided by SMs may be used to evaluate the operation conditions of the networks. Therefore, depending on the type of networks, namely the neutral configuration, the adopted power flow method may have different characteristics.
Most of the traditional power flow approaches merge the neutral wire into the phases using the Kron’s reduction [38]. Such approximation may not be desirable when neutral wire and grounding effects need to be assessed [38, 39]. Thus, when the knowledge of NEV in nodes is required a complete model of the network should be used. Otherwise, the power flows studies may be performed by the Kron’s reduction.
The power flows simulations using a complete model of the network require a full knowledge of the locations where the neutral is grounded and both impedances of phases and neutral wires. Figure 3.6 shows the line model when the neutral is considered explicitly modelled and considering the earth as a perfect conductor.
![Figure 1.1 – Advanced Metering Infrastructure [4].](https://thumb-eu.123doks.com/thumbv2/123dok_br/15689790.1065206/18.892.179.669.242.633/figure-advanced-metering-infrastructure.webp)
![Figure 1.2 - Non-Technical Losses in Europe [6] (TL – Technical Losses).](https://thumb-eu.123doks.com/thumbv2/123dok_br/15689790.1065206/19.892.214.721.631.980/figure-non-technical-losses-europe-tl-technical-losses.webp)

![Figure 2.1 - Causes of NTLs in electric power systems [6].](https://thumb-eu.123doks.com/thumbv2/123dok_br/15689790.1065206/27.892.174.756.203.503/figure-causes-ntls-electric-power-systems.webp)
![Figure 2.3 - A particular type of neural networks – Kohonen networks [23].](https://thumb-eu.123doks.com/thumbv2/123dok_br/15689790.1065206/31.892.253.679.839.1065/figure-a-particular-type-neural-networks-kohonen-networks.webp)
![Figure 2.6 – Communications infrastructure and meter data sources [26]](https://thumb-eu.123doks.com/thumbv2/123dok_br/15689790.1065206/33.892.153.779.720.1060/figure-communications-infrastructure-meter-data-sources.webp)
![Figure 3.1 – Example of a radial network [33].](https://thumb-eu.123doks.com/thumbv2/123dok_br/15689790.1065206/38.892.268.600.796.1106/figure-example-radial-network.webp)
![Figure 3.3 – Topology recognition using G3 PLC [41].](https://thumb-eu.123doks.com/thumbv2/123dok_br/15689790.1065206/41.892.317.633.110.467/figure-topology-recognition-using-g-plc.webp)
