Predicting the effects of climatic change on mediterranean riparian vegetation using a dynamic vegetation model
31
0
0
Texto
(2) Abstract: The present Master's thesis had as its main objective the application of a dynamic model of riparian habitats in a case study with pronounced Mediterranean characteristics. The vegetation model used is based on the existence of water conditions (water height and distance to water) suitable for the development of each type of riparian vegetation in different stages of their development, modeling annually its space-time evolution. The rules underlying the model take into account the height of the flow, the shear stress and duration of flooding. The modeling of vegetation held in ArcGIS environment, bases on three general phases: initial creation of the landscape, which recreates the starting point for the simulation of vegetation dynamics, simulation of temporal and spatial evolution of vegetation, with consequent corresponding output; and the presentation of annual results. In Portugal, the model was applied to a case study, aiming to predict the temporal and spatial evolution of the vegetation patches by altering the hydrologic regime resulting from the action of climate change. From the modeling performed resulted the spatial-temporal evolution of the river vegetation patches, for the time period mentioned.. Key words: Modeling, riparian vegetation, hydric regime, climatic change.
(3) Resumo: A Tese de Mestrado que se apresenta, teve como objectivo principal a aplicação de um modelo dinâmico de habitats de vegetação ripária num caso de estudo com características mediterrânicas vincadas. O modelo de vegetação utilizado baseia-se na existência de condições hídricas (altura de escoamento e distância à água) adequadas para o desenvolvimento de cada tipo de vegetação ripícola nas diferentes fases do seu desenvolvimento, modelando anualmente a sua evolução espacio-temporal. As regras subjacentes ao modelo têm em consideração a altura do escoamento, a força de arrastamento e duração da inundação. A modelação da vegetação, realizada em ambiente ArcGis, assenta em três fases gerais: criação da paisagem inicial, que recria o ponto de partida para a simulação da dinâmica vegetacional; simulação da evolução temporal e espacial da vegetação, com consequente output correspondente; apresentação dos resultados anuais. Em Portugal, o modelo foi aplicado a um caso de estudo, tendo como objectivo prever a evolução temporal e espacial dos núcleos habitacionais de vegetação pela alteração do regime hidrológico resultante da acção das alterações climáticas. Da modelação realizada resultou a evolução espacio-temporal do curso fluvial relativa aos núcleos homogéneos de vegetação, para o período de tempo referido.. Palavras chave: Modelação, vegetação riparia, regime hidrológico, alterações climáticas.
(4) Resumo alargado A vegetação ripária constitui um sistema de transição semiterrestre influenciado regularmente por água doce. Este sistema funciona como interface entre as massas de água. dulçaquícolas. e. os. ecossistemas. terrestres,. apresentando. uma. elevada. biodiversidade, na medida em que fornece refúgio, habitat e alimentação para a fauna, funcionando como corredor ecológico, ao mesmo tempo que protege o solo contra a erosão, inactiva e retém nutrientes de origem agrícola, e se apresenta como bioindicador de alterações climáticas. Os objectivos ambientais definidos na Directiva-Quadro da Água (DQA) tentam assegurar uma protecção a longo prazo e um uso sustentável dos recursos hídricos, prevenindo a sua maior degradação. Esta Directiva impõe que cada Estado Membro tome medidas de forma a manter ou recuperar o bom estado ecológico das suas massas de água até 2015. A Tese de Mestrado que se apresenta, inseriu-se num projecto ERA-NET IWRM (European Research Area-NET, Regional or National research programmes network on Integrated Water Resource Management) denominado “RIPFLOW - Riparian vegetation modelling for the assessment of environmental flow regimes and climate change impacts within the WFD”, contando com parceiros em Espanha e Áustria, e teve como objectivo principal a aplicação de um modelo dinâmico de habitats de vegetação ripária num caso de estudo com características mediterrânicas vincadas. O modelo de vegetação utilizado baseia-se na existência de condições hídricas (altura de escoamento e distância à água) adequadas para o desenvolvimento de cada tipo de vegetação ripícola nas diferentes fases do seu desenvolvimento. A posição no corredor fluvial determina o acesso à água em função do regime hídrico, sendo tal posição definidora de um habitat de condições homogéneas onde a vegetação poderá estabelecer-se, permanecer ou ser substituída por outra fase de vegetação. As regras subjacentes ao modelo numérico têm em consideração a altura do escoamento, a força de arrastamento e duração da inundação. A altura do escoamento apresenta particular influência na regeneração e disseminação das espécies, enquanto a força de arrastamento determina a manutenção ou arrastamento da vegetação existente, com consequente evolução ou retrocesso à fase inicial. A duração da inundação pode vir a causar stress fisiológico no sistema radicular dos indivíduos, levando ao retrocesso total ou parcial da vegetação. Caso estas pressões não se façam sentir, a vegetação evolui para uma fase de maior complexidade. Por outro lado, havendo pressões significativas, há lugar a um retrocesso para a fase inicial..
(5) A modelação da vegetação, realizada em ambiente ArcGis, assenta em três fases gerais: criação da paisagem inicial, que recria o ponto de partida para a simulação da dinâmica vegetacional; simulação da evolução temporal e espacial da vegetação, com consequente output correspondente; apresentação dos resultados anuais. O modelo é considerado dinâmico na medida em que é possível alterar, à escala anual, a totalidade dos parâmetros utilizados na modelação, nomeadamente, topografia, altura ao escoamento, forças de arrastamento decorrentes da cheia máxima anual e respectiva duração. A modelação utiliza como input para o ano seguinte o output do ano anterior, considerando assim a dinâmica anterior dos núcleos de vegetação, bem como alterações de natureza física do local de estudo. Em Portugal, o modelo foi aplicado a um caso de estudo, tendo como objectivo prever a evolução temporal e espacial dos núcleos habitacionais de vegetação pela alteração do regime hidrológico resultante da acção das alterações climáticas. O local de estudo localiza-se na ribeira de Odelouca (Algarve), um sistema lótico com um carácter marcadamente mediterrânico, de escoamento torrencial no Inverno e secando, ou quase, nos meses de estio. Foram mapeados os núcleos de vegetação homogénea num troço de aproximadamente 390m, com recurso a GPS TrimbleXT, de precisão submétrica, com o objectivo de calibrar o ponto de partida da paisagem inicial. O levantamento topográfico forneceu a localização planimétrica e altimétrica dos vários habitats, assim como o perfil do corredor na situação inicial. Foi simulado um período de 10 anos, considerando os caudais com períodos de retorno de 1,5, 3, 5, 10, 50 e 100 anos. Para estes períodos de retorno, foi simulada a variação espacial dos diferentes tipos e fases de desenvolvimento da vegetação ripícola. Os dados hidrodinâmicos foram obtidos a partir dos modelos HEC-RAS e River2D. Da modelação realizada resultou a evolução espacio-temporal do curso fluvial relativa aos núcleos homogéneos de vegetação, para o período de tempo referido. Embora o caso de estudo exposto represente um regime hidrológico mediterrânico, o modelo apresenta a potencialidade de utilização para quaisquer outras regiões, uma vez que os seus inputs incluem os dados hidrológicos e a vegetação local..
(6) A Tese de Mestrado que se apresenta encontra-se no formato de artigo científico, submetida para publicação na revista internacional “River Research and Applications” dedicada à promoção da investigação científica aplicada a cursos de água..
(7) Index:. INTRODUCTION: ......................................................................................................... 1 METHODS: .................................................................................................................. 3 Study site selection ................................................................................................... 3 Field data .................................................................................................................. 4 Data analysis............................................................................................................. 6 Hydrological data ...................................................................................................... 7 Climate change scenarios ......................................................................................... 7 Vegetation modeling.................................................................................................. 8 RESULTS: .................................................................................................................. 10 DISCUSSION: ............................................................................................................ 16 ACKNOWLEDGMENTS ............................................................................................. 18 REFERENCES ........................................................................................................... 19. Figure index: Figure 1. Study site location at Odelouca river basin and assessment area. ................. 4 Figure 2. Succession phase water height and age differentiation (vowels represent significantly different groups). ..................................................................................... 12 Figure 3. Difference between succession phases area observed and expected in vegetation model. ....................................................................................................... 13 Figure 4. Expected vegetation succession phases spatial response to different hydrologic climate change scenarios. ......................................................................... 14 Figure 5. Expected patch area ratio for different hydrologic climate change scenarios. ................................................................................................................................... 15. Table index: Table 1. Succession phases description in study site. Mean ±Std. Dev. for quantitative characteristics. ............................................................................................................ 10.
(8) INTRODUCTION: Since the beginning of the twentieth century, average global atmosphere temperature has been raising both in amount as in velocity (IPCC, 2001b). For the next century global temperatures are expected to rise significantly, even if the greenhouse gases concentrations remain constant at year 2000 levels, inducing in this period changes in the global climate system that much probably will be in greater magnitude than those observed during the last century (IPCC, 2007). For Mediterranean regions, most Global and Regional Circulation Models simulating the earth climate system foresee an increase in mean annual temperature and a decrease in mean annual rainfall, with concentration of precipitation in a small period of few months in the year and extended and harsher droughts (IPCC, 2001b). The alteration of the hydrological regimes may be as deleterious to ecosystems as temperature changes (Schröter, et al., 2005), and particularly to river systems (Palmer, et al., 2009). The principal attributes of Mediterranean-type climate is seasonality and variability in rainfall, with seasonal flooding that clearly distinguish this climate from the mesic or xeric temperature ones (Gasith & Resh, 1999). Inter-annual variability, is represented by frequencies of floods and variations in annual rainfall while intra-annual variability (seasonality) is represented by water surplus periods interspersed with hydric scarcity. Even the most tenuous climatic changes can result in very important alterations in river flow regime, like changes in recurrence frequencies of extreme floods (Knox & Kundzewicz, 1997, Sánchez, et al., 2004). Changes of the natural flow regimes due to climate changes are also expected to be magnified by the human efforts to mitigate the later such as water retention in reservoirs, (IPCC, 2001a, Malmqvist & Rundle, 2002, Arthinghton, et al., 2006, Araújo, et al., 2006, Boix, et al., 2010). Nonetheless, European member states are asked to actively improve the resilience of ecosystems to climate changes (CEC, 2009, Biesbroek, et al., 2010) with proactive conservation efforts centered in the maintenance of ecosystem functioning and climate mitigation (Palmer, et al., 2008; Woodward, et al., 2010). Riparian vegetation is a characteristic component of river systems, ensuring a liaison between the river channel and the terrestrial ecosystems (Naiman & Décamps, 1997). The structure of this ecotonal zone and its lateral and vertical hydric connections is strongly related to the flow regime, the most relevant factor shaping these plant communities (Hughes, 1997, Poff, et al., 1997, Richter, et al., 1997, Ward, 1998, Walker, et al., 2006). The linkage between fluvial geomorphic processes and riparian 1.
(9) vegetation dynamics creates a topographic diversity, soil moisture gradients and fluvial disturbance patches that characterize riparian ecosystems (Piégay & Salvador, 1997; Merritt, et al., 2010) transforming those patch features into valuable tools to assess the ecological integrity of river functioning. Climate-driven alterations of the hydrologic regimes may thus have profound effects in riparian vegetation, yet few studies have addressed the magnitude of changes in rivers from semi-arid regions (but see Wilcox, et al., 2003 and Stromberg, et al., 2010). Different types of models have been created to better comprehend and predict riparian plants reactions to flow regimes (e.g. Franz & Bazzaz, 1977; Toner & Keddy, 1997; Hill, et al., 1998; Mahoney & Rood, 1998;Benjankar, 2009; Shoutis, et al., 2010; Shafroth, et al., 2010; Ye, et al., 2010). Merritt, et al., 2010 have reviewed dozens of predictive models, which could be very effective for specific river reaches or segments but cannot be applied to other rivers or regions due to its specificity. This Dynamic floodplain vegetation model is based on the relationship between ecologically relevant elements such as magnitude, frequency, rate of change, interannual variability and sequencing of flows (Poff, et al., 1997) and riparian vegetation metrics which clearly reflect its responses to chronic hydrologic alteration, such as age distribution, composition and cover (Merritt, et al., 2010). At the same time it incorporates the historical patch dynamics in every simulation. This model is particularly interesting because, unlikely to the previous models, it works at the response guild level (as each succession phase is characterized by different indicator, co-dominant and companion species and different physical attributes), enabling scientist and managers to talk in general but practical terms about the probable changes in vegetation attributes, allowing regional calibration, possible to be used such on individual streams as in catchments (Merritt, et al., 2010). This approach allows a much wider understanding in the prediction of riparian vegetation responses to actual and future issue concerning to this matter. In this study, we tested the ability of a dynamic vegetation model to predict the riparian succession phases of a typical Mediterranean river and how they change under different flow regimes. Specifically, we aimed to predict the response of Mediterranean riparian vegetation to forecasted climate change scenarios.. 2.
(10) METHODS: Study site selection Three fundamental criteria were used for site selection: near-natural conditions in terms of hydrologic regime (absence of flow regulation) and other human pressures, riparian vegetation naturalness and the existence of hydrometric data recording. Southern Portuguese river basins were scanned to produce a list of potential study sites, using available land use and flow regime information, botanical literature and field surveys. From the list of possibilities a site on the Odelouca river basin was chosen. The Odelouca hydrographic basin is located in southern Portugal (between 37º10’49’’N, 8º29’54’’W and 37º26’33’’N, 8º12’16’’W) having 511.4 km2 of drainage area and 92.5 km of slow-running stream (Figure 1). Average annual precipitation is approximately 750 mm, mostly concentrated in a wet period from October to March, contrasting with a very dry one in the remaining months. These contradistinctive periods characterize its typical Mediterranean hydrological regime with winter flash peak floods opposing to a dry bed and a few remaining pools. Drainage is done on sedimentary and metamorphic formations, namely clay shales, greywacke and sandstones. Through the whole basin, riparian woody vegetation is generally composed by ash (Fraxinus angustifolia Vahl), willow (Salix salviifolia Brot), tamarisk (Tamarix africana Poir) and alder (Alnus glutinosa (L.) Gaertner) formations, the latter growing only in the downstream reaches with higher water availability. Upland contiguous forests are dominated by cork oak (Quercus suber L.) and olm oak (Quercus ilex L. subsp [Desf.] Samp. ballota).. 3.
(11) Figure 1. Study site location at Odelouca river basin and assessment area.. Field data Field sampling was carried out in summer 2009, including a topographic survey, and mapping of vegetation and habitat features. Topography data was obtained using a Leica 500 GPS, composed by two double frequency to real time SR 530 RTK antennas L1 and L2 AT 502 (1cm error approximately). Elevation was recorded in altitude (masl) points and with an effort to register every altitude variation of 20cm height. Vegetation and habitat assessment were done considering homogeneous vegetation patches each corresponding to one succession phase. Five succession phases were considered: Initial phase (IP), Pioneer phase (PP), Young Successional Woodland phase 1 (YSWP1), Young Successional Woodland phase 2 (YSWP2) and Mature Forest phase (MFP). Initial phase was attributed to all patches dominated by open sand or gravel bar (less than 50% of vegetation cover), absent of woody potential arboreal species. Patches dominated by woody arboreal species establishment with a maximum coverage of 35% were considered as Pioneer phase. Young Successional Woodland phase 1 category was attributed to patches with a moderate standing 4.
(12) biomass (less than 35% of open soil), dominated by microphanerophytes species (like willows and tamarisks). Patches presenting high canopy cover (less than 20% of open soil) and dominated by macrophanerophytes like ash-trees were considered Young Successional Woodland phase 2. These patches were characterized at the same time by the appearance of soil with A-horizon, that was absent from the former succession phases. Mature forest phase was considered in patches with the presence of terrestrial arboreal species of cork oaks or olm oaks typical of these Mediterranean landscapes. Each patch was recorded with its shape and georeferenciation, by walking along the limit of a polygon on the terrain using a submeter precision Trimble® GeoXT™ handheld GPS. GPS data was post-processed using Trimble® GPS Pathfinder® Office 3.00 to differentially correct, edit and export patch shape and georeferentiation data. Open soil feature was valued as the percentage of soil in the patch without aerial cover from vegetation. Percentage classes of soil substrates (rocks, boulders, stones, gravel, sand, fine elements and soil) per patch were visually estimated and gathered in types by dominant class, resulting in 13 soil types from which samples were collected for mechanical and organic matter content analysis. Samples were extracted from 0-40cm depth layer with a soil sampler, retrieving a composite sample of approximately 250cm3. Substrates with coarse elements (rocks, boulders, stones and gravel) in a percentage over 50% were considered coarse substrates. Soil texture was classified following mechanical analysis using USDA soil texture classification (USDA, 1993). Vegetation features inventories in each patch were focused in the most representative woody taxa and included species identification, measurement of stem diameters and ages. Woody species were considered phase indicators if overall representing the dominant species in the patch. Species also with dominancy in the patch but less present that phase indicators species were considered co-dominant species. Rare woody species in the patch generally dominated were assigned as companion species. Stem diameter was obtained from 3-4 of the oldest individuals on each patch. Stem diameter was recorded using a diameter caliper, calculating the mean of two crossed diameters of each individual. Stem diameters were recorded at a Breast Height level (DBH at ca. 1.3m) in specimens higher than 2m and near ground for smaller ones. Multi-stemmed individuals diameters were measured in the largest stem. Patch aging was performed using dendrochronological methods. We cored 3–4 of the largest individuals on each patch with a standard 5-mm increment borer, taking two (three when needed) perpendicular cores at 1.3m in adult trees (Mäkinen & Vanninen, 1999). For individuals smaller than 5 cm DBH, disks were obtained to calculate age.. 5.
(13) For multi-stemmed trees, the cores/disks were taken from the largest stem. In all sampled stems, diameter and height was also measured. Additional trees were selected nearby the study site to complete the oldest girth classes for each species and allow fitting growth curves together with diameter data. The total number of samples taken for age determination was 140, corresponding to 81 trees of which, 39 ash, 21 willow and 21 tamarisk. Cores were dried, mounted and polished. Cores were visually cross-dated (Stokes & Smiley, 1996) and ring increments were measured to an accuracy of 0.01mm using a linear table RINNTECH® LintabTM and the program TSAPWinTM (Rinn, 2003). Age was attributed directly to all samples showing pith (59). For samples that didn’t reach pith an estimation was done considering the sample diameter, average bark width and the average ring width for the first 10 years of life in each species (obtained from ring increments measurement in samples showing pith) (Rodríguez-González, et al., 2010).. Data analysis Topographic data was used to create the Digital Elevation Model (DEM) of the site, to be used in data processing, hydrologic and vegetation modeling. DEM (raster format with 0.5m size cell) is a graphical representation of ground surface, created in ESRI® ArcGis™ 9.2 from elevation data gathered in a topographic survey. A succession phase map was created from patch records and their georeferenciation at study site. Relevant patch characteristics were summarized using a Principal Components Analysis (PCA). This analysis considered patch area, mean water weight, patch age, mean stem diameter and open soil as variables, and succession phase as grouping variable. Analysis was based on correlations and computed variances as SS/(N-1). Patch area, patch mean slope, age and water height were tested with Analysis of Variance (ANOVA) to confirm significant differences between succession phases. ANOVA allowed testing the hypothesis of the variation being smaller than that due to normal variation of patch characteristics and error assigned to their measurement. The succession phase was consider as a categorical factor and at a significance level of α=0.05. Analyses were computed in Statistica software version 7.0 (StatSoft, 2004).. 6.
(14) Hydrological data Hydrological daily data were collected from “Monte dos Pachecos” gauging station (1961 – 2000 period) and complemented with “Sapeira” hydrometric station maximum water level data (2001 – 2007 period), both located in Odelouca River (SNIRH, 2010). Annual maximum flows were selected and its recurrence interval determined by fitting a Pearson III curve followed by adjustment verification with a χ2 test (α=0.05) using Microsoft® Office Excell® 2007. The annual maximum year flows of the study site were performed taking into account “Monte dos Pachecos” and the study site drainage basins and its precipitation ratio. Hydrologic annual maximum flows regime was created for the study site and missing values were estimated using recurrence interval information data. Hydrologic modeling was done using HEC-RAS 4.0 (Brunner, 2008) to determine water surface elevation for each flow in the study site, and River2D 0.93 (Steffler, et al., 2006) to obtain shear stress (shear stress can be defined as the water strength which is applied parallel to river bed on vegetation. This stress is dependent from water shear velocity and fluid density), and minimum base flow water table level data. River2D output data was imported to ESRI® ArcGis™ 9.2 environment and grids were created.. Climate change scenarios Climate change scenarios used in this study were the forecasts obtained in Global and Regional Circulation Models (GCMs and RCMs) for Portugal (Santos, et al., 2002, Santos & Miranda, 2006). From among several models tested, GCM HadCM3 and RCM HadRM2 (created by Hadley Centre for Climate Prediction and Research) have produced the most consistent results with the Portuguese historical observations (Santos, et al., 2002). GCMs have a lower resolution regarding to meteorological parameters than RCMs, which can best represent local variations (caused by topography and ocean/continent contrasts, for example) than former ones. In fact, other studies have already concluded that RCM simulations had better results than GCM models (Durman, et al., 2001). Also, SRES scenarios had no projected probability distribution so it cannot be said that one scenario is more probable than another’s (Santos & Miranda, 2006). In this case GCM HadCM3 worked with a point mesh distanced in hundreds of kilometers (only two points inside Portugal boundaries) whereas RCM HadRM2 simulated climatic change. 7.
(15) within dozens kilometers resolution mesh points (almost 40 points inside Portugal boundaries). The RCM HadRM2 model results considered the IPCC IS92a scenario (Leggett, et al., 1992, Houghton, et al., 1996) projecting an annual CO2 increase rate of 1% (CO2 levels double until 2100). All other green house gases concentrations were proportionally accounted in these CO2 concentrations. The GCM HadCM3 model consider the B2 scenario from Special Report Emission Scenarios (IPCC, 2000). SRES B2 Scenario considers a world focused in solving local social, economic and environmental issues, with a low rate growth population until late 21st century. Both models forecast a tendency to a concentration of runoff and precipitation in winter months against a reduction in the rest of the year. HadCM3 results for South of Portugal show a winter runoff increase from about 30% to 50% by 2100. HadRM2 results for Algarve region indicate a winter runoff increase from 60% to 130% by 2100. Regarding the annual ground recharge HadCM3 expects a decrease varying from 0% to 10% in South of Portugal and HadRM2 a decrease from 10% to 20% in Algarve region by 2100. This may represent a water table lowering up to 1m in HadCM3 and 4m in HadRM2 (Santos, et al., 2002, Santos & Miranda, 2006). Based on results from the study of Santos, et al., 2002 and Santos & Miranda, 2006, two future hydrological regimes were created to input the Dynamic Floodplain Vegetation Model. Scenario 1 and 2 were created from respectively HadCM3 and HadRM2 results. Scenario 1, the optimistic one, foresees a 50% increase in winter floods intensity with a reduction of 1m in the water table. Scenario 2, the pessimistic one, projects a 130% winter flood intensity increase with the lowering of about 4 meter of the water table.. Vegetation modeling For riparian vegetation modeling we used the Dynamic Floodplain Vegetation Model (DFVM) from Benjankar, 2009. This model focuses on floodplain physical processes and their effects on riparian vegetation. Working in an ArcGis environment, DFVM is consolidated in three major steps (modules), start module, dynamic and output view modules. Start module creates an initial vegetation landscape according to the topography and the height of vegetation above the water to be used further by next modules. This is a static module because disregards fluvial dynamics exerted upon vegetation. It needs. 8.
(16) calibration for the succession phases’ heights above water and its age. Start module calibration is done determining in the module each succession phases’ water height and age ranges. Dynamic module recreates physical processes influencing the survival and recruitment of riparian vegetation, resulting in a yearly based temporal (age) and spatial (area) vegetation representation. To recreate those physical processes the dynamic module considers topography, water height, shear stress and flood duration. The physical processes are modeled by zones, each one with different calibration parameters, therefore, three zones (aquatic, bank and floodplain) need to be previously defined to input in DFVM. The aquatic zone is defined as the inundated area by river base flow (in our case, as the river stops its flow in summer we considered it as the pools remaining when flow reaches 0m3/s). Bank and floodplain zones were defined as the inundated areas by 1 year and 100 years return period flows, respectively. The dynamic module is calibrated with previous start module calibration information plus shear stress resistance (adapted from Fisher & Dawson, 2003, Boavida, 2007 and Wu & Mao, 2007) and flood duration effects parameters range definition at different considered zones. The output view module creates an annual map of the succession phases with a consolidated legend. After calibration the model ran with previously created input information maps of topography, shear stress, flood duration, water table and the definition of floodplain, bank and aquatic zones. A database containing the 1999-2009 period hydrologic regime inputs was also constructed to guide the model along the simulation process. Calibration was made running the model for the last ten years period (1999 to 2009) and comparing the result with the succession phases observed at the site in the field sampling of summer 2009. Classification accuracy was evaluated comparing observed versus expected succession phases with Cohen’s Kappa (Cohen, 1960). Input data regarding the two chosen scenarios (scenario 1 and 2) were imported to the model and ran for the same ten year period.. 9.
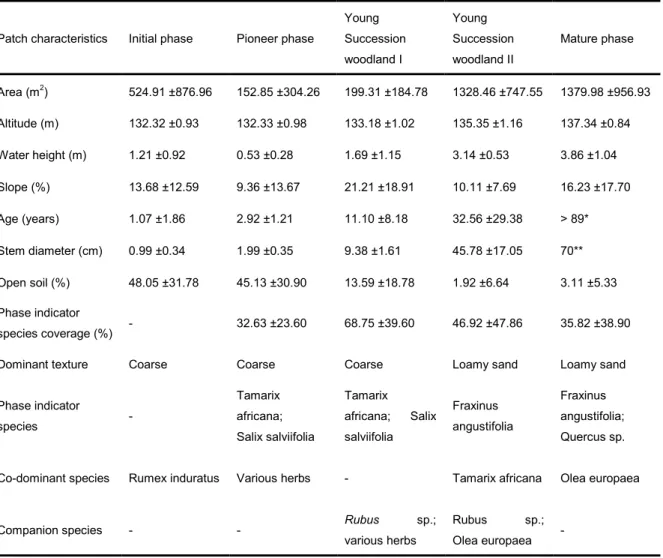
(17) RESULTS: Successional vegetation phases were sequentially disposed across a lateral gradient from the river deepest area towards upland vegetation (Table 1 and Figure 4). Different succession phase indicator species could be distinguished, as well as co-dominant and companion species (Table 1). IP is characterized by the absence of woody species so it didn’t have any phase indicator species. The co-dominant species in this phase was Rumex induratus (Boiss et Reut.). Phase indicator species were Tamarix africana and Salix salviifolia in PP and YSWP1 with various herbs being respectively co-dominant and companion species in these phases. Fraxinus angustifolia was the phase indicator species in the YSWP2 and MFP, and in the latter along with Quercus sp. YSWP2 and MFP presented as co-dominant species Tamarix africana and Olea europaea.. Table 1. Succession phases description in study site. Mean ±Std. Dev. for quantitative characteristics. Patch characteristics. Initial phase. Pioneer phase. Young. Young. Succession. Succession. woodland I. woodland II. Mature phase. Area (m2). 524.91 ±876.96. 152.85 ±304.26. 199.31 ±184.78. 1328.46 ±747.55. 1379.98 ±956.93. Altitude (m). 132.32 ±0.93. 132.33 ±0.98. 133.18 ±1.02. 135.35 ±1.16. 137.34 ±0.84. Water height (m). 1.21 ±0.92. 0.53 ±0.28. 1.69 ±1.15. 3.14 ±0.53. 3.86 ±1.04. Slope (%). 13.68 ±12.59. 9.36 ±13.67. 21.21 ±18.91. 10.11 ±7.69. 16.23 ±17.70. Age (years). 1.07 ±1.86. 2.92 ±1.21. 11.10 ±8.18. 32.56 ±29.38. > 89*. Stem diameter (cm). 0.99 ±0.34. 1.99 ±0.35. 9.38 ±1.61. 45.78 ±17.05. 70**. Open soil (%). 48.05 ±31.78. 45.13 ±30.90. 13.59 ±18.78. 1.92 ±6.64. 3.11 ±5.33. -. 32.63 ±23.60. 68.75 ±39.60. 46.92 ±47.86. 35.82 ±38.90. Coarse. Coarse. Coarse. Loamy sand. Loamy sand. Tamarix. Tamarix. africana;. africana;. Salix salviifolia. salviifolia -. Phase indicator species coverage (%) Dominant texture Phase indicator species. -. Co-dominant species. Rumex induratus. Various herbs. Companion species. -. -. Salix. Rubus various herbs. Fraxinus. Fraxinus. angustifolia;. angustifolia. Quercus sp.. Tamarix africana. sp.;. Rubus. sp.;. Olea europaea. Olea europaea. -. * Quercus sp. age was not measured. ** Only one polygon assessed.. 10.
(18) Soil analysis showed the presence of two main textural soil types with YSWP2 significantly different from younger phases regarding to the percentage of fine substrate (ANOVA F4,73=5.3611, p=0.00077). Bank zone patches were characterized by coarse elements and floodplain patches had a finer texture, with the presence of an A-horizon soil. Altitude, water height, age and stem diameter were the most important factors distinguishing succession phases (loadings >|0.75|) with 69.63% of total variance explained in the first two axis. Patch area of YSWP2 was significantly different from MFP and these two differ from PP and YSWP1 phases (ANOVA F4,79=57.321, p<0.0001). Patch mean slope wasn’t significantly different for any succession phases (ANOVA F4,79=1.9287, p=0.11381). Succession phases were significantly different for water heights (ANOVA F4,105800=35231, p<0.0001) and YSWP2 showed a significant age difference from PP and YSWP1 phases (ANOVA F4,59=9.1435, p=0.00001). Despite the non-significance in age shown by PP and YSWP1, at least 75% of the assessed patches of each succession phase ranged different ages, i.e., first three quarters of PP patches were under 4 years old and last three quarters of YSWP1were more than 5 years old. The Initial phase presented a water height series overlapping PP and YSWP1 phases (Figure 2).. 11.
(19) Figure 2. Succession phase water height and age differentiation (vowels represent significantly different groups).. 12.
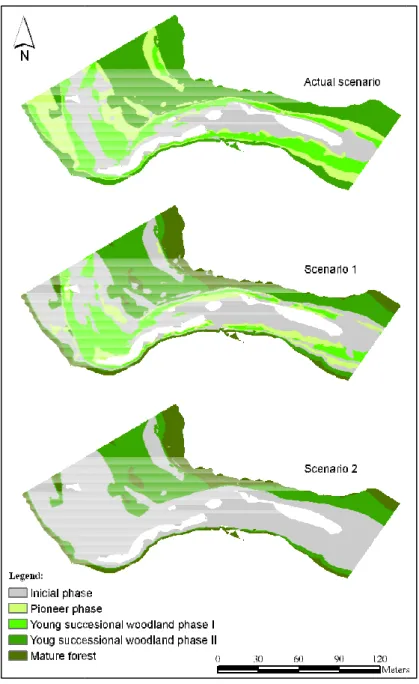
(20) The comparison between observed and expected areas occupied by succession phases returned a quadratic weighted Kappa of 0.61. Some authors consider this value as a good strength of agreement (Altman, 1991) and others as substantial strength (Landis & Koch, 1977). The highest differences between observed and expected never overcame 12%, and were found in the Initial and Pioneer phases, both subject to a more erratic physical disturbance. Mature phase was recorded in 0.56% of the sampled area in the field and it was not expected by the Dynamic Floodplain Vegetation Model (Figure 3).. Figure 3. Difference between succession phases area observed and expected in vegetation model.. In the actual scenario only the channel bed showed no woody vegetation. In both hydrologic/climatic scenarios 1 and 2, and comparing with the actual scenario, the model shows a decrease in area for PP, YSWP1 and YSWP2 phases and an increase in area for IP and MFP (Figure 4).. 13.
(21) Figure 4. Expected vegetation succession succession phases spatial response to different hydrologic climate change scenarios.. In the present scenario the First succession phase (IP) represented 23% of total area and PP plus YSWP1 vegetating in approximately 40% of total area,, namely 18.6% for PP and d 20.1% for YSWP1 (Figure 5). 5). YSWP2 can be found almost in exclusive in floodplain zone covering about 38% of total area. Mature forest with terrestrial terrest species is confined to the limits of the observed and expected actual scenario. scenario Comparing Scenario1 with actual one, one it is possible to observe that IP becomes simultaneously present in bank and floodplain zones, zone hence an increase of 16% of total area by this succession phase. On the other hand PP and YSWP1 decreased together in the same proportion (minus 9.7% and 5.7% of PP and YSWP1) respectively.. YSWP2 decreased in about 13% of total area with an increase incre in same magnitude for MFP, FP, now expected 14.
(22) in the farthest areas from the main channel. Scenario 2 compared with the actual one shows the complete depletion of PP and YSWP1, giving room to IP. This means an increase of about 38%, representing this phase approximately 62% of total area. Floodplain zone faces the reduction of YSWP2 (12.6% of total area) and is replaced by MFP. More intense floods and lower water tables foresee an IP increase by washing away the PP and YSWP1 phases without allowing ensuing recruitment due to the increment of hydric and shear disturbance. MFP increased its area by replacing the previous succession phase.. Figure 5. Expected patch area ratio for different hydrologic climate change scenarios.. 15.
(23) DISCUSSION: Patches of Tamarix africana (tamarisk) and Salix salviifolia (willow) characterized the pioneer phase and the younger woodlands found. The outer areas of the fluvial corridor were typically dominated by Fraxinus angustifolia (ash), in contact with the terrestrial vegetation series which is presently dominated by Quercus suber (cork-oak). The zonation found can be related to the biological traits of each species. Salix spp. and Tamarix spp. are pioneer species adapted to disturbance, the former is a phreatophyte with restricted intervals of seed release and viability (Krasny, et al., 1988, Karrenberg, et al., 2002), and the latter a facultative phreatophyte specie with longer seed dispersal period and greater drought tolerance (Glenn & Nagler, 2005). In the other hand, ash is a non obligate phreatophyte vegetating usually in silty soils, between mesic and wet (Dufour & Piégay, 2008) and taking up water from unsaturated soils (Sánchez-Pérez, et al., 2008). So, in spite of the harsh Mediterranean environment and its prolonged summer drought, native tree species developed strategies to overcome these constraints, enabling a successional age sequence to be mapped, adjusted to the flow regime similarly to the functioning of temperate rivers (Vadas & Sanger, 1997; Naiman, et al., 2005; Willms, et al., 2006 and citations therein).. The rather abrupt change from. successional riparian woodland to the mature phase and especially the characteristics of the later (very old, single stemmed trees) likely suffer from the historical influence of human actions during centuries, namely transforming the original mixed Mediterranean woodland into the Montado-cork-oak agro-forestry-pastoral systems (Pereira & Pires da Fonseca, 2003). Pioneer and young tree successional phases tend to be relatively larger in area than in temperate rivers (e.g. Fierke & Kauffman, 2006; Egger, et al., 2009), due to the shear stress of Mediterranean winter flows and therefore higher disturbance and difficulty of riparian trees to persist in time. The riparian patches mapped were proven significantly distinct in between, having different position in relation to the water level and with distinct ages. Less clear riparian patch frontiers, if they occur, might have resulted from other interfering environmental factors competitive with flow shaping, such as thermal stress and dryness (Stromberg, et al., 2007). Because flow seems to be driving patch distinctiveness, it enables the possibility of patch predictability by dynamic vegetation models such as the one used. Several models have been developed to describe riparian dynamics (Franz & Bazzaz, 1977; Hill, et al., 1998; Mahoney & Rood, 1998; Shafroth, et al., 2010; Shoutis, et al., 2010; Toner & Keddy, 1997; Ye, et al., 2010), but few of these models have been. 16.
(24) applied successfully to Mediterranean flow regime (e.g. Shafroth, et al., 2010). The possibility to predict riparian patches configures an important dimension for management purposes, including the definition of flow regimes, temporal backwards or forwards descriptive riparian scenarios, environmental directives to reservoir outflow management, river restoration planning or ecological quality assessments. Overall, under climate change scenarios, non-woody vegetated areas expand outwards and the mature successional patches expand inwards, while the pioneer areas and the young riparian patches decrease in area. The magnitude of winter flows foreseen in scenario 2 (coupled with the lowering of the water table during the extended summer and the eroded spring), drastically affect tree recruitment and enlarge the initial phase area to more that 50% of the studied area, because seed dispersal and seedling establishment lose their synchrony with hydrological processes and therefore have a lower survival and less time to consolidate into riparian woodland stands. On the other hand, mature (upland) forest at the limits of the river corridor, expand into formerly riparian patches, being less affected by winter high flows or soil dryness. On the long run and for the more pessimistic scenario, our results suggest that extreme climatic change will promote in Mediterranean rivers the disappearance of the riparian woodlands, either pioneer or young succession stages. Societal concern should therefore motivate some discussion around possible courses of action for riparian conservation, such as setting restoration goals to maintain sustainable river ecosystems while accounting for human services rather than regain historical landscapes (Dufour & Piégay, 2009). The second generation of basin plans senso WFD should be climate-proof, in the sense that it should incorporate forms of adapt to climate change, protecting the aquatic ecosystem while guarantying that human uses will not conflict with ecological quality standards (EEA, 2007; EEA, 2009). This could well be an unfeasible scenario, if Mediterranean riparian woods prove a limited capacity to adapt to such drastic changes. However, the ability of riparian Mediterranean vegetation to develop functional and structural adaptative strategies to climate change at the proper pace remains an open question. Feedbacks between riparian vegetation and stream low flow changes may become homeostatic if plant ecophysiological adaptations occur that ameliorate declines in base flows arising from increased aridity (Stromberg, et al., 2010). Moreover, other antropic or natural-driven changes at different scales Wilcox et al 2008 may also interact with climate, increasing uncertainty about vegetation evolution. Overall, further developments on methods and approaches like dynamic vegetation models are increasingly needed to provide society appropriate tools for the conservation of riparian ecosystems. 17.
(25) ACKNOWLEDGMENTS This study was done under the sponsorship of the European project RIPFLOW, funded by the IWRM ERA-net program. Patricia Rodríguez-González benefited from a post graduation grant FCT, SFRH/BPD/47140/2008. Aerial photographs were courtesy of Portuguese Geographic Institute (IGP) under the program FIGIEE. We thank to Mário Tavares from National Biologic Resources Institute, for the logistic support.. 18.
(26) REFERENCES Altman D. G. 1991. Practical Satistics for Medical Research. Chapman & Hall. London,UK. 613 pp. Araújo M., Thuiller W., Pearson R. G. 2006. Climate warming and the decline of amphibians and reptiles in Europe. Journal of Biogeography. 33: 1712-1728. doi:10.1111/j.1365-2699.2006.01482.x Arthinghton A. H., Bunn S. E., Poff L. N., Naiman R. J. 2006. The challenge of providing environmental flow rules to sustain river ecosystems. Ecological Applications. 16: 1311-1318. Benjankar R. 2009. Quantification of reservoir operation-based losses to floodplain physical processes and impact on the floodplain vegetation at the Kootenai river, USA. Dissertation for the degree of Doctor of Philosophy with a Major in Civil Engineering. University of Idaho, Moscow, USA. 288 pp Biesbroek G. R., Swart R. J., Carter T. R., Cowan C., Henrichs T., Mela H., Morecroft M. D., Rey D. 2010. Europe adapts to climate change: Comparing National Adaptation Strategies.. Global. Environmental. Change.. 20:. 440-450.. doi:10.1016/j.gloenvcha.2010.03.005 Boavida I. 2007. Análise bidimensional na determinação dos caudais ecológicos aplicaçãodo modelo River2D. Dissertation for the degree of Master in hydraulic and hydric resources. Instituto Superior Técnico, Technical University of Lisbon, Lisbon. 177 pp Boix D., García-Berthou E., Gascón S., Benejam L., Tornés E., Sala J., Benito J., Munné A., Solà C., Sabater S. 2010. Response of community structure to sustaindrought in Mediterranean rivers. Journal of Hydrology. 383: 135-146. doi:10.1016/j.jhydrol.2010.01.014 Brunner. G.. W.. 2008.. HEC-RAS,. River. Analysis. System. version. 4.0.0.. www.hec.usace.army.mil Cohen J. 1960. A coefficient of agreement for nominal scales. Educational and Psychological Measurement. XX: 37-46. doi:10.1177/001316446002000104 Dufour S., Piégay H. 2008. Geomorphological controls of Fraxinus excelsior growth and regeneration in floodplain forests. Ecology. 89: 205-215.. 19.
(27) Dufour S., Piégay H. 2009. From the myth of a lost paradise to targeted river restoration: forget natural references and focus on human benefits. River Research and Applications. 25: 568-581. doi:10.1002/rra.1239 Durman C. F., Gregory J. M., Hassel D. C., Jones R. G., Murphy J. M. 2001. A comparison of extreme European daily precipitation simulated by aglobal and regional climate model for present and future climates. Quartely Journal of the Royal Meteorological Society. 127: 1005-1015. Fierke M. K., Kauffman J. B. 2006. Riverscape-level patterns of riparian plant diversity along a successional gradient, Willamette river, Oregon. Plant Ecology. 185: 85-95. doi:10.1007/s11258-005-9086-z Fisher K., Dawson H. 2003. Reducing uncertainty in river flood conveyance roughness review. Department for Environment, Food & Rural Affairs, Environment Agency. Lincoln, UK. 209 pp. Franz E. H., Bazzaz F. A. 1977. Simulation of vegetation response to modified hydrologic regimes-probabilistic model based on niche differentiation in a floodplain florest. Ecology. 58: 176-183. Gasith A., Resh V. H. 1999. Streams in Mediterranean Climate Regions: abiotic influences and biotic responses to predictable seasonal events. Annu. Rev. Ecol. Syst. 30: 51-81. Glenn E. P., Nagler P. L. 2005. Comparative ecophysiology of Tamarix ramosissima and native trees in western U.S. riparian zones. Journal of Arid Environments. 61: 419446. doi:10.1016/j.jaridenv.2004.09.025 Hill N. M., Keddy P. A., Wisheu I. C. 1998. A hydrological model for predicting the effects of dams on the shoreline vegetation of lakes and reservoirs. Environmental Management. 22: 723-736. Hughes F. M. R. 1997. Floodplain biogeomorphology. Progress in physical geography. 21: 501-529. IPCC. 2001a. Climate change 2001: impacts, adaptation and vulnerability. Contribution of working group II to the Third Assessment Report of the Intergovernmental Panel on Climate Change (IPCC). McCarthy, J. J., Canziani, O. F., Leary, N. A., Dokken, D. J. and White, K. S. (eds.). Cambridge University Press. Cambrisge, UK. IPCC. 2001b. Climate Change 2001: The Sicentific Basis. Contribution of Working Group I to the Third Assessment Report of the Intergovernmental Panel on Climate Change. Houghton, J. T., Ding, Y., Griggs, D. J., Noguer, M., Linden, P. J., Dai, X., 20.
(28) Maskell, K. and Johnson, C. A. (eds.). Cambridge University Press. Cambridge, UK and New York, NY, USA. 881 pp. http://www.ipcc.ch/ IPCC. 2007. Climate Change 2007: The Physical Science Basis. Contribution of Working Group I to the Fourth Assessment Report of the Intergovernmental Panel on Climate Change. Solomon, S., Qin, D., Manning, M., Chen, Z., Marquis, M., Averyt, K. B., Tignor, M. and Miller, H. L. (eds.). Cambridge University Press. Cambridge, UK. 996 pp. Karrenberg S., Edwards P. J., Kollmann J. 2002. The life history of Salicaceae living in the active zone of floodplains. Freshwater Biology. 47: 733-748. Knox J. C., Kundzewicz Z. W. 1997. Extreme hydrological events, palaeo-information and climate change. Hydrological Scienses. 45: 765-779. Krasny M. E., Vogt K. A., Zasada J. c. 1988. Establishment of four Salicaceae species on river bars in interior Alaska. Holartic Ecology. 11: 210-219. Landis J. R., Koch G. G. 1977. The measurement of observer agreement for categorical data. Biometrics. 33: 159-174. Leggett J., Pepper W. J., Swart R. J. 1992. Emissions Scenarios for the IPCC: An Update. Climate Change 1992: The Supplementary Report to the IPCC Scientific Assessment. Cambridge University Press. Cambridge, UK. Mahoney J. M., Rood S. B. 1998. Stream flow requirements for cottonwood seedling recruitment - An integrated model. Wetlands. 18: 634-645. Mäkinen H., Vanninen P. 1999. Effect of sample selection on the environmental signal derived from tree-ring series. Forest Ecology and Management. 113: 83-89. Malmqvist B., Rundle S. R. 2002. Threats to the running water ecosystems of the world. Environmental Conservation. 29: 134-153. Merritt D. M., Scott M. L., Poff L. N., Auble G. T., Lytle D. A. 2010. Theory, methods and tools for determining environmental flows for riparian vegetation: riparian vegetation-flow response guilds. Freswater Biology. 55: 206-225. doi:10.1111/j.13652427.2009.02206.x Naiman R. J., Décamps H. 1997. The ecology of interfaces: Riparian zones. Annu. Rev. Ecol. Syst. 28: 621-658. Naiman R. J., Décamps H., McClain M. E. 2005. Riparia - Ecology, conservation and management of streamside communities. Elsevier academic press. 430 pp.. 21.
(29) Palmer M. A., Lettenmaier D. P., Poff L. N., Postel S. L., Richter B. D., Warner R. 2009. Climate. change. and. river. ecosystems:. protection. and. adaptation. options.. Environmental Management. 44: 1053-1068. doi:10.1007/s00267-009-9329-1 Palmer M. A., Liermann C. A. R., Nilsson C., Flörke M., Alcamo J., Lake P. S., Bond N. 2008. Climate change and the world's river basins: anticipating management options. Frontiers in Ecology and the Environment. 6: 81-89. doi:10.1890/060148 Pereira P. M., Pires da Fonseca M. 2003. Nature vs Nurture: the making of the montado ecosystem. Conservation Ecology. 7: 7. Piégay H., Salvador P. 1997. Contemporary floodplain forest evolution along the middle Ubaye river, Southern Alps, France. Global Ecology and Biogeography. 6: 397406. Poff L. N., Allan J. D., Bain M. B., Karr J. R., Prestegaard K. L., Richter B. D., Sparks R. E., Stromberg J. C. 1997. The natural flow regime. Bioscience. 47: 769-784. Richter B. D., Baumgartner J. V., Wigington R. 1997. How much water does a river need? Freswater Biology. 37: 231-249. Rinn F. 2003. TSAP-Win (Time Series Analysis and Presentation Dendrochronology and Related Aplications) version Rodríguez-González P. M., Stella J. C., Campelo F., Ferreira M. T., Albuquerque A. 2010. Subsidy or stress? Tree structure and growth in wetland forests along a hydrological gradient in Southern Europe. Forest Ecology and Management. 259: 2015-2025. doi:10.1016/j.foreco.2010.02.012 Sánchez-Pérez J. M., Bariac T., Trémolieres M. 2008. Water uptake by trees in a riparian hardwood forest (Rhine floodplain, France). Hydrological processes. 22: 366375. Sánchez E., Gallardo C., Gaertner M. A., Arribas A., Castro M. 2004. Future climate extreme events in the Mediterranean simulated by a regional climate model: a first approach.. Global. and. Planetary. Change.. 44:. 163-180.. doi:10.1016/j.gloplacha.2004.06.010 Santos F. D., Forbes K., Moita R. 2002. Climate Change in Portugal, Scenarios, Impacts and Adaptation Measures - SIAM project. Lisbon, Portugal. Santos F. D., Miranda P. 2006. Alterações climáticas em Portugal cenários, impactos e medidas de adaptação, Projecto SIAM II. Gradiva. Lisbon. 506 pp.. 22.
(30) Schröter D., Cramer W., Leemans R., Prentice I. C., Araújo M. B., Arnell N. W., Bondeau A., Bugmann H., Carter T. R., Gracia C. A., Vega-Leinert A. C., Erhard M., Ewert F., Glendining M., House J. I., Kakaanpää S., Klein R. J. T., Lavorel S., Lindner M., Metzger M. J., Meyer J., Mitchell T. D., Reginster I., Rounsevel M., Sabaté S., Sitch S., Smith B., Smith J., Smith P., Sykes M. T., Thonicke K., Thuiller W., Tuck G., Zaehle S., Zierl B. 2005. Ecosystem Service Supply and Vulnerability to Global Change in Europe. Science. 310: 1333-1337. Shafroth P. B., Wilcox A. C., Lytle D. A., Hickey J. T., Andersen D. C., Beauchamp V. B., Hautzinger A., McMullen L. E., Warner A. 2010. Ecosystem effects of environmental flows: modelling and experimental floods in a dryland river. Freshwater Biology. 55: 6885. doi:10.1111/j.1365-2427.2009.02271.x Shoutis L., Patten. D. T., McGlynn B. 2010. Terrain-based Predictive Modeling of. Riparian Vegetation in a Northern Rocky Mountain Watershed. Wetlands. 30: 621-633. doi:10.1007/s13157-010-0047-5 StatSoft. 2004. Statistica (data analysis software system) version 7. www.statsoft.com Steffler P., Ghanem A., Blackburn J., Yang Z. 2006. River2D version Stokes M. A., Smiley T. L. 1996. An Introduction toTree-Ring Dating. The University of Arizona Press. Tucson, USA. 73 pp. Stromberg J. C., Lite S. J., Dixon M. D. 2010. Effects of stream flow patterns on riparian vegetation of a semiarid river: implications for a changing climate. River Research and Applications. 26: 712-729. doi:10.1002/rra.1272 Stromberg J. C., Lite S. J., Marler R., Paradzick C., Shafroth P. B., Shorrock D., White J. M., White M. S. 2007. Altered stream-flow regimes and invasive plant species: the Tamarix case. Global Ecology and Biogeography. 16: 381-393. doi:10.1111/j.14668238.2007.00297.x Toner M., Keddy P. A. 1997. River hydrology and riparian wetlands: a predictive model for ecological assembly. Ecological Applications. 7: 236-246. USDA S. S. D. S. 1993. Soil survey manual. Handbook. U. S. Department of Agriculture. Vadas R. L., Sanger J. E. 1997. Lateral zonation of trees along a small Ohio stream. Ohio J. Sci. 97: 107-112. Walker K. F., Sheldon F., Puckridge J. T. 2006. A perspective on dryland river ecosystems. Regulated Rivers: Research & Management. 11: 85-104. 23.
(31) Ward J. V. 1998. Riverine landscapes: Biodiversity patterns, disturbance regimes, and aquatic conservation. Biological Conservation. 83: 269-278. Wilcox B. P., Breshears D., Allen C. D. 2003. Ecohydrology of a resource-conserving semiarid woodland: effects of scale and disturbance. Ecological Monographs. 73: 223239. Willms C. R., Pearce D. W., Rood S. B. 2006. Growth of riparian cottonwoods: a developmental pattern and the influence of geomorphic context. Trees. 20: 8. Woodward G., Perkins D. M., Brown L. E. 2010. Climate change and freshwater ecosystems: impacts across multiple levels of organization. Philosophical Transactions of the Royal Society B. 365: 2093-2106. doi:10.1098/rstb.2010.0055 Wu R., Mao C. 2007. The assessment of river ecology and habitat using a twodimensional hydrodynamic and habitat model. Journal of Marine Science and Technology. 15: 322-330. Ye F., Chen Q., Li R. 2010. Modelling the riparian vegetation evolution due to flow regulation of Lijiang River by unstructured cellular automata. Ecological Informatics. 5: 108-114. doi:10.1016/j.ecoinf.2009.08.002. 24.
(32)
Imagem


Documentos relacionados
This study assessed the influence of riparian vegetation on the input and storage of allochthonous organic matter, and quantifies the seasonal variation category
O presente estudo decorreu num agrupamento de escolas da região Alentejo e teve como principal objectivo a avaliação, no âmbito do processo de
Temos como objetivo elaborar uma análise comparativa dos gêneros resumos para congresso em duas áreas de conhecimento (Ciências Biológicas e Letras), de forma que seja possível a
A partir da revisão das teses e dissertações elaboradas de 2003 a 2015, que desenvolveram temas relacionados ao racismo, nos componentes curriculares da educação
Deste modo, com a maior integração da sociedade a nível mundial, problemas relacio- nados a direitos humanos e limitação do poder deixaram de ser tratados somente pelo direito
the flanks and feet are covered with marsh forest, the inter- ridge swamps have swamp forest, swarnp wood, swamp scrub, or an open herbaceous swamp
In this study, the dynamic vegetation model Inland (Integrated Model of Land Surface Processes) driven by two representative concentration pathways (RCPs) scenarios was applied
In this study, we extracted vegetation coverage information using the dimidiate pixel model of NDVI to provide comparisons and analysis of changes in vegetation coverage over
