EUROPEAN ORGANIZATION FOR NUCLEAR RESEARCH (CERN)
CERN-EP-2018-074 2018/10/26
CMS-TOP-17-018
Measurement of the production cross section for single top
quarks in association with W bosons in proton-proton
collisions at
√
s
=
13 TeV
The CMS Collaboration
∗Abstract
A measurement is presented of the associated production of a single top quark and a
W boson in proton-proton collisions at√s= 13 TeV by the CMS Collaboration at the
CERN LHC. The data collected corresponds to an integrated luminosity of 35.9 fb−1.
The measurement is performed using events with one electron and one muon in the final state along with at least one jet originated from a bottom quark. A multivari-ate discriminant, exploiting the kinematic properties of the events, is used to sep-arate the signal from the dominant tt background. The measured cross section of
63.1±1.8 (stat)±6.4 (syst)±2.1 (lumi) pb is in agreement with the standard model
expectation.
Published in the Journal of High Energy Physics as doi:10.1007/JHEP10(2018)117.
c
2018 CERN for the benefit of the CMS Collaboration. CC-BY-4.0 license
∗See Appendix A for the list of collaboration members
1
1
Introduction
Single top quarks, observed for the first time by the D0 [1] and CDF [2] Collaborations at the Fermilab Tevatron, are produced via the electroweak interaction. There are three main pro-duction modes in proton-proton (pp) or proton-antiproton (pp) collisions: the exchange of a virtual W boson (t channel), the production and decay of a virtual W boson (s channel), and the associated production of a top quark and a W boson (tW channel).
The tW process at the CERN LHC provides a unique opportunity to study the standard model (SM) and its extensions through the interference of the process at next-to-leading order (NLO) with top quark pair (tt) production [3–5]. The tW process also plays an important role because of its sensitivity to the physics beyond the SM [6–8].
The tW production rate in pp collisions at the Tevatron was negligible but at the LHC this process makes a significant contribution to single top quark production. The CMS and ATLAS Collaborations have presented evidence for [9, 10] and observations of [11, 12] this process in
pp collisions at√s = 7 and 8 TeV, respectively. The ATLAS Collaboration has also measured
the production cross section using 13 TeV data [13].
The tW production cross section is computed at an approximate next-to-next-to-leading order (NNLO). The corresponding theoretical prediction for the tW cross section in pp collisions
at √s = 13 TeV, assuming a top quark mass (mt) of 172.5 GeV, is σtWref = 71.7±1.8 (scale)±
3.4 (PDF) pb [14]. The first uncertainty refers to the factorization (µF) and renormalization (µR)
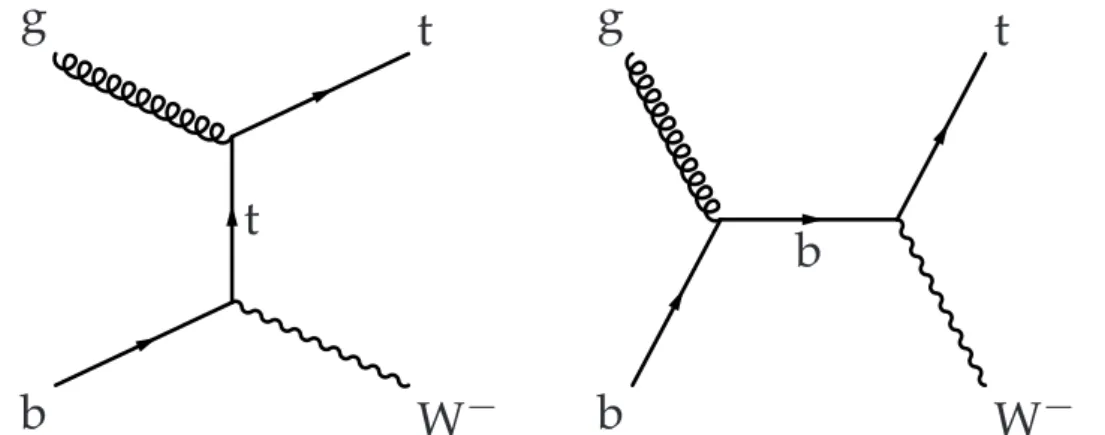
scales in quantum chromodynamics (QCD), and the second to parton distribution functions (PDFs). The quoted cross section includes the charge-conjugate modes. The leading-order (LO) Feynman diagrams for tW production are shown in Fig. 1.
t
b
g
W
t
b
b
g
W
t
Figure 1: Leading-order Feynman diagrams for single top quark production in the tW channel that implicitly include the charge-conjugate contributions.
This paper reports the first measurement from the CMS Collaboration of tW production in
pp collisions at √s = 13 TeV. The measurement uses data recorded by CMS during 2016,
corresponding to an integrated luminosity of 35.9±0.9 fb−1. The analysis is performed using
the e±µ∓ dilepton channel, in which both W bosons, either produced in association with the
top quark or from the decay of the top quark, decay leptonically into a muon or an electron
(`), and a neutrino. Events with W bosons decaying into τ leptons that decay into electrons
or muons also contribute to the measurement. The primary background to tW production in this final state comes from tt production, with Drell–Yan (DY) production of τ lepton pairs that decay leptonically being the next most significant background. To extract the signal, the analysis uses a multivariate technique, exploiting kinematic observables to distinguish the tW signal from the dominant tt background.
The paper is structured as follows. Section 2 provides a summary of the CMS detector and of the Monte Carlo (MC) event simulation. The object and event selection criteria are discussed in Section 3. The description of the method used to separate the tW signal from the tt background is given in Section 4. The sources of systematic uncertainties are discussed in Section 5. The extraction of the tW production cross section is described in Section 6, and a summary of the results is presented in Section 7.
2
The CMS detector and Monte Carlo simulation
The CMS detector has a superconducting solenoid in its central region that provides an
ax-ial magnetic field of 3.8 T. The silicon pixel and strip trackers cover 0 < φ < 2π in azimuth
and|η| < 2.5 in pseudorapidity. The lead tungstate crystal electromagnetic calorimeter, and
the brass and scintillator hadron calorimeter are located inside the solenoid. These are used to identify electrons, photons, and jets. Muons are measured in gas-ionization detectors em-bedded in the steel flux-return yoke outside the solenoid. The detector is nearly hermetic, providing reliable measurement of the momentum imbalance in the plane transverse to the beams. A two-level trigger system selects the most interesting pp collisions for offline analysis. A more detailed description of the CMS detector, together with a definition of the coordinate system used and the relevant kinematic variables, can be found in Ref. [15].
The tW signal is simulated at NLO usingPOWHEG v1 [16] with the NNPDF 3.0 PDF set [17],
and PYTHIA v8.205 [18, 19], with the underlying event tune CUETP8M1 [20, 21], is used for
parton showering and hadronization. At NLO in perturbative QCD, tW production interferes with tt production [3–5]. Two different procedures can be used to account for this interference: the ”diagram removal” (DR) [3] approach, where all NLO diagrams that are doubly resonant are excluded from the signal definition; and the ”diagram subtraction” (DS) [3, 22] approach, in which the differential cross section is modified with a gauge-invariant subtraction term, which locally cancels the contribution of tt diagrams. The DR scheme is used here, and it has been verified that the number of predicted events after the full selection is comparable with that obtained from the DS approach.
The NLOPOWHEGv2 [23] setup is used to simulate tt events, as well as the dependency of the
tt production on mt, µRand µF, and the PDF set. The NNPDF 3.0 set is used as the default PDF
set. Parton showering and hadronization for the tt events are handled byPYTHIAv8.205 with
the underlying event tune CUETP8M2T4 [24].
Background contributions from processes other than tt are also estimated from MC simulations.
The DY and W+jets background samples are generated at NLO with MADGRAPH5 aMC@NLO
v2.2.2 [25] with NNPDF 3.0 PDFs, interfaced withPYTHIAv8.205, with the CUETP8M1
under-lying event tune for fragmentation and hadronization. These processes are simulated with up to two additional partons and the FxFx scheme [26] is used for the merging. The contributions
from WW, WZ, and ZZ (referred to as VV) processes are simulated at LO withPYTHIAv8.205
with the CUETP8M1 underlying event tune. Other contributions from W and Z boson
pro-duction in association with tt events (referred to as ttV) are simulated at NLO using MAD
-GRAPH5 [email protected] and interfaced withPYTHIAv8.205 with the CUETP8M1 underlying
event tune. Finally, the tt and W+jets samples described above, in the lepton+jets final state, are used to determine the contribution to the background from events with a jet incorrectly reconstructed as a lepton or with a lepton incorrectly identified as being isolated. These last contributions to the background are labeled non-W/Z as they contain a lepton candidate that does not originate from a leptonic decay of a gauge boson.
3
For comparison with the measured distributions, the event yields in the simulated samples are normalized using the integrated luminosity and their theoretical cross sections. These are taken from NNLO (W+jets and DY [27]), approximate NNLO (single top quark tW chan-nel [14]), and NLO (diboson [28]) calculations. For the simulated tt sample, the full NNLO
plus next-to-next-to-leading-logarithmic accuracy calculation [29], performed with the TOP++
2.0 program [30], is used. The PDF uncertainty is added in quadrature to the uncertainty
associated with the strong coupling constant (αS) to obtain a tt production cross section of
832+20
−29(scale)±35 (PDF+αS) pb assuming mt= 172.5 GeV. The simulated samples include
ad-ditional interactions per bunch crossing (pileup), with the distribution matching that observed in data, with an average of 23 collisions per bunch crossing.
3
Event selection
In the SM, a top quark decays almost exclusively into a W boson and a bottom quark. The
analysis uses the e±µ∓decay channel, in which the W boson produced in association with the
top quark and the W boson from the decay of the top quark both decay leptonically, one into an electron and the corresponding neutrino, and the other into a muon and the corresponding neutrino. This leads to a final state composed of two oppositely charged leptons, a jet resulting from the fragmentation of a bottom quark, and two neutrinos. The event selection described here follows closely that used in the measurement of the top quark-antiquark pair production cross section in the dilepton channel [31].
Events are required to pass either a dilepton or single-lepton trigger. The dilepton triggers
require events to contain either one electron with transverse momentum pT >12 GeV and one
muon with pT > 23 GeV, or one electron having pT >23 GeV and one muon with pT >8 GeV.
In addition, single-lepton triggers with one electron (muon) with pT > 27(24)GeV are used
to increase the efficiency. The efficiency for the combination of the single-lepton and dilepton triggers is measured in data events passing the dilepton selection criteria given below and
collected using triggers based on the pT imbalance in the event. This efficiency is found to be
≈98%. The efficiency of the simulated trigger is corrected to match that observed in data using
a multiplicative scale factor (SF).
The particle-flow (PF) algorithm [32] attempts to reconstruct and identify each individual par-ticle in an event with an optimized combination of information from the various elements of the CMS detector. Leptons (electrons [33] or muons [34]) in the event are required to be well
isolated and to have pT >20 GeV and|η| <2.4. Isolation requirements are based on the scalar
sum of the pT of all PF candidates, reconstructed inside a cone of∆R=
√
(∆η)2+ (∆φ)2 =0.3
(0.4) centered on the electron (muon), excluding the contribution from the lepton candidate. Tracks not coming from the main vertex are excluded in the calculation. This isolation variable
is required to be smaller than 6 (15)% of the electron (muon) pT. Events with W bosons
decay-ing into τ leptons contribute to the measurement only if the τ leptons decay into electrons or muons that satisfy the selection requirements. In events with more than two leptons passing
the selection, the two with the largest pTare selected for further study.
Jets are reconstructed from the PF candidates using the anti-kT clustering algorithm [35, 36]
with a distance parameter of 0.4. The jet momentum is determined as the vectorial sum of all particle momenta in the jet, and on average is found from simulation to be within 5 to 10%
of the true momentum over the whole pT spectrum and detector acceptance. Additional pp
interactions within the same or nearby bunch crossings can contribute additional tracks and calorimetric energy depositions to the jet momentum. To mitigate this effect, tracks identified
as originating from pileup vertices are discarded, and an offset correction is applied to correct for the remaining contributions. Jet energy corrections, derived from simulation, are applied so that the average response to jets matches the particle level jets [37]. In situ measurements of the momentum balance in dijet, photon+jet, Z+jet, and multijet events are used to account for any residual differences in jet energy scale (JES) between data and simulation. Additional selection criteria are applied to each jet to remove jets potentially dominated by anomalous contributions from various subdetector components or reconstruction failures. Jets are required
to have pT > 30 GeV and |η| < 2.4. In order to avoid double counting, jets within a cone
of ∆R = 0.4 with respect to the selected leptons are not considered. Jets passing the above
identification criteria but with pTbetween 20 and 30 GeV are referred to as ”loose jets”.
The missing transverse momentum vector~pTmiss is defined as the negative vector sum of the
momenta of all reconstructed PF candidates in an event, projected onto the plane perpendicular
to the direction of the beam axis. Its magnitude is referred to as pmiss
T and the corrections to jet
momenta are propagated to the pmiss
T calculation [38].
In contrast to some sources of backgrounds, such as DY events, the tW final state contains a bottom quark. The identification of jets originating from b quarks results in a significant reduction in background. Jets are identified as b jets using the combined secondary vertex
algorithm v2 [39], with an operating point that yields identification efficiencies of ≈70% and
misidentification (mistag) probabilities of about 1% and 15% [39] for light-flavor jets (u, d, s, and gluons) and c jets, respectively, as estimated from simulated events.
Events are classified as belonging to the e±µ∓final state if the two leptons with larger pT
(lead-ing leptons) pass(lead-ing the above selection criteria are an electron and a muon of opposite charge.
We require the leading lepton to have pT >25 GeV. As this requirement for electrons is lower
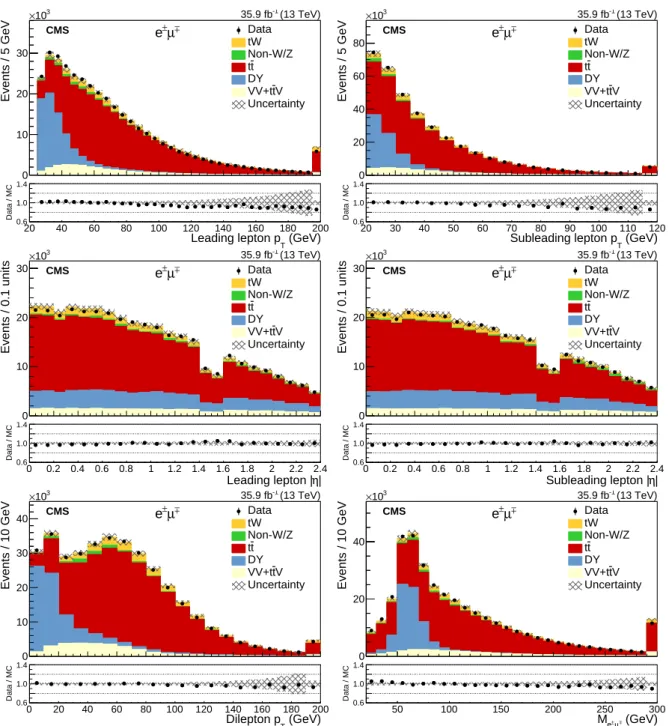
than the corresponding trigger threshold, some of the phase space is triggered only by the muon or dilepton triggers. This effect is taken into account in the measurement of the trigger efficiency. To reduce the contamination from DY production of τ lepton pairs with low invari-ant dilepton mass, the invariinvari-ant mass of the lepton pair is required to be greater than 20 GeV. Figure 2 shows a comparison of several lepton kinematic distributions in data and simulated events after this baseline selection.
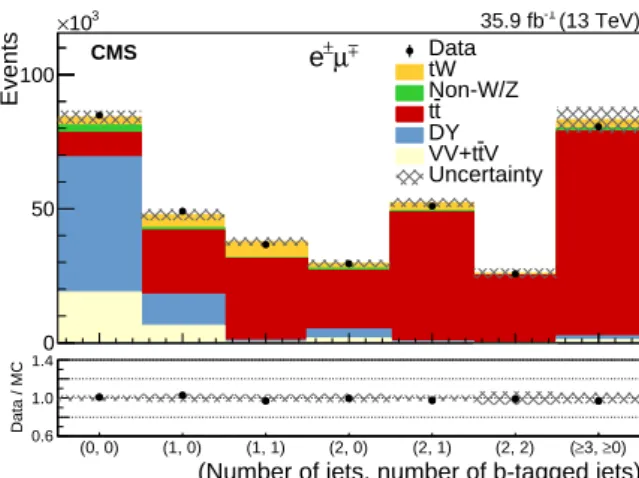
Figure 3 shows a comparison of the yields observed in data with those estimated from simu-lated events, classified according to the number of jets and identified b jets in the event. As expected, the most signal-enriched region is the one with one jet that is tagged as a bottom jet (1j1b region), but the size of the signal in comparison with the overwhelming tt background makes a cut-based analysis extremely challenging. Therefore, a multivariate analysis is pur-sued.
For the final analysis, the events are classified into three independent categories: a signal-enriched region with 1j1b events, and two background-dominated regions with two jets, one with one b-tagged jet (2j1b) and one with two b-tagged jets (2j2b).
4
Signal extraction
As noted previously, following the baseline event selection the data sample in the 1j1b region consists primarily of tt events with a significant number of tW signal events (as can be seen from Fig. 3). Given that there is no single observable that clearly discriminates between the signal and background, a multivariate method is used to discriminate the tW signal from the main background process, tt. Several observables are combined into a single discriminator using
5 Events / 5 GeV 0 10 20 30 3 10 × Data tW Non-W/Z t t DY V t VV+t Uncertainty CMS (13 TeV) -1 35.9 fb ± µ ± * e (GeV) T Leading lepton p 20 40 60 80 100 120 140 160 180 200 Data / MC0.6 1.0 1.4 Events / 5 GeV 0 20 40 60 80 3 10 × Data tW Non-W/Z t t DY V t VV+t Uncertainty CMS (13 TeV) -1 35.9 fb ± µ ± * e (GeV) T Subleading lepton p 20 30 40 50 60 70 80 90 100 110 120 Data / MC0.6 1.0 1.4 Events / 0.1 units 0 10 20 30 3 10 × Data tW Non-W/Z t t DY V t VV+t Uncertainty CMS (13 TeV) -1 35.9 fb ± µ ± * e | η Leading lepton | 0 0.2 0.4 0.6 0.8 1 1.2 1.4 1.6 1.8 2 2.2 2.4 Data / MC0.6 1.0 1.4 Events / 0.1 units 0 10 20 30 3 10 × Data tW Non-W/Z t t DY V t VV+t Uncertainty CMS (13 TeV) -1 35.9 fb ± µ ± * e | η Subleading lepton | 0 0.2 0.4 0.6 0.8 1 1.2 1.4 1.6 1.8 2 2.2 2.4 Data / MC0.6 1.0 1.4 Events / 10 GeV 0 10 20 30 40 3 10 × Data tW Non-W/Z t t DY V t VV+t Uncertainty CMS (13 TeV) -1 35.9 fb ± µ ± * e (GeV) T Dilepton p 0 20 40 60 80 100 120 140 160 180 200 Data / MC0.6 1.0 1.4 Events / 10 GeV 0 20 40 3 10 × Data tW Non-W/Z t t DY V t VV+t Uncertainty CMS (13 TeV) -1 35.9 fb ± µ ± * e (GeV) ± µ ± e M 50 100 150 200 250 300 Data / MC0.6 1.0 1.4
Figure 2: Comparison of several lepton kinematic variables for the observed data and sim-ulated events after the dilepton selection is applied. The last bin includes overflow events. The error band includes the statistical and all systematic uncertainties, except those from back-ground normalization. The bottom of each panel shows the ratios of data to the sum of the expected yields.
Events 0 50 100 3 10 × Data tW Non-W/Z t t DY V t VV+t Uncertainty CMS (13 TeV) -1 35.9 fb ± µ ± * e
(Number of jets, number of b-tagged jets)
(0, 0) (1, 0) (1, 1) (2, 0) (2, 1) (2, 2) (≥3, ≥0)
Data / MC
0.6 1.0 1.4
Figure 3: Yields observed in data, compared with those expected from simulation, as a function of the number of jets and number of b-tagged jets for events passing the baseline dilepton selection. The error band includes the statistical and all systematic uncertainties, except those from background normalization. The bottom of each panel shows the ratios of data to the sum of the expected yields.
a boosted decision tree (BDT) technique [40, 41]. In this analysis, the BDT implementation is provided by the ”Toolkit for Multivariate Data Analysis” [40] package, using the gradient boost algorithm [40, 41]. The training of the BDT is performed using dedicated simulated samples for tW and tt that are statistically independent from those used for the signal extraction. The input variables used for training the BDT in the 1j1b region, listed in order of importance to the BDT training are shown below. The order of importance is determined by counting how often each variable is used to split decision trees. The counts are weighted by the separation gain squared achieved by the variable and by the number of events in the node.
• pTof leading loose jet, set to 0 for events with no loose jets present;
• magnitude of the vector sum of the pT’s of leptons, jet, and~pTmiss(psysT );
• pTof the jet;
• ratio of the scalar sum of the pT of the leptons to the scalar sum (HT) of the pT’s of
leptons, jet, and pmiss
T ;
• number of loose jets;
• centrality (ratio between the scalar sums of the pT and of the total momentum) of
the jet and the two leptons;
• magnitude of the vector sum of the pTof the jet and leptons;
• HT;
• ratio of psysT to HT for the event;
• invariant mass of the combination of the leptons, jet, and pmissT ;
• number of b-tagged loose jets.
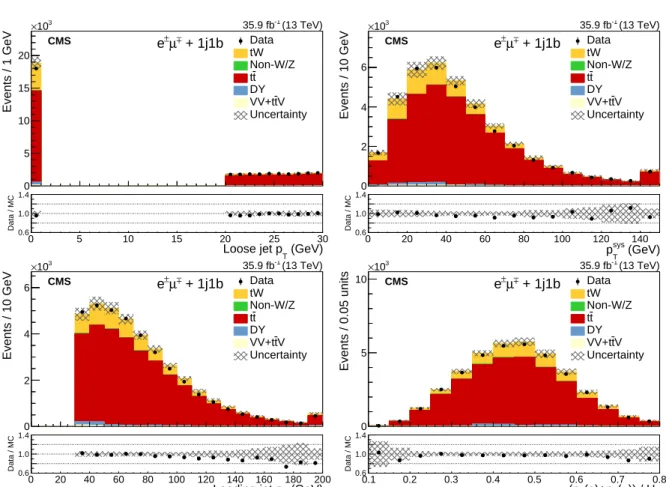
The distributions of the four variables with the most discriminating power, in data and simu-lated events, are shown in Fig. 4.
A separate BDT is trained with events in the 2j1b region. The input variables used for the training, listed in order of importance to the BDT training, are the following:
• separation in the φ−ηspace between the dilepton and dijet systems,∆R (e±µ∓, j1j2);
7 Events / 1 GeV 0 5 10 15 20 3 10 × Data tW Non-W/Z t t DY V t VV+t Uncertainty CMS (13 TeV) -1 35.9 fb + 1j1b ± µ ± * e (GeV) T Loose jet p 0 5 10 15 20 25 30 Data / MC0.6 1.0 1.4 Events / 10 GeV 0 2 4 6 3 10 × Data tW Non-W/Z t t DY V t VV+t Uncertainty CMS (13 TeV) -1 35.9 fb + 1j1b ± µ ± * e (GeV) sys T p 0 20 40 60 80 100 120 140 Data / MC0.6 1.0 1.4 Events / 10 GeV 0 2 4 6 3 10 × Data tW Non-W/Z t t DY V t VV+t Uncertainty CMS (13 TeV) -1 35.9 fb + 1j1b ± µ ± * e (GeV) T Leading jet p 0 20 40 60 80 100 120 140 160 180 200 Data / MC0.6 1.0 1.4 Events / 0.05 units 0 5 10 3 10 × Data tW Non-W/Z t t DY V t VV+t Uncertainty CMS (13 TeV) -1 35.9 fb + 1j1b ± µ ± * e T )) / H µ ( T (e)+p T (p 0.1 0.2 0.3 0.4 0.5 0.6 0.7 0.8 Data / MC0.6 1.0 1.4
Figure 4: Most discriminating variables used for the training of the BDT in the 1j1b category. The last bin includes overflow events. The error band includes the statistical and all systematic uncertainties. The bottom of each panel shows the ratios of data to the sum of the expected yields.
system,∆R (e±µ∓, j1j2pmiss T );
• pTof the subleading jet;
• separation in the φ−ηspace between the leading lepton and the leading jet,∆R (`1,
j1).
The 2j2b control region is highly enriched with tt events and is used to constrain this main
source of background using the pTdistribution of the subleading jet. This variable is sensitive
to JES variations and, therefore, useful in constraining this source of systematic uncertainty. The signal is extracted by performing a maximum likelihood fit to one measured distribution in each of the three measurement regions: the distributions of the BDT output in the 1j1b and
2j1b categories, and of the pT of the subleading jet in the 2j2b region. The binning of the BDT
outputs is chosen such that each bin contains approximately the same number of tt background events. This selection of binning ensures that enough background events populate all the bins of the distribution, helping to constrain the systematic uncertainties. The fit is performed si-multaneously in the three regions. The uncertainties on the tt overall normalization and shapes (including migrations into/out of the signal and control regions) are handled using different nuisance parameters, one for each systematic uncertainty and for all regions.
The likelihood used in this statistical analysis,L(µ,~θ), is a function of the signal strength,
de-fined as the ratio of measured and expected cross sections µ= σtW/σtWref, and a set of nuisance
parameters,~θ, that parametrize the systematic uncertainties present in the analysis. The
ex-pected numbers of both signal and background events in each bin of the distributions are
ob-tained using normalized distributions (templates) from simulation, and are a function of~θand,
in the case of the signal, µ. The likelihood function is constructed as the product of Poisson probabilities, corresponding to the number of events in each bin of the distributions. Addition-ally, the systematic uncertainties are introduced in the likelihood by multiplying it by the prior of each nuisance parameter, which are log-normal probability density functions.
The best value for µ is obtained by maximizing the likelihood function with respect to all its pa-rameters. The 68% confidence interval is obtained by considering variations of the test statistic used in Ref. [42] by one unit from its minimum.
5
Systematic uncertainties
The measurement of the tW production cross section is affected by systematic uncertainties that originate from detector effects and event modeling, which can change the shape and/or the normalization of the distributions used in the fit. Each source of systematic uncertainty is assessed individually by appropriate variations of the MC simulations or by variations of parameter values in the analysis within their estimated uncertainties, and propagated to the signal strength. A nuisance parameter represents each of the sources and these parameters are used, together with the tW production cross section, as parameters in the fit.
5.1 Experimental uncertainties
The following sources of experimental uncertainty are considered in the analysis:
• The uncertainties in the trigger and lepton identification efficiencies in simulation
are estimated by varying data-to-simulation SFs by their uncertainties. These are
about 0.7 and 1.5%, respectively, with some dependence on the lepton pTand η. For
5.2 Modeling uncertainties 9
muons.
• The uncertainty due to the limited knowledge of the JES and jet energy resolution
is determined by varying the scale and resolution within the uncertainties in bins of
pTand η, typically by a few percent [37]. JES uncertainties are propagated to~pTmiss.
• The uncertainties resulting from the b tagging efficiency and misidentification rate
are determined by varying, within their uncertainties, the b tagging data-to-simulation SFs of the b jets and the light-flavor jets, respectively. These uncertainties depend
on the pT and η of the jet and amount to approximately 2% for b jets and 10% for
mistagged jets [39], as determined in simulated tt events.
• The uncertainty assigned to the number of pileup events in simulation is obtained
by changing the inelastic pp cross section, which is used to estimate the pileup in
data, by±4.6% [43].
• The uncertainty in the integrated luminosity is estimated to be 2.5% [44].
Given that jets produced in tt or tW events, regardless of the jet multiplicity of the event, are ex-pected to belong to the same kinematical regime, JES, b tagging efficiency and misidentification rate are each covered by one single nuisance parameter.
5.2 Modeling uncertainties
It is important for the measurement that the modeling of the tW signal and tt background events is well understood. The impact of the theoretical assumptions in the modeling is deter-mined by building the templates with dedicated simulation samples of tW and tt events. These
samples are produced by varying the parameters from those of the standardPOWHEG+PYTHIA
simulations.
The uncertainty in the modeling of the hard-production process is assessed by changing
inde-pendently µRand µF in thePOWHEG sample by factors of 2 and 0.5 relative to their common
nominal value, which is set inPOWHEGto µR=µF=
√
m2t +p2T,t, where pT,tdenotes the
trans-verse momentum of the top quark in the tt rest frame.
To account for the parton shower (PS) and fragmentation uncertainties, different effects are studied:
• Underlying event: PYTHIA parameters that are tuned to the measurements of the
underlying event [21, 24], to account for non-perturbative QCD effects, are varied up and down within their uncertainties in simulated tt events.
• Matrix element/PS matching: the uncertainty in the combination of the
matrix-element calculation with the parton shower in simulated tt events is estimated from
the variation of thePOWHEG parameter hdamp = 1.58+−0.660.59 mt[24], which regulates
the damping of real emissions in the NLO calculation when matching to the PS [21].
• Initial- (final-) state radiation scale: the PS scale used for the simulation of the
initial-(final-) state radiation is varied up and down by a factor of two. These variations are motivated by the uncertainties in the PS tuning [21].
• Color reconnection: the effect of multiple parton interactions and the
parameteriza-tion of color reconnecparameteriza-tion have been studied in Ref. [24] and are varied accordingly in simulated tt events. In addition, we use a simulation including color reconnection of early resonant decays. The uncertainties that arise from ambiguities in modeling
color-reconnection effects are estimated by comparing the default model inPYTHIA
beyond leading color [45] and a model in which the gluons can be moved to another string [46]. All models are tuned to measurements of the underlying event [21, 24]. The largest variation in each bin with respect to the nominal yield is taken as the systematic uncertainty.
• Semileptonic B hadron decays: the semileptonic B hadron branching fraction is
var-ied depending on the differences between thePYTHIAsemileptonic branching
frac-tions for B0, B+, B0
s andΛband the Particle Data Group values [47].
• B hadron fragmentation: the fragmentation into B hadrons is varied within the
un-certainties of the Bowler–Lund fragmentation function [48] tuned to data measured by the ALEPH [49] and DELPHI [50] Collaborations. In addition, the difference be-tween the Bowler–Lund and Peterson [51] fragmentation functions is included. The largest variation in each bin with respect to the nominal yield is taken as the system-atic uncertainty.
The uncertainty from the choice of PDFs is determined by reweighting the sample of simulated tt events according to the 100 NNPDF3.0 replicas [17]. For each bin, the root-mean-square of the variation in the acceptance for all the PDF sets is taken as an uncertainty. In order not to loose robustness in the fit, a single nuisance parameter is used.
Additionally, the difference between the DS and DR schemes is taken as a source of systematic uncertainty in the signal.
Finally, in order to extract the inclusive cross section from the measurement in the visible phase space, an extrapolation from the visible to the total phase space is needed. This avoids con-straining shape-related systematic uncertainties outside the observable phase space (which en-ter the fit as normalizations). This extrapolation is made by deen-termining the signal acceptance from simulation. The effect of the signal modeling uncertainties in the acceptance is taken into account as an additional source of systematic uncertainty uncorrelated with all the effects described above and added in quadrature to the total uncertainty obtained in the fit.
Measurements of the differential cross section for top quark pair production have shown that
the momentum of the top quark is softer than predicted by thePOWHEGsimulation [52, 53]. The
effect of this mismodelling of the pT spectrum was estimated by reweighting the simulation,
and found to have a negligible effect. The difference in the predictions of the NLO generators
POWHEG and MADGRAPH5 aMC@NLO for tW and tt production, where both usePYTHIAfor
hadronization, fragmentation, and additional radiation description, was estimated and found to be negligible with respect to the modeling uncertainties already assigned.
5.3 Background normalization uncertainties
For tt a normalization uncertainty of 5% is used. This takes into account effects coming from µR
and µFscales, PDFs and αSin the NNLO calculation [29]. For DY and non-W/Z backgrounds,
a normalization uncertainty of±50% is assumed. This value is motivated by the precision of
estimation methods using control regions in data, which are found to be compatible with the predictions from the simulation. For ttV and VV backgrounds, an uncertainty of 50% is also used. This value reflects the uncertainties in the corresponding predicted cross sections but is increased to account for the uncertainties due to the extrapolation of the inclusive cross section into the phase space used in the analysis. The overall uncertainty is not changed significantly by varying this uncertainty.
11
6
Results
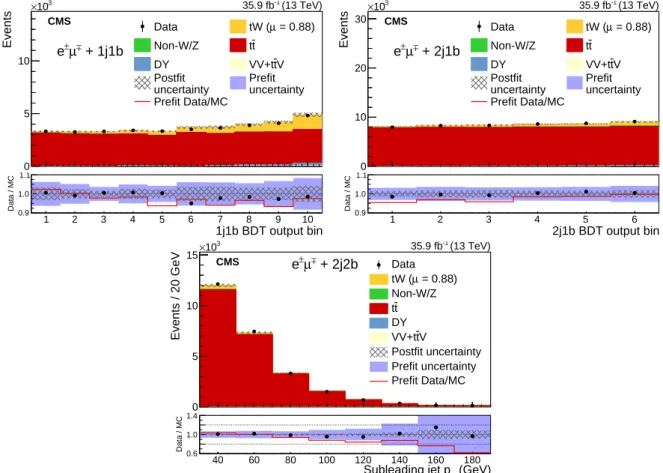
The tW signal-strength parameter that results in the best fit to the data is 0.88±0.02 (stat)±
0.09 (syst)±0.03 (lumi), corresponding to a measured cross section of 63.1±1.8 (stat)±6.4 (syst)±
2.1 (lumi) pb, consistent with the SM expectations.
Comparisons of the final distributions of the BDT discriminants in the 1j1b and 2j1b regions,
as well as the distribution of the subleading jet pT in the 2j2b region for data and simulated
events, are shown in Fig. 5.
Events 0 5 10 3 10 × Data tW (µ = 0.88) Non-W/Z tt DY VV+ttV uncertainty Postfit uncertainty Prefit Prefit Data/MC CMS (13 TeV) -1 35.9 fb + 1j1b ± µ ± * e 1j1b BDT output bin 1 2 3 4 5 6 7 8 9 10 Data / MC0.9 1.0 1.1 Events 0 10 20 30 3 10 × Data tW (µ = 0.88) Non-W/Z tt DY VV+ttV uncertainty Postfit uncertainty Prefit Prefit Data/MC CMS (13 TeV) -1 35.9 fb + 2j1b ± µ ± * e 2j1b BDT output bin 1 2 3 4 5 6 Data / MC0.9 1.0 1.1 Events / 20 GeV 0 5 10 15 3 10 × Data = 0.88) µ tW ( Non-W/Z t t DY V t VV+t Postfit uncertainty Prefit uncertainty Prefit Data/MC CMS (13 TeV) -1 35.9 fb + 2j2b ± µ ± * e (GeV) T Subleading jet p 40 60 80 100 120 140 160 180 Data / MC0.6 1.0 1.4
Figure 5: Comparison of the BDT output in the 1j1b (upper left) and 2j1b (upper right) regions
and the pTof the subleading jet in the 2j2b region (lower) distributions after the fit is performed
for the observed data and simulated events. The error band includes the statistical and system-atic uncertainties. The bottom of each panel shows the ratios of data to the prediction from simulations (line) and from the fit (dots), together with their corresponding uncertainties (solid and hatched band, respectively).
The number of expected events for signal and tt obtained before the fit (prefit) and after the fit (postfit) are shown in Table 1.
Table 1: Number of expected prefit and postfit signal and tt background events.
Prefit Postfit
Region tW tt tW tt
1j1b 6147±442 30622±1862 5440±604 30592±582
2j1b 3125±294 48484±1984 2888±321 47436±612
Several nuisance parameters (JES, tt modeling) are significantly constrained due to their effect on the jet multiplicity and the input distributions used in the fit. The tt normalization is also constrained due to the large presence of tt in the different regions.
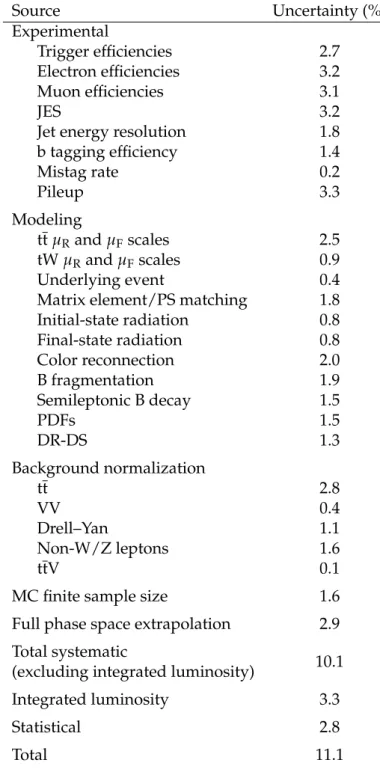
The impact of each source of systematic uncertainty in the fit, shown in Table 2, is evaluated by performing the fit, fixing the rest of the nuisance parameters to their postfit value. We take the difference in quadrature between the uncertainty of the fit with all the nuisance parameters except the one under study fixed to the postfit value, and the uncertainty of the fit with all the nuisances fixed to the postfit value. The uncertainties in the luminosity and in the trigger and lepton efficiencies lead to uncertainties in the background, which is dominant in all bins of the fit. Therefore, these uncertainties make a sizable contribution to the uncertainty in the final measurement.
7
Summary
The data recorded by CMS at 13 TeV, corresponding to an integrated luminosity of 35.9±
0.9 fb−1, are used to measure the tW production cross section in the e±
µ∓channel, classifying
the events in terms of the number of jets and jets originating from bottom quarks. The signal is measured using a maximum likelihood fit to the distribution of boosted decision tree
discrim-inants in two of the categories, and to the pTdistribution of the second jet with highest pT in a
third category. The measured cross section for tW production is found to be 63.1±1.8 (stat)±
6.4 (syst)±2.1 (lumi) pb, achieving a relative uncertainty of 11%. This is the first measurement
of this process by the CMS Collaboration at √s = 13 TeV. The measured cross section is in
agreement with the standard model prediction of σref
tW = 71.7±1.8 (scale)±3.4 (PDF) pb and
with a similar measurement by the ATLAS Collaboration [13].
Acknowledgments
We congratulate our colleagues in the CERN accelerator departments for the excellent perfor-mance of the LHC and thank the technical and administrative staffs at CERN and at other CMS institutes for their contributions to the success of the CMS effort. In addition, we grate-fully acknowledge the computing centres and personnel of the Worldwide LHC Computing Grid for delivering so effectively the computing infrastructure essential to our analyses. Fi-nally, we acknowledge the enduring support for the construction and operation of the LHC and the CMS detector provided by the following funding agencies: the Austrian Federal Min-istry of Science, Research and Economy and the Austrian Science Fund; the Belgian Fonds de la Recherche Scientifique, and Fonds voor Wetenschappelijk Onderzoek; the Brazilian Fund-ing Agencies (CNPq, CAPES, FAPERJ, and FAPESP); the Bulgarian Ministry of Education and Science; CERN; the Chinese Academy of Sciences, Ministry of Science and Technology, and Na-tional Natural Science Foundation of China; the Colombian Funding Agency (COLCIENCIAS); the Croatian Ministry of Science, Education and Sport, and the Croatian Science Foundation; the Research Promotion Foundation, Cyprus; the Secretariat for Higher Education, Science, Technology and Innovation, Ecuador; the Ministry of Education and Research, Estonian Re-search Council via IUT23-4 and IUT23-6 and European Regional Development Fund, Estonia; the Academy of Finland, Finnish Ministry of Education and Culture, and Helsinki Institute of Physics; the Institut National de Physique Nucl´eaire et de Physique des Particules / CNRS, and Commissariat `a l’ ´Energie Atomique et aux ´Energies Alternatives / CEA, France; the Bundes-ministerium f ¨ur Bildung und Forschung, Deutsche Forschungsgemeinschaft, and Helmholtz-Gemeinschaft Deutscher Forschungszentren, Germany; the General Secretariat for Research
13
Table 2: Estimation of the effect on the signal strength of each source of uncertainty in the fit. Experimental and modeling uncertainties affect both the rate and the shape of the templates while background normalization uncertainties affect only the rate.
Source Uncertainty (%) Experimental Trigger efficiencies 2.7 Electron efficiencies 3.2 Muon efficiencies 3.1 JES 3.2
Jet energy resolution 1.8
b tagging efficiency 1.4 Mistag rate 0.2 Pileup 3.3 Modeling tt µRand µFscales 2.5 tW µRand µFscales 0.9 Underlying event 0.4
Matrix element/PS matching 1.8
Initial-state radiation 0.8 Final-state radiation 0.8 Color reconnection 2.0 B fragmentation 1.9 Semileptonic B decay 1.5 PDFs 1.5 DR-DS 1.3 Background normalization tt 2.8 VV 0.4 Drell–Yan 1.1 Non-W/Z leptons 1.6 ttV 0.1
MC finite sample size 1.6
Full phase space extrapolation 2.9
Total systematic 10.1
(excluding integrated luminosity)
Integrated luminosity 3.3
Statistical 2.8
and Technology, Greece; the National Scientific Research Foundation, and National Innova-tion Office, Hungary; the Department of Atomic Energy and the Department of Science and Technology, India; the Institute for Studies in Theoretical Physics and Mathematics, Iran; the Science Foundation, Ireland; the Istituto Nazionale di Fisica Nucleare, Italy; the Ministry of Science, ICT and Future Planning, and National Research Foundation (NRF), Republic of Ko-rea; the Lithuanian Academy of Sciences; the Ministry of Education, and University of Malaya (Malaysia); the Mexican Funding Agencies (BUAP, CINVESTAV, CONACYT, LNS, SEP, and UASLP-FAI); the Ministry of Business, Innovation and Employment, New Zealand; the Pak-istan Atomic Energy Commission; the Ministry of Science and Higher Education and the Na-tional Science Centre, Poland; the Fundac¸˜ao para a Ciˆencia e a Tecnologia, Portugal; JINR, Dubna; the Ministry of Education and Science of the Russian Federation, the Federal Agency of Atomic Energy of the Russian Federation, Russian Academy of Sciences, the Russian Foun-dation for Basic Research and the Russian Competitiveness Program of NRNU “MEPhI”; the Ministry of Education, Science and Technological Development of Serbia; the Secretar´ıa de Es-tado de Investigaci´on, Desarrollo e Innovaci´on, Programa Consolider-Ingenio 2010, Plan de Ciencia, Tecnolog´ıa e Innovaci´on 2013-2017 del Principado de Asturias and Fondo Europeo de Desarrollo Regional, Spain; the Swiss Funding Agencies (ETH Board, ETH Zurich, PSI, SNF, UniZH, Canton Zurich, and SER); the Ministry of Science and Technology, Taipei; the Thailand Center of Excellence in Physics, the Institute for the Promotion of Teaching Science and Tech-nology of Thailand, Special Task Force for Activating Research and the National Science and Technology Development Agency of Thailand; the Scientific and Technical Research Council of Turkey, and Turkish Atomic Energy Authority; the National Academy of Sciences of Ukraine, and State Fund for Fundamental Researches, Ukraine; the Science and Technology Facilities Council, UK; the US Department of Energy, and the US National Science Foundation.
Individuals have received support from the Marie-Curie programme and the European Re-search Council and Horizon 2020 Grant, contract No. 675440 (European Union); the Leventis Foundation; the A. P. Sloan Foundation; the Alexander von Humboldt Foundation; the Belgian Federal Science Policy Office; the Fonds pour la Formation `a la Recherche dans l’Industrie et dans l’Agriculture (FRIA-Belgium); the Agentschap voor Innovatie door Wetenschap en Tech-nologie (IWT-Belgium); the Ministry of Education, Youth and Sports (MEYS) of the Czech Republic; the Council of Scientific and Industrial Research, India; the HOMING PLUS pro-gramme of the Foundation for Polish Science, cofinanced from European Union, Regional Development Fund, the Mobility Plus programme of the Ministry of Science and Higher Ed-ucation, the National Science Center (Poland), contracts Harmonia 2014/14/M/ST2/00428, Opus 2014/13/B/ST2/02543, 2014/15/B/ST2/03998, and 2015/19/B/ST2/02861, Sonata-bis 2012/07/E/ST2/01406; the National Priorities Research Program by Qatar National Research Fund; the Programa Severo Ochoa del Principado de Asturias; the Thalis and Aristeia pro-grammes cofinanced by EU-ESF and the Greek NSRF; the Rachadapisek Sompot Fund for Post-doctoral Fellowship, Chulalongkorn University and the Chulalongkorn Academic into Its 2nd Century Project Advancement Project (Thailand); the Welch Foundation, contract C-1845; and the Weston Havens Foundation (USA).
References
[1] D0 Collaboration, “Observation of single top quark production”, Phys. Rev. Lett. 103 (2009) 092001, doi:10.1103/PhysRevLett.103.092001, arXiv:0903.0850. [2] CDF Collaboration, “First observation of electroweak single top quark production”,
References 15
arXiv:0903.0885.
[3] S. Frixione et al., “Single-top hadroproduction in association with a W boson”, JHEP 07 (2008) 029, doi:10.1088/1126-6708/2008/07/029, arXiv:0805.3067.
[4] A. S. Belyaev, E. E. Boos, and L. V. Dudko, “Single top quark at future hadron colliders: Complete signal and background study”, Phys. Rev. D 59 (1999) 075001,
doi:10.1103/PhysRevD.59.075001, arXiv:hep-ph/9806332.
[5] C. D. White, S. Frixione, E. Laenen, and F. Maltoni, “Isolating Wt production at the LHC”,
JHEP 11(2009) 074, doi:10.1088/1126-6708/2009/11/074, arXiv:0908.0631.
[6] T. M. P. Tait and C. P. Yuan, “Single top quark production as a window to physics beyond the standard model”, Phys. Rev. D 63 (2000) 014018,
doi:10.1103/PhysRevD.63.014018, arXiv:hep-ph/0007298.
[7] Q.-H. Cao, J. Wudka, and C. P. Yuan, “Search for new physics via single top production at the LHC”, Phys. Lett. B 658 (2007) 50, doi:10.1016/j.physletb.2007.10.057, arXiv:0704.2809.
[8] V. Barger, M. McCaskey, and G. Shaughnessy, “Single top and Higgs associated production at the LHC”, Phys. Rev. D 81 (2010) 034020,
doi:10.1103/PhysRevD.81.034020, arXiv:0911.1556.
[9] CMS Collaboration, “Evidence for associated production of a single top quark and W
boson in pp collisions at√s= 7 TeV”, Phys. Rev. Lett. 110 (2013) 022003,
doi:10.1103/PhysRevLett.110.022003, arXiv:1209.3489.
[10] ATLAS Collaboration, “Evidence for the associated production of a W boson and a top
quark in ATLAS at√s=7 TeV”, Phys. Lett. B 716 (2012) 142,
doi:10.1016/j.physletb.2012.08.011, arXiv:1205.5764.
[11] CMS Collaboration, “Observation of the associated production of a single top quark and
a W boson in pp collisions at√s = 8 TeV”, Phys. Rev. Lett. 112 (2014) 231802,
doi:10.1103/PhysRevLett.112.231802, arXiv:1401.2942.
[12] ATLAS Collaboration, “Measurement of the production cross-section of a single top quark in association with a W boson at 8 TeV with the ATLAS experiment”, JHEP 01 (2016) 064, doi:10.1007/JHEP01(2016)064, arXiv:1510.03752.
[13] ATLAS Collaboration, “Measurement of the cross-section for producing a W boson in
association with a single top quark in pp collisions at√s =13 TeV with ATLAS”, JHEP
01(2018) 063, doi:10.1007/JHEP01(2018)063, arXiv:1612.07231.
[14] N. Kidonakis, “Theoretical results for electroweak-boson and single-top production”, in Proceedings, 23rd International Workshop on Deep-Inelastic Scattering and Related Subjects (DIS 2015): Dallas, Texas, USA, April 27-May 01, 2015, volume DIS2015, p. 170. 2015.
arXiv:1506.04072.
[15] CMS Collaboration, “The CMS experiment at the CERN LHC”, JINST 3 (2008) S08004,
doi:10.1088/1748-0221/3/08/S08004.
[16] E. Re, “Single-top Wt-channel production matched with parton showers using the POWHEG method”, Eur. Phys. J. C 71 (2011) 1547,
[17] NNPDF Collaboration, “Parton distributions for the LHC Run II”, JHEP 04 (2015) 040, doi:10.1007/JHEP04(2015)040, arXiv:1410.8849.
[18] T. Sj¨ostrand, S. Mrenna, and P. Skands, “PYTHIA 6.4 physics and manual”, JHEP 05 (2006) 026, doi:10.1088/1126-6708/2006/05/026, arXiv:hep-ph/0603175. [19] T. Sj¨ostrand et al., “An introduction to PYTHIA 8.2”, Comput. Phys. Commun. 191 (2015)
159, doi:10.1016/j.cpc.2015.01.024, arXiv:1410.3012.
[20] CMS Collaboration, “Event generator tunes obtained from underlying event and multiparton scattering measurements”, Eur. Phys. J. C 76 (2016) 155,
doi:10.1140/epjc/s10052-016-3988-x, arXiv:1512.00815.
[21] P. Skands, S. Carrazza, and J. Rojo, “Tuning PYTHIA 8.1: the Monash 2013 Tune”, Eur.
Phys. J. C 74(2014) 3024, doi:10.1140/epjc/s10052-014-3024-y,
arXiv:1404.5630.
[22] T. M. P. Tait, “tW−mode of single top quark production”, Phys. Rev. D 61 (1999) 034001,
doi:10.1103/PhysRevD.61.034001.
[23] S. Alioli, P. Nason, C. Oleari, and E. Re, “A general framework for implementing NLO calculations in shower Monte Carlo programs: the POWHEG BOX”, JHEP 06 (2010) 043,
doi:10.1007/JHEP06(2010)043, arXiv:1002.2581.
[24] CMS Collaboration, “Investigations of the impact of the parton shower tuning in Pythia 8
in the modelling of tt at√s =8 and 13 TeV”, CMS Physics Analysis Summary
CMS-PAS-TOP-16-021, CERN, 2016.
[25] J. Alwall et al., “The automated computation of tree-level and next-to-leading order differential cross sections, and their matching to parton shower simulations”, JHEP 07 (2014) 079, doi:10.1007/JHEP07(2014)079, arXiv:1405.0301.
[26] R. Frederix and S. Frixione, “Merging meets matching in MC@NLO”, JHEP 12 (2012) 061, doi:10.1007/JHEP12(2012)061, arXiv:1209.6215.
[27] Y. Li and F. Petriello, “Combining QCD and electroweak corrections to dilepton production in the framework of the FEWZ simulation code”, Phys. Rev. D 86 (2012) 094034, doi:10.1103/PhysRevD.86.094034, arXiv:1208.5967.
[28] J. M. Campbell, R. K. Ellis, and C. Williams, “Vector boson pair production at the LHC”,
JHEP 07(2011) 018, doi:10.1007/JHEP07(2011)018, arXiv:1105.0020.
[29] M. Czakon, P. Fiedler, and A. Mitov, “Total top-quark pair-production cross section at
hadron colliders through o(α4
s)”, Phys. Rev. Lett. 110 (2013) 252004,
doi:10.1103/PhysRevLett.110.252004, arXiv:1303.6254.
[30] M. Czakon and A. Mitov, “Top++: A program for the calculation of the top-pair cross-section at hadron colliders”, Comput. Phys. Commun. 185 (2014) 2930, doi:10.1016/j.cpc.2014.06.021, arXiv:1112.5675.
[31] CMS Collaboration, “Measurement of the t¯t production cross section using events in the
eµ final state in pp collisions at√s=13 TeV”, Eur. Phys. J. C 77 (2017) 172,
References 17
[32] CMS Collaboration, “Particle-flow reconstruction and global event description with the CMS detector”, JINST 12 (2017) P10003, doi:10.1088/1748-0221/12/10/P10003,
arXiv:1706.04965.
[33] CMS Collaboration, “Performance of electron reconstruction and selection with the CMS
detector in proton-proton collisions at√s=8 TeV”, JINST 10 (2015) P06005,
doi:10.1088/1748-0221/10/06/P06005, arXiv:1502.02701.
[34] CMS Collaboration, “Performance of CMS muon reconstruction in pp collision events at√
s =7 TeV”, JINST 7 (2012) P10002, doi:10.1088/1748-0221/7/10/P10002,
arXiv:1206.4071.
[35] M. Cacciari, G. P. Salam, and G. Soyez, “The anti-kTjet clustering algorithm”, JHEP 04
(2008) 063, doi:10.1088/1126-6708/2008/04/063, arXiv:0802.1189.
[36] M. Cacciari, G. P. Salam, and G. Soyez, “FastJet user manual”, Eur. Phys. J. C 72 (2012) 1896, doi:10.1140/epjc/s10052-012-1896-2, arXiv:1111.6097.
[37] CMS Collaboration, “Jet algorithms performance in 13 TeV data”, CMS Physics Analysis Summary CMS-PAS-JME-16-003, CERN, 2017.
[38] CMS Collaboration, “Performance of missing energy reconstruction in√s =13 TeV pp
collision data using the CMS detector”, CMS Physics Analysis Summary CMS-PAS-JME-16-004, CERN, 2016.
[39] CMS Collaboration, “Identification of heavy-flavour jets with the CMS detector in pp collisions at 13 TeV”, JINST 13 (2018) P05011,
doi:10.1088/1748-0221/13/05/P05011, arXiv:1712.07158.
[40] J. Therhaag et al., “TMVA — Toolkit for multivariate data analysis”, in Proceedings, Int’l Conf. on Computational Methods in Science and Engineering, 2009, ICCMSE2009, volume 1504, p. 1013. 2012. doi:10.1063/1.4771869.
[41] H.-J. Yang, B. P. Roe, and J. Zhu, “Studies of boosted decision trees for MiniBooNE particle identification”, Nucl. Instrum. Meth. A 555 (2005) 370,
doi:10.1016/j.nima.2005.09.022, arXiv:physics/0508045.
[42] CMS Collaboration, “Precise determination of the mass of the Higgs boson and tests of compatibility of its couplings with the standard model predictions using proton
collisions at 7 and 8 TeV”, Eur. Phys. J. C 75 (2015) 212,
doi:10.1140/epjc/s10052-015-3351-7, arXiv:1412.8662.
[43] ATLAS Collaboration, “Measurement of the inelastic proton-proton cross section at√
s =13 TeV with the ATLAS detector at the LHC”, Phys. Rev. Lett. 117 (2016) 182002,
doi:10.1103/PhysRevLett.117.182002, arXiv:1606.02625.
[44] CMS Collaboration, “CMS luminosity measurements for the 2016 data taking period”, CMS Physics Analysis Summary CMS-PAS-LUM-17-001, CERN, 2017.
[45] J. R. Christiansen and P. Z. Skands, “String formation beyond leading colour”, JHEP 08 (2015) 003, doi:10.1007/JHEP08(2015)003, arXiv:1505.01681.
[46] S. Argyropoulos and T. Sj¨ostrand, “Effects of color reconnection on t¯t final states at the LHC”, JHEP 11 (2014) 043, doi:10.1007/JHEP11(2014)043, arXiv:1407.6653.
[47] Particle Data Group, C. Patrignani et al., “Review of particle physics”, Chin. Phys. C 40 (2016) 100001, doi:10.1088/1674-1137/40/10/100001.
[48] M. G. Bowler, “e+e−production of heavy quarks in the string model”, Z. Phys. C 11
(1981) 169, doi:10.1007/BF01574001.
[49] ALEPH Collaboration, “Study of the fragmentation of b quarks into B mesons at the Z peak”, Phys. Lett. B 512 (2001) 30, doi:10.1016/S0370-2693(01)00690-6,
arXiv:hep-ex/0106051.
[50] DELPHI Collaboration, “A study of the b-quark fragmentation function with the DELPHI detector at LEP I and an averaged distribution obtained at the Z Pole”, Eur. Phys. J. C 71 (2011) 1557, doi:10.1140/epjc/s10052-011-1557-x, arXiv:1102.4748.
[51] C. Peterson, D. Schlatter, I. Schmitt, and P. M. Zerwas, “Scaling violations in inclusive
e+e−annihilation spectra”, Phys. Rev. D 27 (1983) 105,
doi:10.1103/PhysRevD.27.105.
[52] CMS Collaboration, “Measurement of normalized differential tt cross sections in the
dilepton channel from pp collisions at√s= 13 TeV”, JHEP 04 (2018) 060,
doi:10.1007/JHEP04(2018)060, arXiv:1708.07638.
[53] CMS Collaboration, “Measurement of differential cross sections for top quark pair production using the lepton+jets final state in proton-proton collisions at 13 TeV”, Phys.
19
A
The CMS Collaboration
Yerevan Physics Institute, Yerevan, Armenia
A.M. Sirunyan, A. Tumasyan
Institut f ¨ur Hochenergiephysik, Wien, Austria
W. Adam, F. Ambrogi, E. Asilar, T. Bergauer, J. Brandstetter, E. Brondolin, M. Dragicevic, J. Er¨o,
A. Escalante Del Valle, M. Flechl, M. Friedl, V.M. Ghete, J. Hrubec, M. Jeitler1, N. Krammer,
I. Kr¨atschmer, D. Liko, T. Madlener, I. Mikulec, N. Rad, H. Rohringer, J. Schieck1, R. Sch¨ofbeck,
M. Spanring, D. Spitzbart, A. Taurok, W. Waltenberger, J. Wittmann, C.-E. Wulz1, M. Zarucki
Institute for Nuclear Problems, Minsk, Belarus
V. Chekhovsky, V. Mossolov, J. Suarez Gonzalez
Universiteit Antwerpen, Antwerpen, Belgium
E.A. De Wolf, D. Di Croce, X. Janssen, J. Lauwers, M. Pieters, M. Van De Klundert, H. Van Haevermaet, P. Van Mechelen, N. Van Remortel
Vrije Universiteit Brussel, Brussel, Belgium
S. Abu Zeid, F. Blekman, J. D’Hondt, I. De Bruyn, J. De Clercq, K. Deroover, G. Flouris, D. Lontkovskyi, S. Lowette, I. Marchesini, S. Moortgat, L. Moreels, Q. Python, K. Skovpen, S. Tavernier, W. Van Doninck, P. Van Mulders, I. Van Parijs
Universit´e Libre de Bruxelles, Bruxelles, Belgium
D. Beghin, B. Bilin, H. Brun, B. Clerbaux, G. De Lentdecker, H. Delannoy, B. Dorney, G. Fasanella, L. Favart, R. Goldouzian, A. Grebenyuk, A.K. Kalsi, T. Lenzi, J. Luetic, T. Seva, E. Starling, C. Vander Velde, P. Vanlaer, D. Vannerom
Ghent University, Ghent, Belgium
T. Cornelis, D. Dobur, A. Fagot, M. Gul, I. Khvastunov2, D. Poyraz, C. Roskas, D. Trocino,
M. Tytgat, W. Verbeke, B. Vermassen, M. Vit, N. Zaganidis
Universit´e Catholique de Louvain, Louvain-la-Neuve, Belgium
H. Bakhshiansohi, O. Bondu, S. Brochet, G. Bruno, C. Caputo, P. David, C. Delaere, M. Delcourt, B. Francois, A. Giammanco, G. Krintiras, V. Lemaitre, A. Magitteri, A. Mertens, M. Musich, K. Piotrzkowski, A. Saggio, M. Vidal Marono, S. Wertz, J. Zobec
Centro Brasileiro de Pesquisas Fisicas, Rio de Janeiro, Brazil
W.L. Ald´a J ´unior, F.L. Alves, G.A. Alves, L. Brito, G. Correia Silva, C. Hensel, A. Moraes, M.E. Pol, P. Rebello Teles
Universidade do Estado do Rio de Janeiro, Rio de Janeiro, Brazil
E. Belchior Batista Das Chagas, W. Carvalho, J. Chinellato3, E. Coelho, E.M. Da Costa,
G.G. Da Silveira4, D. De Jesus Damiao, S. Fonseca De Souza, H. Malbouisson, M.
Med-ina Jaime5, M. Melo De Almeida, C. Mora Herrera, L. Mundim, H. Nogima, L.J. Sanchez Rosas,
A. Santoro, A. Sznajder, M. Thiel, E.J. Tonelli Manganote3, F. Torres Da Silva De Araujo,
A. Vilela Pereira
Universidade Estadual Paulistaa, Universidade Federal do ABCb, S˜ao Paulo, Brazil
S. Ahujaa, C.A. Bernardesa, L. Calligarisa, T.R. Fernandez Perez Tomeia, E.M. Gregoresb,
P.G. Mercadanteb, S.F. Novaesa, SandraS. Padulaa, D. Romero Abadb, J.C. Ruiz Vargasa
Bulgaria
A. Aleksandrov, R. Hadjiiska, P. Iaydjiev, A. Marinov, M. Misheva, M. Rodozov, M. Shopova, G. Sultanov
University of Sofia, Sofia, Bulgaria
A. Dimitrov, L. Litov, B. Pavlov, P. Petkov
Beihang University, Beijing, China
W. Fang6, X. Gao6, L. Yuan
Institute of High Energy Physics, Beijing, China
M. Ahmad, J.G. Bian, G.M. Chen, H.S. Chen, M. Chen, Y. Chen, C.H. Jiang, D. Leggat, H. Liao, Z. Liu, F. Romeo, S.M. Shaheen, A. Spiezia, J. Tao, C. Wang, Z. Wang, E. Yazgan, H. Zhang, J. Zhao
State Key Laboratory of Nuclear Physics and Technology, Peking University, Beijing, China
Y. Ban, G. Chen, J. Li, Q. Li, S. Liu, Y. Mao, S.J. Qian, D. Wang, Z. Xu
Tsinghua University, Beijing, China
Y. Wang
Universidad de Los Andes, Bogota, Colombia
C. Avila, A. Cabrera, C.A. Carrillo Montoya, L.F. Chaparro Sierra, C. Florez, C.F. Gonz´alez Hern´andez, M.A. Segura Delgado
University of Split, Faculty of Electrical Engineering, Mechanical Engineering and Naval Architecture, Split, Croatia
B. Courbon, N. Godinovic, D. Lelas, I. Puljak, T. Sculac
University of Split, Faculty of Science, Split, Croatia
Z. Antunovic, M. Kovac
Institute Rudjer Boskovic, Zagreb, Croatia
V. Brigljevic, D. Ferencek, K. Kadija, B. Mesic, A. Starodumov7, T. Susa
University of Cyprus, Nicosia, Cyprus
M.W. Ather, A. Attikis, G. Mavromanolakis, J. Mousa, C. Nicolaou, F. Ptochos, P.A. Razis, H. Rykaczewski
Charles University, Prague, Czech Republic
M. Finger8, M. Finger Jr.8
Universidad San Francisco de Quito, Quito, Ecuador
E. Carrera Jarrin
Academy of Scientific Research and Technology of the Arab Republic of Egypt, Egyptian Network of High Energy Physics, Cairo, Egypt
S. Elgammal9, A. Mohamed10, E. Salama9,11
National Institute of Chemical Physics and Biophysics, Tallinn, Estonia
S. Bhowmik, A. Carvalho Antunes De Oliveira, R.K. Dewanjee, M. Kadastik, L. Perrini, M. Raidal, C. Veelken
Department of Physics, University of Helsinki, Helsinki, Finland
21
Helsinki Institute of Physics, Helsinki, Finland
J. Havukainen, J.K. Heikkil¨a, T. J¨arvinen, V. Karim¨aki, R. Kinnunen, T. Lamp´en, K. Lassila-Perini, S. Laurila, S. Lehti, T. Lind´en, P. Luukka, T. M¨aenp¨a¨a, H. Siikonen, E. Tuominen, J. Tuominiemi
Lappeenranta University of Technology, Lappeenranta, Finland
T. Tuuva
IRFU, CEA, Universit´e Paris-Saclay, Gif-sur-Yvette, France
M. Besancon, F. Couderc, M. Dejardin, D. Denegri, J.L. Faure, F. Ferri, S. Ganjour, A. Givernaud, P. Gras, G. Hamel de Monchenault, P. Jarry, C. Leloup, E. Locci, M. Machet, J. Malcles, G. Negro, J. Rander, A. Rosowsky, M. ¨O. Sahin, M. Titov
Laboratoire Leprince-Ringuet, Ecole polytechnique, CNRS/IN2P3, Universit´e Paris-Saclay, Palaiseau, France
A. Abdulsalam12, C. Amendola, I. Antropov, S. Baffioni, F. Beaudette, P. Busson, L. Cadamuro,
C. Charlot, R. Granier de Cassagnac, M. Jo, I. Kucher, S. Lisniak, A. Lobanov, J. Martin Blanco, M. Nguyen, C. Ochando, G. Ortona, P. Paganini, P. Pigard, R. Salerno, J.B. Sauvan, Y. Sirois, A.G. Stahl Leiton, Y. Yilmaz, A. Zabi, A. Zghiche
Universit´e de Strasbourg, CNRS, IPHC UMR 7178, F-67000 Strasbourg, France
J.-L. Agram13, J. Andrea, D. Bloch, J.-M. Brom, E.C. Chabert, C. Collard, E. Conte13,
F. Drouhin13, J.-C. Fontaine13, D. Gel´e, U. Goerlach, M. Jansov´a, P. Juillot, A.-C. Le Bihan,
N. Tonon, P. Van Hove
Centre de Calcul de l’Institut National de Physique Nucleaire et de Physique des Particules, CNRS/IN2P3, Villeurbanne, France
S. Gadrat
Universit´e de Lyon, Universit´e Claude Bernard Lyon 1, CNRS-IN2P3, Institut de Physique Nucl´eaire de Lyon, Villeurbanne, France
S. Beauceron, C. Bernet, G. Boudoul, N. Chanon, R. Chierici, D. Contardo, P. Depasse, H. El Mamouni, J. Fay, L. Finco, S. Gascon, M. Gouzevitch, G. Grenier, B. Ille, F. Lagarde,
I.B. Laktineh, H. Lattaud, M. Lethuillier, L. Mirabito, A.L. Pequegnot, S. Perries, A. Popov14,
V. Sordini, M. Vander Donckt, S. Viret, S. Zhang
Georgian Technical University, Tbilisi, Georgia
A. Khvedelidze8
Tbilisi State University, Tbilisi, Georgia
Z. Tsamalaidze8
RWTH Aachen University, I. Physikalisches Institut, Aachen, Germany
C. Autermann, L. Feld, M.K. Kiesel, K. Klein, M. Lipinski, M. Preuten, M.P. Rauch,
C. Schomakers, J. Schulz, M. Teroerde, B. Wittmer, V. Zhukov14
RWTH Aachen University, III. Physikalisches Institut A, Aachen, Germany
A. Albert, D. Duchardt, M. Endres, M. Erdmann, S. Erdweg, T. Esch, R. Fischer, S. Ghosh, A. G ¨uth, T. Hebbeker, C. Heidemann, K. Hoepfner, S. Knutzen, L. Mastrolorenzo, M. Merschmeyer, A. Meyer, P. Millet, S. Mukherjee, T. Pook, M. Radziej, H. Reithler, M. Rieger, F. Scheuch, A. Schmidt, D. Teyssier, S. Th ¨uer
RWTH Aachen University, III. Physikalisches Institut B, Aachen, Germany
G. Fl ¨ugge, O. Hlushchenko, B. Kargoll, T. Kress, A. K ¨unsken, T. M ¨uller, A. Nehrkorn,
Deutsches Elektronen-Synchrotron, Hamburg, Germany
M. Aldaya Martin, T. Arndt, C. Asawatangtrakuldee, I. Babounikau, K. Beernaert, O. Behnke,
U. Behrens, A. Berm ´udez Mart´ınez, D. Bertsche, A.A. Bin Anuar, K. Borras16, V. Botta,
A. Campbell, P. Connor, C. Contreras-Campana, F. Costanza, V. Danilov, A. De Wit, M.M. Defranchis, C. Diez Pardos, D. Dom´ınguez Damiani, G. Eckerlin, D. Eckstein, T. Eichhorn,
A. Elwood, E. Eren, E. Gallo17, A. Geiser, J.M. Grados Luyando, A. Grohsjean, P. Gunnellini,
M. Guthoff, A. Harb, J. Hauk, H. Jung, M. Kasemann, J. Keaveney, C. Kleinwort, J. Knolle,
D. Kr ¨ucker, W. Lange, A. Lelek, T. Lenz, K. Lipka, W. Lohmann18, R. Mankel, I.-A.
Melzer-Pellmann, A.B. Meyer, M. Meyer, M. Missiroli, G. Mittag, J. Mnich, A. Mussgiller, S.K. Pflitsch, D. Pitzl, A. Raspereza, M. Savitskyi, P. Saxena, P. Sch ¨utze, C. Schwanenberger, R. Shevchenko, A. Singh, N. Stefaniuk, H. Tholen, A. Vagnerini, G.P. Van Onsem, R. Walsh, Y. Wen, K. Wichmann, C. Wissing, O. Zenaiev
University of Hamburg, Hamburg, Germany
R. Aggleton, S. Bein, A. Benecke, V. Blobel, M. Centis Vignali, T. Dreyer, E. Garutti, D. Gonzalez, J. Haller, A. Hinzmann, M. Hoffmann, A. Karavdina, G. Kasieczka, R. Klanner, R. Kogler, N. Kovalchuk, S. Kurz, V. Kutzner, J. Lange, D. Marconi, J. Multhaup, M. Niedziela, D. Nowatschin, T. Peiffer, A. Perieanu, A. Reimers, O. Rieger, C. Scharf, P. Schleper, S. Schumann, J. Schwandt, J. Sonneveld, H. Stadie, G. Steinbr ¨uck, F.M. Stober, M. St¨over, D. Troendle, E. Usai, A. Vanhoefer, B. Vormwald
Institut f ¨ur Experimentelle Teilchenphysik, Karlsruhe, Germany
M. Akbiyik, C. Barth, M. Baselga, S. Baur, E. Butz, R. Caspart, T. Chwalek, F. Colombo, W. De Boer, A. Dierlamm, N. Faltermann, B. Freund, R. Friese, M. Giffels, M.A. Harrendorf,
F. Hartmann15, S.M. Heindl, U. Husemann, F. Kassel15, S. Kudella, H. Mildner, M.U. Mozer,
Th. M ¨uller, M. Plagge, G. Quast, K. Rabbertz, M. Schr¨oder, I. Shvetsov, G. Sieber, H.J. Simonis, R. Ulrich, S. Wayand, M. Weber, T. Weiler, S. Williamson, C. W¨ohrmann, R. Wolf
Institute of Nuclear and Particle Physics (INPP), NCSR Demokritos, Aghia Paraskevi, Greece
G. Anagnostou, G. Daskalakis, T. Geralis, A. Kyriakis, D. Loukas, G. Paspalaki, I. Topsis-Giotis
National and Kapodistrian University of Athens, Athens, Greece
G. Karathanasis, S. Kesisoglou, A. Panagiotou, N. Saoulidou, E. Tziaferi, K. Vellidis
National Technical University of Athens, Athens, Greece
K. Kousouris, I. Papakrivopoulos
University of Io´annina, Io´annina, Greece
I. Evangelou, C. Foudas, P. Gianneios, P. Katsoulis, P. Kokkas, S. Mallios, N. Manthos, I. Papadopoulos, E. Paradas, J. Strologas, F.A. Triantis, D. Tsitsonis
MTA-ELTE Lend ¨ulet CMS Particle and Nuclear Physics Group, E ¨otv ¨os Lor´and University, Budapest, Hungary
M. Csanad, N. Filipovic, G. Pasztor, O. Sur´anyi, G.I. Veres
Wigner Research Centre for Physics, Budapest, Hungary
G. Bencze, C. Hajdu, D. Horvath19, ´A. Hunyadi, F. Sikler, T. ´A. V´ami, V. Veszpremi,
G. Vesztergombi†
Institute of Nuclear Research ATOMKI, Debrecen, Hungary
23
Institute of Physics, University of Debrecen, Debrecen, Hungary
M. Bart´ok20, P. Raics, Z.L. Trocsanyi, B. Ujvari
Indian Institute of Science (IISc), Bangalore, India
S. Choudhury, J.R. Komaragiri
National Institute of Science Education and Research, HBNI, Bhubaneswar, India
S. Bahinipati22, P. Mal, K. Mandal, A. Nayak23, D.K. Sahoo22, S.K. Swain
Panjab University, Chandigarh, India
S. Bansal, S.B. Beri, V. Bhatnagar, S. Chauhan, R. Chawla, N. Dhingra, R. Gupta, A. Kaur, M. Kaur, S. Kaur, R. Kumar, P. Kumari, M. Lohan, A. Mehta, S. Sharma, J.B. Singh, G. Walia
University of Delhi, Delhi, India
A. Bhardwaj, B.C. Choudhary, R.B. Garg, S. Keshri, A. Kumar, Ashok Kumar, S. Malhotra, M. Naimuddin, P. Priyanka, K. Ranjan, Aashaq Shah, R. Sharma
Saha Institute of Nuclear Physics, HBNI, Kolkata, India
R. Bhardwaj24, M. Bharti, R. Bhattacharya, S. Bhattacharya, U. Bhawandeep24, D. Bhowmik,
S. Dey, S. Dutt24, S. Dutta, S. Ghosh, N. Majumdar, K. Mondal, S. Mukhopadhyay, S. Nandan,
A. Purohit, P.K. Rout, A. Roy, S. Roy Chowdhury, S. Sarkar, M. Sharan, B. Singh, S. Thakur24
Indian Institute of Technology Madras, Madras, India
P.K. Behera
Bhabha Atomic Research Centre, Mumbai, India
R. Chudasama, D. Dutta, V. Jha, V. Kumar, A.K. Mohanty15, P.K. Netrakanti, L.M. Pant,
P. Shukla, A. Topkar
Tata Institute of Fundamental Research-A, Mumbai, India
T. Aziz, M.A. Bhat, S. Dugad, B. Mahakud, S. Mitra, G.B. Mohanty, R. Ravindra Kumar Verma, N. Sur, B. Sutar
Tata Institute of Fundamental Research-B, Mumbai, India
S. Banerjee, S. Bhattacharya, S. Chatterjee, P. Das, M. Guchait, Sa. Jain, S. Kumar, M. Maity25,
G. Majumder, K. Mazumdar, N. Sahoo, T. Sarkar25, N. Wickramage26
Indian Institute of Science Education and Research (IISER), Pune, India
S. Chauhan, S. Dube, V. Hegde, A. Kapoor, K. Kothekar, S. Pandey, A. Rane, S. Sharma
Institute for Research in Fundamental Sciences (IPM), Tehran, Iran
S. Chenarani27, E. Eskandari Tadavani, S.M. Etesami27, M. Khakzad, M. Mohammadi
Na-jafabadi, M. Naseri, S. Paktinat Mehdiabadi28, F. Rezaei Hosseinabadi, B. Safarzadeh29,
M. Zeinali
University College Dublin, Dublin, Ireland
M. Felcini, M. Grunewald
INFN Sezione di Baria, Universit`a di Barib, Politecnico di Baric, Bari, Italy
M. Abbresciaa,b, C. Calabriaa,b, A. Colaleoa, D. Creanzaa,c, L. Cristellaa,b, N. De Filippisa,c,
M. De Palmaa,b, A. Di Florioa,b, F. Erricoa,b, L. Fiorea, A. Gelmia,b, G. Iasellia,c, S. Lezkia,b,
G. Maggia,c, M. Maggia, G. Minielloa,b, S. Mya,b, S. Nuzzoa,b, A. Pompilia,b, G. Pugliesea,c,
R. Radognaa, A. Ranieria, G. Selvaggia,b, A. Sharmaa, L. Silvestrisa,15, R. Vendittia,