3
1.1 Introduction
Constitutional chromosome balanced translocations occur in approximately one in 500 births, whom 6% are associated with clinical phenotypes (Warburton, 1991). Molecular characterization of such balanced translocations has been instrumental to decipher the genetic etiology of developmental anomalies and also to give contribution for annotation of human genome.
Peter´s anomaly (OMIM 604229) is characterized mostly by embryological defects in the anterior segment of the eye which consists in central corneal opacity (leukomas - presence of white spot), defects of the inner layers of the cornea and a variable degree of lenticular and irido-corneal adhesions that leads to abnormal or even absence of anterior chamber. Secondary glaucoma is often associated with bilateral phenotypes. Moreover glaucoma represents the second major leading cause of blindness worldwide with an estimated 70 million people affected (Linda & Semina., 2011).
Peter´s anomaly (PA) is predominantly inherited as autossomal recessive condition yet dominant and sporadic forms have also been documented. This condition may also occur as an isolated form or associated with systemic anomalies, mainly characterized by short stature, brachydactyly, developmental delay, dysmorphic facial features, cleft lip and palate among other defects mostly found in patients affected by Peters plus syndrome (OMIM 261540). PA is associated with a spectrum of developmental disorders affecting the anterior segment of the eye – anterior segment dysgenesis (ASD). This group of ocular disorders reveals an incomplete penetrance and variable expressivity which pinpoints to a complex etiology. To date, the genetic etiology underlying ASD remains elusive however important contributions have been made by linkage studies as well as through characterization of animal models. Molecular studies carried out in humans have identified haploinsufficiency of transcription factor coding genes affecting: paired box homeotic gene 6 (Pax6), homeobox protein PITX2 (Pitx2), homeobox protein PITX3 (Pitx3), forkhead box c1 (Foxc1), forkhead box c2 (Foxc2), forkhead box e3 (Foxe3), maf musculoaponeurotic fibrosarcoma oncogene homolog (avian) Maf and eyes absent homolog 1 (Drosophila) Eya1 due to point mutations, deletions and insertions (Graw, 2004). In addition, recent findings reviewed by Reis and Semina (2011) have reported other anterior segment dysgenesis genes, ranging from signaling, adhesion and extracellular matrix related molecules. Most of these transcription factors are dose sensitive with a strictly spatio-temporal expression patterns regulated by a complex array of long range cis regulatory domains (Kleinjan, D & Heyningen V, 2005; Visel et al, 2007; Amiel et al, 2010).
These distant cis regulatory element sequences are frequently highly conserved among vertebrates and can be located upstream, downstream or within introns of neighboring genes. Most often lie in gene deserts, located as far as 1.5 Mb from flanked target genes (Bofelli et al., 2004; Kleinjan et al., 2004, Loots et al., 2008, and Nobrega et al., 2003). Furthermore these
4
conserved non-coding elements harbor clusters of TFBS which modulates gene expression in a tissue-specific manner. Important experimental evidences came from transgenic mice models that support the regulatory role of these conserved non-coding elements capable to drive reporter geneexpression in a spatial and tissue-specific manner throughout development (Visel
et al., 2007).
Other etiologies such as chromosome balanced rearrangements have been implicated in such ocular defects. Fine mapping of breakpoints have elucidated pathogenic mechanisms implicated in gene haploinsufficiency through position effects that leave intact the “transcription unit”, yet causing misexpression regulation leading to abnormal ocular development. The breakpoint effect can disrupts long range regulatory elements from target promoters or can induced nuclear reorganization of chromosome derivatives leading to alteration of gene expression profiles (Kleinjan & Coutinho, 2009; David et al, 2009; David et al, 2013).
Chromosome abnormalities such as translocations/inversions and genomic deletions and duplications have been associated with ASD phenotypes (reviewed by Mataftsi, et al, 2011). Molecular cytogenetic studies undertaken in a group of patients affected with aniridia (OMIM106210), mapped a set of breakpoints in Pax6 locus, precisely located at 150 Kb downstream from the promoter region (Linda & Semina., 2011; Kleinjan et al., 2001). This result was able to identify and characterize a novel cis regulatory region, with transcriptional regulatory function driving Pax6 expression on developing eye.
Maf is a transcription factor that contains a leucine-zipper DNA binding domain and is located
on 16q22-q23. It is an important key regulator for crystalline genes expression during lens fiber differentiation (Kawauchi et al., 1999). A breakpoint analysis of t(5;16) translocation in a family with cataracts and ocular anterior segment anomalies indicated that the translocation effect triggered a misexpression regulation of Maf gene by affecting a regulatory element located within a intron of Woww neighboring gene. Additionally a missense mutation in another family with lens and iris anomalies confirmed the role of Maf in lens development (Jamieson et al. 2002).
Foxc1 and Pitx2 genes are both expressed in same developing ocular structures, playing a role
during chamber angle patterning, by regulating mesenchyme differentiation of presumptive trabecular meshwork and extracellular matrix remodeling that give raise to Schlemm´s canal.
Pitx2 is a member of the bicoid class of homeodomain transcription factor family that maps on
4p25. In humans and mice, Pitx2 deficiency leads to Axenfeld Rieger Syndrome (ARS) (Tümer et al., 2009), suggesting conservation of function for this gene during mammalian embryonic development. In mice, Pitx2 knockout results in embryonic lethality with ocular, craniofacial, dental, brain, heart, lung, body wall and other systemic defects observed. Ocular anomalies are observed in the Pitx2 -/- homozygous but not in Pitx2 +/- heterozygous animals and include arrest in anterior segment development, thickening of the mesothelial layer of the cornea resulting in enophthalmos, dysgenesis of the extra-ocular muscle and other systemic defects (Gage et al.,
5
1999). Expression studies demonstrate that Pitx2 is strictly regulated and is expressed in neural crest derived periocular mesenchyme that contributes to the ocular and craniofacial tissues affected in ARS. Identification of genomic alterations found in 4p25 has suggested that a dosage sensitivity of Pitx2 may account for human ocular phenotypes. Both hypomorphic and over-activating alleles of Pitx2 can cause human ASD which indicates a dosage sensitivity of this transcription factor (Linda & Semina., 2011). Recent genomic characterization of a patient with Axenfled-Rieger syndrome (ARS) provided important clues about Pitx2 long range regulation. A deletion mapped on 4q25 located at 106 kb upstream from the intact Pitx2 transcription unit revealed an evolutionary conserved non-coding element sequence. This genomic element was further characterized through a transgenic zebrafish assay which demonstrated a cis-ruption mechanism affecting a distant cis regulatory region of this gene which is able to recapitulate the endogenous Pitx2 expression, consistent with embryological tissues affected by ARS (Volkman et al., 2011).
Foxc1 is a transcription factor with a forkhead/winged-helix DNA binding domain and maps on
6p25. In the developing eye, Foxc1 is primarily expressed in the periocular and pre-endothelial mesenchyme, cornea, conjunctival epithelium and trabecular meshwork (Graw, 2004). In corneas of Foxc1-/- mice the epithelium is thickened, the stroma is disorganized and there is no differentiation of the endothelium. The lens fails to separate from the cornea and as result there is a complete absence of the ocular anterior chamber (Kidson et al., 1999). Foxc1-/+ heterozygous mice are viable and have milder anterior segment defects than Foxc1-/- mice (Hong et al., 1999, Smith et al., 2000).
Development of periocular mesenchyme derived tissues is abnormal in Foxc1-/+ mice. Abnormalities include iris malformations, iridocorneal adhesions and corneal opacity. Angle malformations include small or absent Schlemm´s canal and hypoplastic, compressed trabecular meshwork. Abnormal iridocorneal angle structures have a paucity of extracellular matrix proteins including collagen and elastin and cells that have the appearance of undifferentiated precursor cells.
Patients with mutations in Foxc1, have a spectrum of ASD phenotypes and glaucoma. Genomic duplications and deletions mapped on 6p25 locus have been implicated in iridogoniodysgenesis type I, IRID1 (OMIM 601631), an ASD disorder characterized by defects in iris associated with glaucoma (Lehmann et al., 2002., Nishimura et al., 1998).
Interestingly, a molecular characterization of familial balanced translocation t(1;7) associated with an isolated form of Peters anomaly demonstrated that 1q41 breakpoint is located closest from an evolutionary conserved non-coding region. This region is located 500 Kb apart from transforming growth factor, beta 2
(
Tgfb2) transcription unit where most likely can act as an6
A recent study has shown that Tgfb2 is the upstream factor regulating Pitx2 and Foxc1 transcription factors. In mice, a conditional targeted inactivation of Tgfb2 signaling showed malformed anterior segment structures, reminiscent of Peter´s anomaly phenotype along with a decreased phosphorilation of transducing effector molecule Smad2 and also by donwregulation of Pitx2 and Foxc1 expression in stroma and inners layers of cornea (Iwao et al., 2009).
Despite TGF has 3 mammal isoforms, only Tgfb2 knockout mice have shown abnormal ocular morphogenesis characterized by thin corneal stroma, absence of corneal endothelium, fusion of cornea to lens (a Peter´s like phenotype) and accumulation of hyaline cells in vitreous (hyperplastic primary vitreous) (Saika et al., 2001; Ittner et al., 2005 & Tovar-Vidales et al., 2011). In addition several other defects were detected and characterized, including heart, craniofacial defects and abnormal bone formation (Sanford et al., 1997).
In addition to that, expression studies during ocular development have shown similar Tgfb2 expression patterns observed among humans and mice which pinpointed to a conserved function of this molecule among mammals (Firsova et al., 2011). Moreover in mice, Tgfb2 deficiency or overexpression results in anterior segment anomalies, which supports a dosage sensitivity mechanism that regulates properly Tgfb2 throughout anterior segment development.
1.2 propose
Here we aim to perform molecular characterization of a female proband, with a de novo t(11;18)(q23.3;q11.2) balanced translocation associated with a syndromic form of Peter´s anomaly, (ectopia lentis and CNS abnormalities). Fine mapping of breakpoints and further assessment of gene expression profile by array and RT-qPCR will contribute to elucidate the functional role of breakpoint surrounding genes in development and molecular pathogenesis of anterior segment of the eye and also give a contribution in annotation of the human genome.
7
Chapter II – Material and Methods
8
2.1 Patient samples
The proband carrying a de novo t(11;18) balanced translocation is a child from a non-consanguineous Kurdish family recruited in a medical clinical genetics in Finland. The relatives, father, mother do not manifest clinical phenotypes. In addition a group of subjects affected with Peter’s anomalies was included in this study. These patients are from Hungarian and Portuguese families.
2.2 Cell culture
Previously, peripheral blood samples were collected and lymphocyte cell transformation was performed as described by Neitzel (1986) and according to standard protocols at the National Institute of Health, Dr. Ricardo Jorge (Department of Genetics, Lisbon). These were cultured in RPMI1640® Dutch modified medium, supplemented with 20% fetal bovine serum heat inactivated 3mM glutamine and 2% of penicillin (10000 UI/ml) and streptomycin (10000 mg/mL), maintained at 37ºC, 5% CO2 in open culture conditions. The human lens epithelium cell line, H36CE (kindly gifted by Dr. Alan Prescott, lens laboratory, Dundee University) was cultured in DMEM Glutamax® medium (Gibco) with 10% fetal bovine serum heat inactive (Gibco) and supplemented with 1% of penicillin/streptomycin.
2.3 Flow sorting of derivative (der) chromosomes
Chromosomes in metaphase were flow sorted by a dual laser FACS Vantage (Becton Dickinson) starting from a LCL culture in log phase from index case (translocated patient), treated with 0,05 mg/ml colcemid (final concentration) for 16 hours carried out according to standard protocols described in Unger et al., (2010). Of each derivative chromosomes, 27000 for der(11) and 40000 for der(18) were sorted into PCR tubes for genomic amplification. The sorting procedure was carried out at CHROMBIOS Molecular Cytogenetics (Raubling, Germany).
2.4 DNA extraction, genomic amplification, array painting and
amplification of junction fragments
Genomic DNA was prepared from LCL established from peripheral blood mononuclear cells from translocated patient, DGH041689 using QIAamp® DNA blood extraction midi kit, from QIAGEN (Hilden, Germany) carried out according to the manufacturer´s instructions. For assessment of quality control, DNA was analyzed in Nanodrop® and also by electrophoresis in a 0.8% agarose gel.
For genomic amplification of each flow sorted derivative chromosomes, approximately 5,000 were used in 10µl of sorting buffer. Amplification was performed using the REPLI-g® Midi Kit,
9
from QIAGEN (Hilden, Germany) according to the manufacturer´s instructions for laser microdissected cells. The reaction volume was increased to 77,5 µl. Purification of each derivative chromosome genomic amplicons were carried out as previously described (David et al., 2013) (Purification of REPLI-g amplified DNA using the QIAamp DNA Mini Kit). The quality control of the amplicons was evaluated by electrophoresis in a 0.8% agarose gel and by amplification of a control fragment (350 bp in size).
The high resolution oligonucleotide array painting was performed using the Genome-Wide Human SNP 6.0 array (Affymetrics®, Santa Clara, CA, USA) according to the manufacturer´s instructions at Gulbenkian Institute of Science (Oeiras, Portugal). This array contains more than 1.8 million SNP and CN marker probes with a marker spacing average of 680 bp.
Each purified genomic amplicons of flow-sorted derivative chromosome DNA samples was diluted in low TE buffer, with a concentration ≥ 50 ηg/µl. Total amount of 500 ηg was required for each array preparation. Briefly, genomic DNA was digested with Sty I and Nsp I restriction enzymes, Sty I and Nsp I fragments were ligated with specific adaptors for PCR amplification. Fragmentation, biotin end-label of DNA samples and loading and hybridization into microarray were carried out using Human SNP 6.0 Sty I/Nsp I assay, (Affymetrics, Santa Clara, CA, USA). Washing and staining steps were performed according to human SNP 6.0 P_450 protocol, according to manufacturer´s instructions (Affymetrics, Santa Clara, CA, USA). Finally microarray was scanned and data was validated with BIRDSeed algorithm. The data were analyzed using ChAS software from Affymetrics. The chromosome positions where the log2ratios change from high to low ratio (or vice versa) defines potential alterations or CNVs. Potential CNVs were queried in the Database of Genomic Variants (DGV, http:/projects.tcag.ca/variation/?source=hg19).
To narrow down the breakpoints within the region delimited by FISH and array analysis, a set of primers were designed and used to amplify the presence of chromosome markers. Oligonucleotides and amplification conditions used for this goal are summarized in table 1.1 The der (11) and der (18) junction fragments were amplified with the primer pairs OAF-5F/AC110583-5R and AP000679-2R/AC110583-8F, respectively. The primer sequences and amplification conditions are summarized in table 1.2. The resulting junction fragments were sequenced by automated direct dideoxy sequencing. PCR fragments were purified by centrifugation through centricon columns YM-100K (Millipore, Billerica, MA). Sequencing was performed by the BigDye® terminator cycle sequencing kit with the PCR primers and reaction products were separated on the automated sequencer ABI 3130XL according to manufacturer’s instructions (Applied Biosystems, Foster City, CA, USA). The sequencing data were aligned to the human genome assembly GRCh37/hg19.
10
2.5 RNA isolation and expression analysis of candidate genes
In order to reduce variation due to minor differences in cell culture conditions, lymphoblastoid cell lines (LCLs) were grown under previously established standard conditions as previously described (David et al., 2013). Total cellular RNA was isolated from 1,0x 10⁷ cells using QIAamp® RNA blood extraction kit according to manufacturer´s instructions (Qiagen). In addition, RNAse-free DNAse I treatment was performed by incubating RNA samples for 30 minutes at room temperature. Assessment of quality and quantity for extracted RNA was determined by Agilent 2100 Bioanalyzer® (Palo Alto, CA, USA) and also with Nanodrop® ND-1000 (Thermo Scientific, Wilmington, DE, USA). The amount of 2 µg of RNA was reverse transcribed (RT) into cDNA with Superscript First-Strand kit and random hexamers, according to manufacturer´s instructions (Life Technologies, Carlsbad, CA, USA). The RT reactions were diluted with 60 µl of DEPC treated H20 as described previously and stored at -80ºC.
Assessment of gene expression levels in LCL of the proband was performed using the Human Gene 1.0 ST array from Affymetrics®. The following steps of labelling, hybridization, washing, staining and scanning of the arrays were performed according to the manufacturer´s instructions at the Gulbenkian Institute of Sciences (Oeiras, Portugal). Data analysis was carried out according as previously described (David et al., 2013).
For validation of Human Gene 1.0 ST array data, Real time RT-PCR assays were performed with TaqMan® Gene Expression Master Mix, according to manufacturer´s instructions (Applied Biosystems, Foster City, CA, USA). Primers and probes were pre-designed according to inventoried TaqMan gene expression assays. The efficiency of each PCR assay was previously tested with serial tenfold dilution of cDNA as described previously by Livak and Schmittgen, (2001). All RT-PCR reactions were set up in a final volume of 15 µl. Each sample was run in triplicate in 96 well plates into ABI 7500 real time PCR system device, set up for default thermal conditions. For each plate, the amplification plots were first analyzed and threshold cycle was set up manually. The 2ΔCt method was used to measure fold change on gene expression levels in LCLs for the following gene transcripts: OAF (TaqMan assay: Hs00420156_m1, exon junction 3 to 4), POU2F3 (TaqMan assay: Hs00205009_m1, exon junction 5 to 6), ARHGEF12 (TaqMan assay: Hs00209661_m1, exon junction 30 to 31) PVRL1 (TaqMan assay: Hs01591978_m1, exon junction 4 to 5) CYP1B1 (TaqMan assay: Hs02382916_s1, exon 3) and EDIL3 (TaqMan assay: Hs00174781_m1, exon junction 2-3). Normalization of gene expression data was performed relative to mean ratio of Ct values of DIDO1 00223101_m1) and GUSB (Hs-02827277_g1). To test whether fold change is different between translocated patient relative to LCLs from a control group, a two tailed T test was performed with a p value <0, 05. A group of 15 LCLs from unrelated subjects were used as controls.
11
2.6 Mutational screening of CYP1B1
Genomic DNA was prepared from peripheral blood samples from a group of subjects affected with Peter´s anomaly using QIAamp® blood DNA extraction midi kit, (Qiagen) according to manufacturer´s instructions. These DNA samples were further assessed for quality by Nanodrop ND-1000 using 260:280 absorbance ratio values. Integrity was checked by electrophoresis in a gel with 0.8%.
The entire coding sequence of CYP1B1, exon-intron junctions, untranslated exon I and a fragment spanning the 5´UTR region were amplified for mutation screening. Oligonucleotides used as primers and amplification conditions are summarized in supplementary table 1.5 Sequencing was performed by automated direct dideoxy sequencing. PCR fragments were purified by centrifugation through centricon columns YM-100K (Millipore, Billerica, MA). Sequencing was performed by the BigDye® terminator cycle sequencing kit with the PCR primers and reaction products were separated on the automated sequencer ABI 3130XL according to manufacturer’s instructions (Applied Biosystems, Foster City, CA, USA). The sequencing data was analyzed manually and also with blast tool provided by Ensembl genome browser and according with human genome reference assembly GRCh37/hg19.
2.7 Analysis of Breakpoint Regions
Sequence from junction fragments were aligned with blast tool from Ensembl genome browser (www.ensembl.org). Repetitive DNA sequences of low complexity were screened by repeat masker tool available on UCSC (genome.ucsc.edu) (the reference sequence is the current human genome assembly GRCh37/hg19). Comparative genomic sequence analysis was achieved by VISTA genome browser. Software settings were defined by a window size of 100 bp length and a minimal sequence conservation identity above 70% (www.genome.lbl.gov/vista). UCSC and RefSeq annotation tracks were used to identify assigned genes located around the breakpoint regions.
13
Chapter III - Results
14
3.1 Breakpoint mapping at nucleotide resolution
Mapping the breakpoints of chromosome rearrangements has been a successful approach for the identification of disease causing genes and to study the mechanism of chromosome rearrangement. In the last decades, identification of translocation breakpoints have been achieved with FISH using labeled large insert clones yet with low resolution and time consuming. Presently, array painting provides higher resolution and faster way to identify chromosome translocation breakpoints.
Previously, cytogenetic analysis of GTL-banded metaphase chromosomes from the proband t(11;18), revealed a de novo apparently balanced chromosome translocation between chromosomes 11 and 18 [t(11;18)(q25)(q11.2)]. Therefore, with the aim to narrow down the breakpoints, FISH mapping of the breakpoints was carried out. A number of BAC clones encompassing the breakpoints were FISH mapped on metaphase chromosome spreads from proband.
Fine mapping of translocation breakpoints were carried out by array painting with genome amplicons from derivative flow sorted chromosomes. Analysis of array data, localized chromosome 11 breakpoint within an approximately 3.3 kb fragment, between copy number (CN) markers C-051RG (120,126,723) and C-051RL (120,130,006) whereas the chromosome 18 breakpoint was localized within a 1.5 kb fragment delimited by the CN markers S-2NVJXA (20,173,998) and C-0FQO1 (20,175,539) of the Genome-Wide Human SNP Array 6.0 (reference genome assembly GRCh37/hg19). The array result was confirmed by the presence of specific PCR fragments in the two derivative flow sorted chromosome genome amplicons.
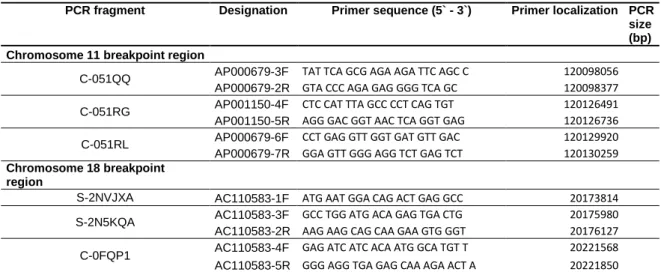
Table 1.1Oligonucleotides and amplification conditions used for refinement of the breakpoints.
PCR fragment Designation Primer sequence (5` - 3`) Primer localization PCR size (bp)
Chromosome 11 breakpoint region
C-051QQ AP000679-3F TAT TCA GCG AGA AGA TTC AGC C 120098056
AP000679-2R GTA CCC AGA GAG GGG TCA GC 120098377
C-051RG AP001150-4F CTC CAT TTA GCC CCT CAG TGT 120126491
AP001150-5R AGG GAC GGT AAC TCA GGT GAG 120126736
C-051RL AP000679-6F CCT GAG GTT GGT GAT GTT GAC 120129920
AP000679-7R GGA GTT GGG AGG TCT GAG TCT 120130259
Chromosome 18 breakpoint
region
S-2NVJXA AC110583-1F ATG AAT GGA CAG ACT GAG GCC 20173814
S-2N5KQA AC110583-3F GCC TGG ATG ACA GAG TGA CTG 20175980
AC110583-2R AAG AAG CAG CAA GAA GTG GGT 20176127
C-0FQP1 AC110583-4F GAG ATC ATC ACA ATG GCA TGT T 20221568
AC110583-5R GGG AGG TGA GAG CAA AGA ACT A 20221850
Polymerase chain reaction specific fragments were carried out from genomic amplicons of derivative chromosomes. Annealing temperature was 60ºC for all fragments and amplification was carried out for 25 cycles.
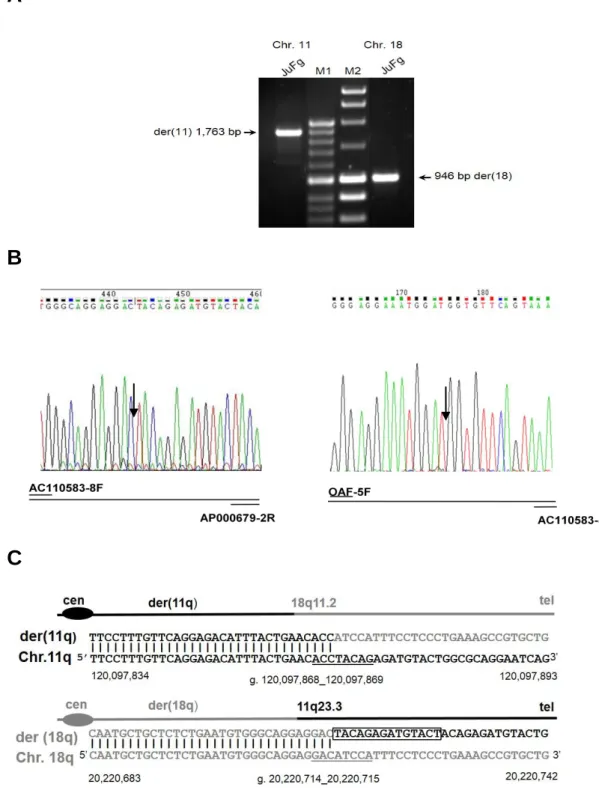
As shown in figure 1.1, the junction fragments were further amplified and sequenced. Sequence alignments were carried out between junction fragments and the corresponding reference
15
genome (current human genome assembly h19/GRCh37). This analysis localizes the chromosome 11 breakpoint at position g. 120,097,868_120,097,869 within intron 3 (IVS3) of
OAF (Out of first protein homolog). Analysis of genomic repeats (Ensembl genome browser)
shows type I transposon/LINE (120097837-120098137) with 301 bp size within the 11q23.3 breakpoint. This breakpoint is flanked upstream by TRIM29 (119,981,983-120,056,237) and
PVRL1 (Poliovirus receptor-related 1) (119,494,120-119,599,794) whereas downstream it is
flanked by POU2F3 (POU class 2 homeobox 3) (120,107,349-120,190,653), TMEM136 (Transmembrane protein 136) (120,195,838-120,204,391) and ARHGEF12 (Rho guanine nucleotide exchange factor 12) (120,207,787-120,360,645) (Fig 2A).
Table 1.2 Oligonucleotides used for amplification of junction fragments
Chr designation
5´-3´
sequence Fragment Genomic localization
11 OAF-5F CCACCTCCCATCCACACCT JuFg der 11 120097267
18 AC110583-5R GGGAGGTGAGAGCAAAGAACAA JuFg der 11 20221850
11 AP000679-2R GTACCCAGAGAGGGGTCAGC JuFg der 18 120098377
18 AC110583-8F CAGCCTACCCCTTACTTTTCAC JuFg der18 20220241
This genomic sub-band 11q23.3 has been characterized as breakpoint prone region, described by several genomic aberrations like 11qter deletion syndrome (Jacobsen syndrome) or the recurrent t(11;22) translocations. To date several fragile and non- fragile sites at 11q23.3 (FRA11) have been screened and involved in genesis of DNA breakage.
The 18q11.2 breakpoint, at position g. 20,220,714_20,220,715, localizes in a gene poor region flanked by repeats, LTR79 (20,220,183-20,220,526) and MER2 type II transposon (20,221,012-20,221,101). This breakpoint is flanked upstream by GATA6 (19,749,404-19,782,491) and
CTAGE1 (19,993,573-19,997,878) whereas downstream it is flanked by RBBP8 at position g. 20,378,224-20,606,451 (Fig 3) (The reference human genome is the assembly version 72.37, GRCh37).
Breakpoint analysis indicates 13-bp duplication in the sequence of chromosome 11 on der (18) whereas on chromosome 11 breakpoint the sequence is contiguous (figure 1.1). Therefore the proband´s karyotype revised is 46, XX, apparently a de novo balanced t(11,18)(11q23.3)(18q11.2) translocation. Both parents have normal karyotypes.
The 18q11.2 breakpoint region was further analyzed through comparative genomic VISTA analysis. This analysis identified eight conserved non-coding element sequences (CNE) across 18q11.2 breakpoint spanning sequence with 100 kb size. This breakpoint is flanked by two CNE (Fig 4).
16
A
B
C
Figure 1.1 Amplification and DNA sequence of the der (11) and der (18) junction fragments. (a)
Amplification of the translocation junction fragments. A 1763 bp (left) and a 956 bp (right) PCR junction fragments were obtained from the der (11) and der (18) chromosomes respectively. The translocation junction fragments are indicated by black arrows. (b) Sequencing of PCR amplified junction fragments. Black arrows indicate the breakpoints position at nucleotide level. Electropherograms are showing 11q23.3 breakpoint sequence in reverse orientation whereas 18q11.2 is in forward orientation. Schematic diagram shows chromosome specific primers to PCR-amplify junction fragments (C) Sequence alignment between junction fragment sequences and human genome reference (chromosome 18 sequence is given in grey black, whereas the chromosome 11 sequence in black). The 13 bp duplication in the chromosome 11 sequence of der (18) is boxed whereas the homologous pentapalindromic GACATCCA at the translocation breakpoints are underlined. The position of the breakpoints at the DNA sequence level are indicated (current genome assembly GRCCh37/hg19).
17
A
B
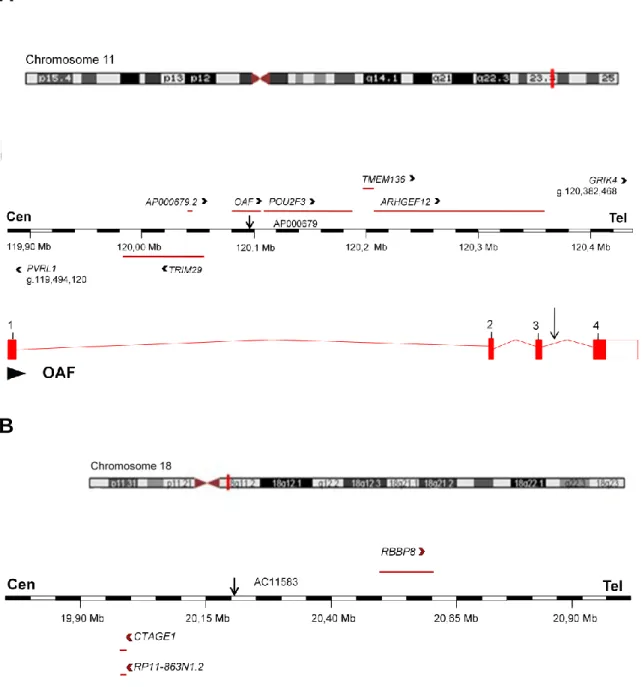
Figure 1.2 Overview of the two breakpoint regions. The affected chromosome regions are highlighted
by red vertical lines whereas arrows indicate the position of breakpoints. GenBank accession numbers of the breakpoints spanning sequences are given above the maps. (a) Ideogram of chromosome 11, with physical map across the breakpoint. Horizontal lines with arrowheads indicate the position of genes in sense (above the map) or antisense (below the map) orientation. Location and genomic organization of
OAF is indicated. Numbered vertical lines indicate exons. The reference sequence is the current genome
assembly GRCh37/hg19. (b) Ideogram of chromosome 18, with physical map across breakpoint region. Horizontal lines with arrowheads indicate the position of genes in sense (above the map) or antisense (below the map) orientation. The vertical black arrow indicates the location of breakpoint mapped in this study. The reference sequence is the current genome assembly GRCh37/hg19.
18
A
B
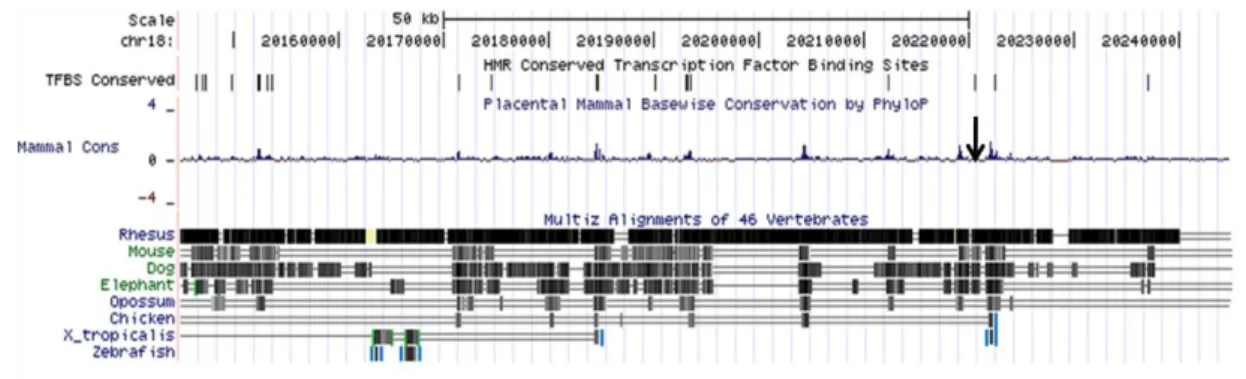
Figure 1.3 Genomic organization of evolutionary conserved non-coding element sequences across chromosome 18q11.2 breakpoint region. (a) Distribution of conserved non-coding element sequences
(CNE) among vertebrates in a 100 kb fragment spanning 18q11.2 breakpoint region. Arrow indicates the location of breakpoint (Human genome assembly is GRCh37/h19). (b). VISTA plot analysis of 100 Kb fragment (g. 20,140,000-20,240,000). Comparative genomic analysis between human genome reference and chicken, rat and mouse genomes, depicted on right side with a conservation identity above 80% and sliding window of 100bp. Below the plot an arrow indicates the location of the breakpoint surrounded by two proximal conserved non-coding element sequences (CNE 7 and 8) out of 8.
Ggal
Rnor
Mmus
19
3.2 Expression analysis of candidate genes
As recently reported by David et al. (2013) expression studies were undertaken by array profiling and validation by TaqMan® real time RT-PCR technology.
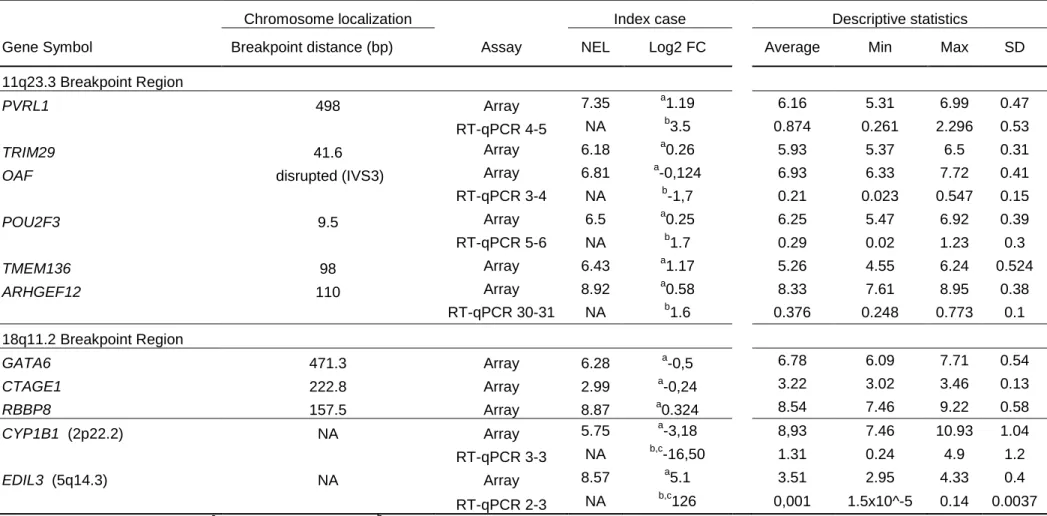
Assessment of gene expression profile using Human Gene 1.0 ST expression array from Affymetrics® in LCLs of the proband carrying t(11;18) indicated an approximately 3-fold reduction in expression levels of cytochrome P450, family 1, subfamily B, polypeptide 1, from chromosome 2p22.2 (CYP1B1) whereas the EGF-like repeats and discoidin I-like domains 3, from chromosome 5q14 (EDIL3) showed a 5-fold increase in proband relative to control. Expression levels of CYP1B1 are not statistically significant whereas for EDIL3 is significant with a p value of 0.001.
We propose that a position effect mechanism could lead to dysregulation of candidate genes, located within a 3 Mb window from chromosome 11 breakpoint. Interestingly, both Poliovirus receptor-related 1 (PVRL1) located about 500 Kb upstream and Transmembrane protein 136 (TMEM136) located 98 Kb downstream from 11q23.3 breakpoint, indicated approximately 1.2-fold increase in LCLs of the proband against control. The expression levels of OAF (Out of first protein homolog), disrupted by breakpoint as well as the closest genes from breakpoint were not considerably different from control (table 1.3).
Subsequently, the expression level of candidate genes, CYP1B1, EDIL3 and PVRL1 in LCL of the proband as well as in control LCLs from 15 unrelated subjects were determined by real time RT-PCR. The relative gene expression levels were normalized against mean ratio of two reference genes Death Inducer-Obliterator 1 (DIDO1) and Glucuronidase, Beta (GUSB). While
DIDO1 shows mean Ct values of 24 with a SD of 0.5, the GUSB presents a mean Ct value of 28
with SD of 0.5. Therefore the stability for gene expression levels was similar for both genes, however the mean Ct values are quite different and the mean ratio between these two control genes may express more accurately a wide range of expression data.
The mean relative expression level of CYP1B1 transcript comprising exon 3 in the proband compared with control group was 16.5 fold lower (0,079 vs 1,31, P=0,0014) whereas EDIL3 transcript comprising exon 2-3 junction sequence indicated a fold change by 104 higher in proband relative to control (3,56 vs 0,034, P= 0,034). Finally the relative gene expression level of PVRL1 transcript comprising 3-4 junction sequence presented a 3,5 fold increase relative to control (3,11 vs 0,87) not statistically significant. The gene transcripts Out At First Protein Homolog (OAF) and POU Class 2 Homeobox 3 (POU2F3) were also assayed by real time RT-PCR technology and fold change values in proband relative to control were determined (table 1.3). These values are different from those obtained by array, yet without statistical significance. While for Rho Guanine Nucleotide Exchange Factor (GEF) 12(ARHGEF12) transcript, level of
gene expression presented similar values compared with array (table 1.3). Despite that RT-qPCR data confirmed the array, these significant differences between expression array and real
20
time RT-PCR technique could be due to the sensitivity of real time PCR and/or with different hybridization probes covering different exon junction sequences.
In the chromosome 18 breakpoint, the flanked genes Cutaneous T-Cell Lymphoma-Associated Antigen 1 (CTAGE) and Retinoblastoma Binding Protein 8 (RBBP8) presented fold change values in LCLs of proband relative to controls by -0.24 and 0.32. These fold change values suggest that the translocation breakpoint is not affecting gene expression (table 1.3).
Additionally we used a group of patients affected with peters anomaly from different families in order to provide hints about pathogenesis and genetic etiology of Peter´s anomaly. Therefore candidate genes were also analyzed with LCLs from this group of patients with peters anomaly (Figure 1.4). Expression analysis was quantified only with RT-qPCR. The relative expression values for CYP1B1 transcript in LCL of proband relative to this group was 12,5 fold lower whereas EDIL3 indicated a fold change by 83 higher in proband relative to mean relative expression of peters group. In addition, patient no 8 showed a 40 fold increase of relative expression of EDIL3 when compared with Peter´s group.
The mean relative expression of PVRL1 transcript in the proband relative to PA group was higher by 2.9 fold. Finally, relative expression data either for OAF and POU2F3 was 1.4 fold reduction and 1.5 fold increased respectively in proband relative to PA group. Interestingly the patients 8 and 9 presented relative expression levels very lower compared with LCLs of peters patients group.
3.3 Candidate genes are expressed in human lens epithelium
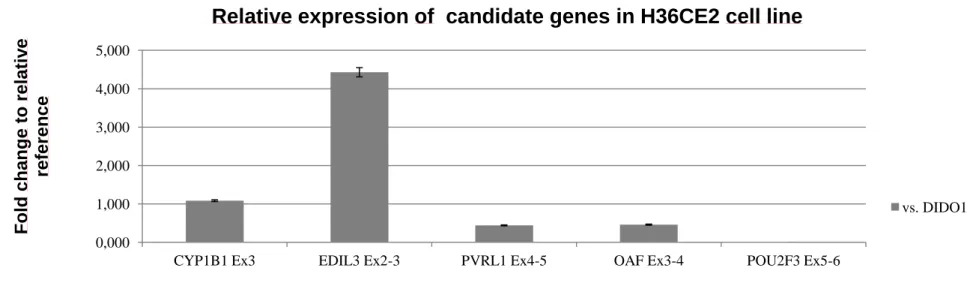
In order to understand the functional role of candidate genes during lens development, we addressed this question by assessing additional quantification of relative gene expression with RNA from a relevant physiopathological human lens epithelium cell line, H36CE2. Conversely as shown in RNA from LCLs, EDIL3 gene transcript is highly expressed in human lens epithelium cell line with an increase of 4.43-fold relative to DIDO1 reference gene. CYP1B1 (1.09), OAF (0.46) and PVRL1 (0.44) transcripts have shown only moderate levels of gene expression. Conversely POU2F3 gene transcript is not expressed in human lens epithelium cell line (figure 1.4).
21
0,000 0,250 0,500 0,750 1,000Fold
c
hange
re
la
tiv
e
to
re
fere
nce
Relative expression of EDIL3 transcript comprising exon 2-3 junction
vs. DIDO1:GUSB 0,000 2,000 4,000 6,000 8,000 10,000 12,000
Fold
c
hange
re
la
tiv
e
to
re
fere
nce
Relative expression of CYP1B1 transcript comprising exon 3
22
0,000 0,500 1,000 1,500 2,000 2,500 3,000Fold
c
hange
re
la
tiv
e
to re
fere
nce
Relative expression of PVRL1 transcript comprising exon 3-4 junction
23
B
0,000 0,200 0,400 0,600 0,800 1,000 1,200 1,400 1,600Fold
c
hange
re
la
tiv
e
to re
fere
nce
Relative expression of OAF and POU2F3 transcripts
OAF POU2F3
24
Figure 1.4 Relative expression levels of candidate gene transcripts. (a) Bar graphs depicting the relative expression of CYP1B1 and EDIL3 and PVRL1 transcripts. (b) Bargraphs depicting the relative expression of remaining OAF and POU2F3 genes from 11q23.3 region. Expression levels of all fragments were normalized to the mean ratio of two controls, DIDO1 and GUSB. Fold change relative to reference is given in 2ΔCt. Error bars represent standard deviation. GP1 to GP9 are subjects affected by peters anomalies, and C1 to C15 are control LCLs from unrelated subjects. (c) Bar graphs depicting the relative expression of candidate gene transcripts in human lens epithelial cell line H36CE2. 0,000 1,000 2,000 3,000 4,000 5,000
CYP1B1 Ex3 EDIL3 Ex2-3 PVRL1 Ex4-5 OAF Ex3-4 POU2F3 Ex5-6
Fold
c
hange
to
re
la
tiv
e
re
fere
nce
Relative expression of candidate genes in H36CE2 cell line
25
Table 1.3 Summary of the expression data obtained by two different methodsChromosome localization Index case Descriptive statistics
Gene Symbol Breakpoint distance (bp) Assay NEL Log2 FC Average Min Max SD
11q23.3 Breakpoint Region
PVRL1 498 Array 7.35 a1.19 6.16 5.31 6.99 0.47
RT-qPCR 4-5 NA b3.5 0.874 0.261 2.296 0.53
TRIM29 41.6 Array 6.18 a0.26 5.93 5.37 6.5 0.31
OAF disrupted (IVS3) Array 6.81 a-0,124 6.93 6.33 7.72 0.41 RT-qPCR 3-4 NA b-1,7 0.21 0.023 0.547 0.15 POU2F3 9.5 Array 6.5 a0.25 6.25 5.47 6.92 0.39 RT-qPCR 5-6 NA b1.7 0.29 0.02 1.23 0.3 TMEM136 98 Array 6.43 a1.17 5.26 4.55 6.24 0.524 ARHGEF12 110 Array 8.92 a0.58 8.33 7.61 8.95 0.38 RT-qPCR 30-31 NA b1.6 0.376 0.248 0.773 0.1 18q11.2 Breakpoint Region GATA6 471.3 Array 6.28 a-0,5 6.78 6.09 7.71 0.54 CTAGE1 222.8 Array 2.99 a-0,24 3.22 3.02 3.46 0.13 RBBP8 157.5 Array 8.87 a0.324 8.54 7.46 9.22 0.58 CYP1B1 (2p22.2) NA Array 5.75 a-3,18 8,93 7.46 10.93 1.04 RT-qPCR 3-3 NA b,c-16,50 1.31 0.24 4.9 1.2 EDIL3 (5q14.3) NA Array 8.57 a5.1 3.51 2.95 4.33 0.4 RT-qPCR 2-3 NA b,c126 0,001 1.5x10^-5 0.14 0.0037
NEL: normalized expression level. a Analyzed as two groups. b Fold change of the expression levels of candidate genes was normalized against mean ratio of DIDO1 and
26
3.4 Mutational analysis of CYP1B1
The CYP1B1 maps on chromosome 2p22-p21 at GLCA3 locus and encodes a member of the cytochrome P450 superfamily of dioxin-inducible genes. CYP1B1 encodes for a monooxygenase which catalyzes reactions involved in detoxification of xenobiotics, synthesis of steroids and other lipids.
Furthermore, several studies performed during chicken and murine development have revealed a predictive role in ocular development. In 2004, Stoilov et al, examined the murine embryonic expression of CYP1B1 by whole mount in situ hybridization, having found a spatio-temporal expression pattern consistent with ocular structures affected by primary congenital glaucoma and ASD phenotypes such as Axenfeld Rieger and Peter´s anomalies. By other hand a functional analysis of CYP1B1 deficient mice performed by Libby et al, 2003 revealed dysgenesis of trabecular meshwork and absence of Shlemm´s canal, both ocular structures with a functional role in regulation of intraocular pressure, affected in PCG and ASD human phenotypes. Several studies have shown that CYP1B1 mutations are associated with PCG as well as in minor extension with Peters and Axenfeld Rieger anomalies.
In this context and due to reduction of CYP1B1 mRNA levels in proband, we thought that a deletion or a nonsense mutation might account for reduced CYP1B1 gene expression. Therefore we screened the entire coding and regulatory 5´region of CYP1B1, yet we did not find any pathogenic mutations associated with ocular phenotypes.
In addition we included plus 15 peters patients from different families (described in table 1.4) and we screened in the same way the CYP1B1 with the goal to understand the role of CYP1B1 in this group of patients affected with Peter´s. Sequencing data indicated two previously mutations being one 13-bp homozygous deletion affecting a female from a Portuguese family. This mutation was previously reported by Stoilov et al., 1997. This deletion removed nucleotides 1410 to 1422 from exon 3 of the gene and resulted in a frameshift that truncated the open reading frame by creating a premature stop codon (TGA) 203 bp downstream of the deletion. The second mutation was found in two relatives, father and son from a Brazilian family and is considered a missense heterozygous 4046T-A transversion in exon 2, resulting in a tyr81-to-asn (Y81N) substitution. This mutation was previously reported by Melki et al, 2004 in two unrelated French Caucasian patients with adult-onset primary open angle glaucoma. Based on functional analysis of enzymatic activity of cytochrome this mutation was reported as hypomorphic allele having presented an intermediate activity between pathogenic mutations and the SNP coding haplotype with the most reduce activity.
Apart from these mutations we detected only coding non synonymous single nucleotide polymorphisms (rs10012, rs1056827, rs1056836, rs1056837 and rs1800440) in the rest of patients including proband carrying t(11;18). These 5 common SNPs resulted in different haplotypes that have been functionally characterized by Chavarria-Soley et al., 2008.
27
Additionally a recent publication, conducted in a southern Indian population indicated a strong functional association with a regulatory polymorphism rs2567206 (T2805C) and PCG cases harboring homozygous CYP1B1 coding mutations. Conversely, it was not detected a significant association with non-congenital forms of glaucoma. Furthermore this polymorphism was functionally assayed by a CAT reporter system in TM3 trabecular meshwork cell line and results clearly showed a considerably reduction of promoter activity in CCG haplotype whereas TCG showed a protective haplotype. Furthermore this region was analyzed by TFBS scan software tools which suggests that promoter has putative binding sites for transcription factors such as, PBX-1, GATA-1, and NKX-2, encompassing the rs2567206 polymorphism. These transcription factors are required for the correct patterning during development and could be involved in regulation of trabecular meshwork (Chakrabarti et al., 2010).
28
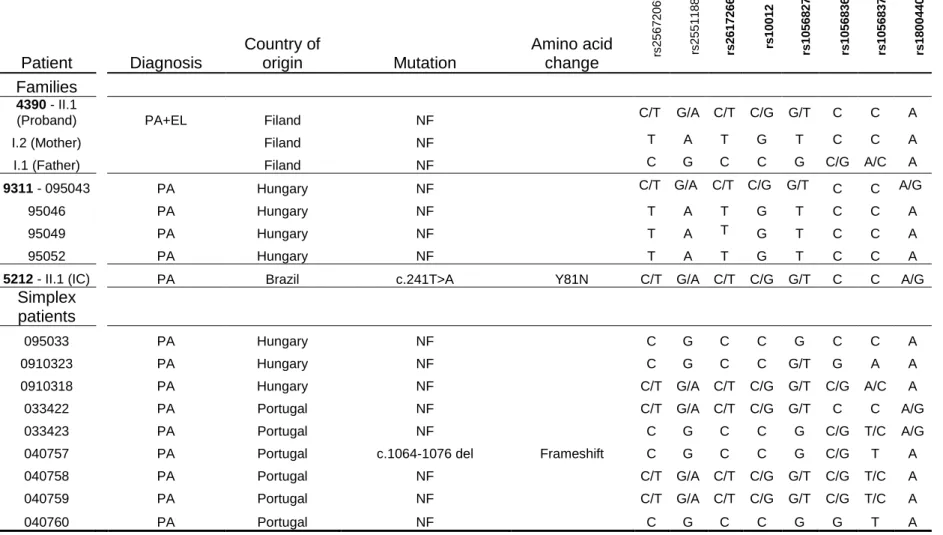
Table 1.4 Single Nucleotide Polymorphism Based Haplotypes Associated with CYP1B1 MutationsHaplotype (dbSNP)
Patient
Diagnosis
Country of
origin
Mutation
Amino acid
change
rs 2 5 6 7 2 0 6 * r s 2 5 5 1 1 88 rs 2 6 1 7 2 6 6 rs 1 0 0 1 2 rs 1 0 5 6 8 2 7 rs 1 0 5 6 8 3 6 rs 1 0 5 6 8 3 7 rs 1 8 0 0 4 4 0Families
4390 - II.1
(Proband) PA+EL Filand NF C/T G/A C/T C/G G/T C C A
I.2 (Mother) Filand NF T A T G T C C A
I.1 (Father) Filand NF C G C C G C/G A/C A
9311 - 095043 PA Hungary NF C/T G/A C/T C/G G/T C C A/G
95046 PA Hungary NF T A T G T C C A
95049 PA Hungary NF T A T G T C C A
95052 PA Hungary NF T A T G T C C A
5212 - II.1 (IC) PA Brazil c.241T>A Y81N C/T G/A C/T C/G G/T C C A/G
Simplex
patients
095033 PA Hungary NF C G C C G C C A
0910323 PA Hungary NF C G C C G/T G A A
0910318 PA Hungary NF C/T G/A C/T C/G G/T C/G A/C A
033422 PA Portugal NF C/T G/A C/T C/G G/T C C A/G
033423 PA Portugal NF C G C C G C/G T/C A/G
040757 PA Portugal c.1064-1076 del Frameshift C G C C G C/G T A
040758 PA Portugal NF C/T G/A C/T C/G G/T C/G T/C A
040759 PA Portugal NF C/T G/A C/T C/G G/T C/G T/C A
29
Mutation nomenclature is based on GenBank accession cDNA NM_000104; NF corresponds to Not Found. Patients were diagnosed with PA – Peter´s anomaly; EL – Ectopia lentis; Index cases are indicated by IC. The 5 known coding SNPs (printed in bold) with exception for rs2617266 that lies in IVS1 have been used to establish CYP1B1 haplotypes. Asterisk corresponds to a regulatory SNP rs2567206 located on promoter region, reported by Chakrabarti et al. 2010 and SNP rs2551188 which lies within exon I (not translated) have also been used to extended CYP1B1 haplotype.
31
Chapter IV - Discussion
32
Here we aimed to described molecular characterization of a female proband with a de novo t(11;18) (q23.3q11.2) balanced translocation associated with a syndromic form of Peter´s anomaly (ectopia lentis and mild abnormalities in CNS). Fine mapping of breakpoints demonstrated that 11q23.3 breakpoint lies within a LINE/L2 whereas 18q11.2 breakpoint is surrounded by two Alu repeated sequences SINES. This structural genomic information at breakpoint regions suggests a LINE/SINE mediated misalignment of the non-homologous chromosomes followed by recombination at homologous palindromic sequences. This mechanism has been proposed in chromosome translocations implicated repetitive low complexity DNA sequences as targets for chromosome disruption and non-homologous recombination (Nambiar and Raghavan, 2011).
As illustrated in figure 1.2, the 11q23.3 breakpoint maps on a gene rich region and disrupts the IVS3 of OAF. Despite the fact that OAF is disrupted, Array and RT-qPCR data results revealed that OAF gene expression level is considerable unchanged in LCL from proband carrying the t(11;18).
However this expression value cannot exclude the true functional role of this gene during ocular morphogenesis. In human lens epithelium H36CE cell line, moderate gene expression level was detected for OAF. This data may suggest a possible role for this gene during lens development. Array and RT-qPCR data results indicate that CYP1B1 (cytochrome P450, family 1, subfamily B, polypeptide 1, from chromosome 2p22.2) and EDIL3 (EGF-like repeats and discoidin I-like domains 3, from chromosome 5q14) gene expression levels are altered in LCL from proband carrying the t(11;18) translocation.
In addition, mutation screening of CYP1B1 was performed and no pathogenic mutation was identified in proband, although, in 15 subjects affected with Peter´s anomaly, we found a disease-causing 13 nt, homozygous deletion in exon 3 (NM_000104.3:c.1064-1076delGAGTGCAGGCAGA) identified in a Portuguese patient with PA as well as a missense heterozygous mutation resulting in a tyr81-to-asn (Y81N) substitution identified in a Brazilian patient with PA (data shown in table 1.3).
Despite these two mutations have been previously described in patients with congenital glaucoma and primary adult onset open angle glaucoma, CYP1B1 have also been described as candidate gene for Peter´s anomaly (Tang et al, 1996; Abu-Amero et al, 2011; Bejjani et al, 1998; Vincent et al, 2001; Churchill and Yeung , 2005).
It has been suggested that Peter´s anomaly and PCG arise from defective neural crest cell migration in the 4th to 7th week of fetal development, during which period the anterior segment of the eye forms. By other hand a functional analysis of CYP1B1 deficient mice performed by Libby et al, 2003, revealed dysgenesis of trabecular meshwork and absence of Shlemm´s canal, both ocular structures with a functional role in regulation of intraocular pressure, and affected in PCG, Peter´s and Axenfeld Rieger human anomalies (Cvekl & Tamm, 2004).
33
These result shows that CYP1B1 plays an important role during differentiation of ocular anterior segment and in pathogenesis of Peter´s and primary congenital glaucoma may share the same development pathway for anterior ocular segment.
It is possible that EDIL3 may act as a modifier of CYP1B1 mutations causing a spectrum of Peter´s like phenotypes. To date a possible functional interaction between CYP1B1 and EDIL3 is still not understood.
EDIL3 maps on 5q14 and encodes a glycoprotein secreted by endothelial cells that binds to integrin
αvβ3 receptor (Choi et al, 2008; Hidai et al, 1998). EDIL3 is structurally classified as an RGD-binding integrin. RGD is a cell binding domain common to any matrix proteins including fibronectin, vitronectin and tenascin (Schürpf et al, 2012). It plays an important role in mediating angiogenesis and may be important in vessel wall remodeling and development (Penta et al, 1999).
The integrin is present in both lens epithelial and fiber cells. In fibrotic lens diseases such as posterior capsular opacification (PCO) as well as anterior subcapsular cataract (ASC), integrins and matrix extracellular changes have been associated with a pathological process of transdifferentiation of lens epithelial cells into contractile, α-smooth muscle actin (α-SMA)-expressing myofibroblasts, commonly referred to as an epithelial-mesenchymal transition (EMT) (Walker & Menko, 2009).
The EDIL3 an integrin ligand, is highly expressed in human lens epithelial cell line and (Figure 1.4), a deregulation process of EDIL3 likely contribute for abnormalities of lens development, consistent with Peter´s anomaly and /or lens dislocation (ectopia lentis).
Furthermore, the transcription factor coding gene, PR Domain Zinc Finger Protein (PRDM5) with PR and zinc finger domains is involved in regulation of extracellular matrix development and maintenance and are of particular relevance to the multisystemic connective tissue phenotype of brittle cornea syndrome (BCS). Expression microarray analysis on dermal fibroblasts from two BCS patients with PRDM5 mutations (deletion of exons 9-14 and c.1768C>T) compared to those from age- and sex-matched controls, have shown great differences in extracellular matrix molecules in particular genes encoding connective tissue components, and molecules regulating cell migration and adhesion such as EDIL3 and TGFB2. These downstream molecules may play a common role in epithelial to mesenchyme transition pathway during ocular mesenchyme development and differentiation which is consistent with BCS phenotype affecting cornea structure and function (Burkitt et al, 2011).
Furthermore PVRL1 (Poliovirus receptor-related 1) located approximately 500 kb upstream from 11q23.3 breakpoint, revealed altered gene expression levels in proband (Lopez et al,1995) with 3.5 fold change in proband relative to control.
PVRL1 belongs to the nectin subfamily of immunoglobulin-like adhesion molecules that participates in
Ca2+ - independent cell-cell adhesions. Nectin proteins bind to the actin cytoskeleton through the cytoplasmatic adaptor protein afadin. These components constitute a nectin mediated adherens
34
junction mechanism. PVRL1 usually has two sometimes three extracellular immunoglobulin-like loops, a single transmembrane domain and a cytoplasmic region that plays a role in the organization of adherens junctions and tight junctions in epithelial and endothelial cells through interactions mediated by PVRL1/PVRL3 as well as PVRL1 and PVRL4 (Barron et al., 2008) (STRING 9.0; http://string-db.org/ ) and (KEGG; http://www.genome.jp/kegg/)
In humans, PVRL1 mutations cause cleft lip and palate/ectodermal dysplasia 1 syndrome (CLPED1) (OMIM 225060) as well as non-syndromic cleft lip with or without cleft palate (CL/P). Recently, Lachke et al. (2012), described a patient with a balanced, t(1;3)(q31.3;q13.13) translocation, severe bilateral congenital cataracts, CNS abnormalities and mild developmental delay. It was proposed that translocation breakpoint may affect regulation of PVRL3, located 500 Kb upstream from the chromosome 3 breakpoint most likely due to a position effect. PVRL3 was first described as a critical gene involved in nectin-mediated cell-cell adhesion mechanism in human ocular development.
During development, PVRL1 and -3 asymmetrically localize not only at puncta adherentia junctions but also at synaptic junctions. Using rat hippocampal neurons in culture, Mizoguchi et al., (2002) observed that inhibition of the nectin-based adhesion results in a decrease in synapse size and a concomitant increase in synapse number.
PVRL1/ PVRL3 cell-cell interactions have also been identified in anterior lens epithelium and epithelia
of ciliary body. Both structures are critical for proper development of anterior segment of the eye. Recently, Inagaki et al., (2005) investigated the role of PVRL1 and 3 during mouse development. Through generation of PVRL1 -/- and PVRL3 -/- mice this author have shown the role of these cellular adhesion molecules during ciliary body processes. These mice have shown micropthalmia and abnormal morphogenesis of ciliary body due to impairment of apex-apex adhesion between pigment and non-pigment cell layers of the ciliary epithelia. These nectin-mediated adhesions are essential for the morphogenesis of the ciliary body and may play a role in lens attachment.
In conclusion we propose that PVRL1 is deregulated most likely due to a cis-ruption mechanism triggered by 11q23.3 breakpoint which led to abnormalities affecting lens and CNS development. This gene may account for lens dislocation and CNS findings identified in proband.
By other hand, the chromosome 18q11.2 breakpoint region lies on a gene-poor region, flanked only by
CTAGE1 and RBBP8. Analysis of expression and functional data for these two genes, available in
public database resources such as NCBI, EMAGE, MGI, Gene cards, did not revealed expression or functional overlap associated with genes implicated in common processes of eye development. Comparative genomic analysis in a fragment encompassing 18q11.2 breakpoint region, revealed several CNEs across species, with 80% identity (figure 1.3). Two of these CNEs are closely surrounding the breakpoint. An interesting hypothesis to elucidate the genetic cause underlying this
35
translocation associated to PA anomaly is the acquisition of a new CNE by the translocated POU2F3 relocated in a new cis-regulatory environment of derivative chromosome 18.
Furthermore, POU2F3 gene expression level was almost equal in proband relative to control group. However, expression and functional data reviewed for POU2F3 indicated a role involved in regulation of keratinocyte differentiation during skin development and wound healing responses (Enomoto et al., 2003 & Andersen et al., 1997). POU2F3 encodes for an epidermal POU family domain of transcription factor. Moreover POU2F3 promoter region was scanned by genomatix® El Dorado promoter analysis software and several smad2 and 3 binding-sites were found (data not shown). This apparent upstream regulation by TGFβ2 signaling led to hypothesize a functional interaction between these two genes during cornea stroma differentiation.
In fact, Cornea is structured by several layers of epithelia and keratinocytes which exhibit several cell phenotypes and states. A critical balance between differentiated and undifferentiated keratinocytes is vital for cornea function and for proper extracellular matrix stroma development and maintenance. Corneas from conditional targeted TGFβ2 signaling revealed abnormal ECM stroma with a densely packed keratinocytes (Itnner et al., 2009). A misexpression regulation of POU2F3 due to relocation of this gene in new chromosome context may contribute for molecular pathogenesis of Peter´s anomaly associated translocation.
37
Chapter V – Bibliographic References
38
Abu-Amero KK, Osman EA, Mousa A, et al., (2011). Screening of CYP1B1 and LTBP2 genes in Saudi families with primary congenital glaucoma: genotype-phenotype correlation. Molecular Vison. 17, 2911-2919.
Amiel J. et al, (2010). Disruption of long-distance highly conserved non-coding elements in neurocristopathies. Annals of the New York academy of sciences: 1214, 34-46.
Andersen B. et al (1997). Functions of the POU domain genes Skn-1a/i and Tst-1/Oct-6/SCIP in epidermal differentiation. Genes Dev. 11,1873-84.
Bejjani BA, Lewis RA, Tomey KF, Anderson KL, Dueker DK, Jabak M. Astle, WF, Otterud B, Leppert M, Lupski JR, (1998) Mutations in CYP1B1, the gene for cytochrome P4501B1, are the predominant cause of primary congenital glaucoma in Saudi Arabia. Am. J. Hum. Genet. 62: 325-333.
Benko S. et al., (2009). Highly conserved non-coding elements on either side of Sox9 associated with Pierre Robin sequence. Nat Genet. 41, 359-364.
Barron MJ, Brookes SJ, Draper CE, Garrod D, Kirkham J, Shore RC, Dixon MJ, (2008). The cell adhesion molecule nectin-1 is critical for normal enamel formation in mice. Hum. Molec. Genet. 17: 3509-3520.
Burkitt Wright EM, Manson FD, Zeef LA, Urquhart J, Zoppi N, Bonshek R, Tosounidis I, Mohan M, Madden C, Dodds A, Banka S Au L, Khan N, Biesecker LG, Wilson M, Rohrbach M, Colombi M, Giunta C, Black GC, (2011). Mutations in PRDM5 in brittle cornea syndrome identify a pathway regulating extracellular matrix development and maintenance.; Am J Hum Genet. 12;89 (2):346. Chavarria-Soley G, Stich H, Aklillu E, Ingelman-Sundberg M, Pasutto F Reis, Rautensatrauss B, (2008). Mutations in CYP1B1 cause primary congenital glaucoma by reduction of either activity or abundance of the enzyme. Human Mutation. 29: 1147-53.
Chavarria-Soley G, Michels-Rautenstrauss K, Pasutto F, Flikier D, Flikier P, Cirak S, Bejjani B, Winters DL, Lewis RA, Mardin C, Reis A, Rautenstrauss B. (2006) Primary congenital glaucoma and Rieger's anomaly: extended haplotypes reveal founder effects for eight distinct CYP1B1 mutations. Mol Vis. 22;12:523-31.
Churchill AJ, Yeung A A, (2005). Compound heterozygous change found in Peters' anomaly. Mol Vis. 21;11:66-70.
Campos-Mollo E, Lopez-Garrido MP, Blanco-Marchite C, Garcia-Feijoo J, Peralta J, Belmonte-Martinez J, Ayuso C, Escribano J, (2009) CYP1B1 gene mutations in Spanish patients with primary congenital glaucoma: phenotypic and functional variability. Molec. Vis. 15: 417-431.
Cvekl, Ales and Tamm, Ernest R., (2004). Anterior eye development and ocular mesenchyme: new insights from mouse models and human diseases. Bioessays. 26: 374-386.
David Dezso, Cardoso Joana, Marques Bárbara, Marques Ramira, Silva Eduardo D, Santos Heloísa, e Boavida Maria G, (2003). Molecular characterization of a familial translocation implicates disruption of HDAC9 and possible position effect on TGFB2 in the pathogenesis of Peters Anomaly. Genomics. 81: 489-503.
David D, Marques B, Ferreira C, Araújo C, Vieira L, Soares G, Dias C Pinto, M (2013) Co-segregation of trichorhinophalangeal syndrome with a t(8;13)(q23.3;q21.31) familial translocation that appears to increase TRPS1 gene expression. Human Genet, DOI 10.1007/s00439-013-1333-0.
David D, Marques B, Ferreira C, Vieira P, Corona-Rivera A, Ferreira J C, and van Bokhoven (2009) Characterization of two ectrodactyly-associated translocation breakpoints separated by 2.5 Mb on chromosome 2q14.1–q14.2. Eur J Hum Genet 17, 1024–1033.
39
Davies AF, Mirza G, Flinter F, An interstitial deletion of 6p24-p25 proximal to the FKHL7 locus and including AP-2alpha that affects anterior eye chamber development (1999). J Med Genet; 36: 708-10. Enomoto K, Enomoto Y, Ishii Y, Araie M, Kanda T, Genes up- or down-regulated by expression of keratinocyte-specific POU transcription factor hSkn-1a (2003). Biochem Biophys Res Commun; 303: 580-5.
Firsova NV, Markitantova IuV, Smirnova IuA, Panova IG, Zinov'eva RD,(2011). Analysis of TGFB2 expression in human eye tissues in prenatal development. Izv Akad Nauk Ser Biol. 16-23.
Gehring WJ, (2002).The genetic control of eye development and its implications for the evolution of the various eye-types. Int. J. Dev. Biol. 46, 65–73
Graw J. (2004).The Genetic and molecular basis of congenital eye defects. Nat Rev Genet; 4:876-888.
Hidai C, Zupancic T, Penta K, Mikhail A, Kawana M, Quertermous EE, Aoka Y, Fukagawa M, Matsui, Y, Platika D, Auerbach R, Hogan BLM, Snodgrass R, Quertermous T, (1998). Cloning and characterization of developmental endothelial locus-1: an embryonic endothelial cell protein that binds the alpha-v-beta-3 integrin receptor. Genes Dev. 12: 21-33.
Inagaki M, Irie K, Ishizaki H, Tanaka-Okamoto M, Morimoto K, Inoue E, Ohtsuka T, Miyoshi J, Takai Y. (2005) Roles of cell-adhesion molecules nectin 1 and nectin 3 in ciliary body development. Development. 132(7):1525-37.
Ittner Lars M, Wurdak Heiko, Schwedtfeger Kerstin, Kunz Thomas, Ille Fabian, Leveen Per, Hjalt Tord A, Suter Ueli, Karlsson Stefan, Hafezi Walter, E Sommer Lukas, (2005). Compound developmental eye disorders following inactivation of TGFβ signaling in neural-crest stem cells. J. Bio. 4: 111-116 Iwao K, Inatani M, et al., (2009). Heparan sulfate deficiency leads to Peter´s anomaly in mice by disturbing neural crest TGF-beta2 signaling. J Clin Invest. 7: 1997-2008
Jamieson RV, Perveen R, Kerr B, et al., (2002) Domain disruption and mutation of the bZIP transcription factor, MAF, associated with cataract, ocular anterior segment dysgenesis and coloboma. Hum Mol Genet. 11: 33-42.
Kawauchi S, Takahashi S, Nakajima O, Ogino H, Morita M, Nishizawa M, Yasuda K, Yamamoto M. (1999) Regulation of lens fiber cell differentiation by transcription factor c-Maf. J Biol Chem. Jul 2;274(27):19254-60.
Kleinjan Dirk A, Heyningen Veronica. (2005) Long_range control of gene expression: Emerging mechanisms and disruption in disease. Am. J. Hum. Genet. 76: 8-32.
Kleinjan DA, Seawright A, Shedl A, Quilan RA, Danes S, van Heyningen V, (2001). Aniridia-associated translocations, DNAse hypersensitivity, sequence comparison and transgenic analysis redefine functional domain of PAX6. Human Molecular Genetics. 10: 2049-2059.
Kleinjan Dirk-Jan, E Coutinho Pedro, (2009). Cis-ruption mechanisms: disruption of cis-regulatory as a cause of human genetic disease. Briefings in functional genomics and proteomics; pp 1-16.
Kidson SH, Kume T, Deng K, Winfrey V, and Hogan BL, (1999) The forkhead/winged-helix gene, Mf1, is necessary for the normal development of the cornea and formation of the anterior chamber in the mouse eye. Dev Biol. 211(2):306-22.