Performance analysis of
corporate events
Tomás Ferreira
Dissertation written under the supervision of Professor Geraldo
Cerqueiro
Dissertation submitted in partial fulfilment of requirements for the MSc
Performance analysis of corporate events
AbstractThis paper researches the short-term effects of corporate events, such as privatisations, M&A throughout their historical waves, and IPOs of previously family owned businesses, worldwide. The aim of this research is to investigate the effect of such corporate events on the firm’s operational and financial performance, and understand if it’s beneficial to different stakeholders. Firstly, this paper will offer a brief overview of existing research on corporate events studies, followed by a series of tests considering variables that proxy a firm’s operating and financial performance. Furthermore, an analysis of multiple factors is drawn, such as if the overall results are dependent on countries or industries in which the corporate event took place. Results show that, in fact, there is an operational and financial motive for companies to follow corporate actions such as M&As, IPOs and privatisations. Depending on the different corporate action, there is strong evidence in the form of firm performance indicators that that suggest improvements to the business, thus leading to benefits for its various stakeholders. Due to the lack of research in this field, this study offers valuable insights as to the effects of the three aforementioned corporate actions and the variety of factors that influence the performance of a firm following such corporate actions.
Keywords: performance, privatisation, family-owned businesses, corporate governance
Author: Tomás Ferreira Advisor: Professor Geraldo Cerqueiro
Dissertation Master’s in finance
Performance analysis of corporate events Católica Lisbon School of Business and Economics
Análise da performance de eventos corporativos
Abstrato
Esta dissertação investiga os efeitos a curto prazo de eventos corporativos, como é o caso das privatizações, fusões e aquisições, ao longo do tempo. Assim como, de oferta pública inicial (OPIs) de negócios anteriormente considerados familiares, em todo o mundo. O objetivo desta dissertação é investigar o efeito destes eventos corporativos no desempenho operacional e financeiro das empresas em análise, e consequentemente perceber se esse efeito é benéfico para os diferentes stakeholders. Inicialmente, a dissertação apresenta uma visão geral da pesquisa existente relativa a estudos de eventos corporativos, seguida de uma série de testes que consideram variáveis que representam aproximações do desempenho operacional e financeiro de uma empresa. Adicionalmente, foi desenvolvida uma análise de fatores múltiplos, sobre a hipótese de os resultados gerais serem dependentes de países ou indústrias nas quais o evento corporativo ocorreu. Os resultados mostram que, de facto, há um motivo operacional e financeiro para as empresas seguirem ações corporativas, como fusões e aquisições, OPIs e privatizações. Efetivamente, considerando diferentes ações corporativas, é possível observar fortes evidências na substância dos indicadores de desempenho da empresa que sugerem melhorias no negócio, que consequentemente, levam a benefícios para os seus stakeholders. Não obstante do facto de haver falta de pesquisa neste campo, este estudo oferece informações relevantes sobre os efeitos das três ações corporativas mencionadas e a variedade de fatores que influenciam o desempenho de uma empresa após tais ações.
Palavras-chave: performance, privatização, negócios familiares, governação corporativa Autor: Tomás Ferreira
Orientador: Professor Geraldo Cerqueiro Dissertação
Mestrado de Finanças
Análise da performance de eventos corporativos Católica Lisbon School of Business and Economics
3 | P a g e Performance analysis of corporate events
Index
Executive Summary ... 4
Literature review ... 5
1) Privatisations ... 5
2) Mergers & Acquisitions ... 6
3) Family owned business IPOs ... 8
Methodology ... 9
1) Data ... 10
a) Privatizations ... 10
b) Mergers & Acquisitions ... 10
c) Family owned business IPOs ... 11
2) Variables selection ... 12 a) Expansion rate ... 12 b) Employment ... 12 c) Investment efficiency ... 13 d) Shareholders return ... 13 e) Profitability ... 13 f) Efficiency ... 13 g) Output ... 14 h) Investment ... 14 i) Shareholders wealth ... 14 j) Liquidity ... 15 k) Leverage ... 15 3) Empirical study ... 15 Results ... 17
1) Empirical tests (Wilcoxon test and Z-statistic) ... 17
a) Privatisation ... 17
b) M&A ... 18
c) Family owned business IPOs ... 21
2) Regression ... 22
a) Privatisation ... 23
b) M&A ... 23
c) IPO of family owned business ... 26
Discussion ... 27
1) Privatisation ... 27
2) M&A ... 28
3) IPO family business ... 30
Limitations ... 27
Conclusion ... 31
Appendix ... 32
4 | P a g e Performance analysis of corporate events
Executive Summary
In order for a company to expand its operations and become more efficient, as well as raise new capital, it must take certain corporate actions to fulfil its goals. The actions that a company take can be defined as corporate events. Inside of the corporate events we have two relevant company’s measures: operational actions and financial actions.
With regards to operational measures, for a company to increase its value, it may develop new products, open new factories, expand to new regions/countries, and/or develop new technologies that will increase its operational efficiency.
In terms of corporate financial actions, a company can decide to acquire or merge with other companies (follow an M&A procedure); raise new capital through private investors, such as Private Equity firms, Ventures Capital firms and other funds; raise capital through the issuance of new equity in the public market (IPO); raise new debt, which in some cases may be unfavourable depending on if it is a growth company (or have a considerably high amount of intangible assets), or when it is not able to raise debt at favourable or competitive interest rates due to its visibility on the market. State-owned companies may also consider privatization to reduce the annual government budget, increase competition in the market, or improve the efficiency of the company since social welfare it is the primary goal of a governmental organization.
This paper analyses the short-term impact of corporate events in companies, specifically in M&A throughout their historical waves, privatisations of previously state owned firms, and IPOs of family owned businesses. These three mentioned financial corporate events are some of the most relevant actions that a firm may take as a means to expand, gain visibility on the market, and raise capital to keep its operations on track. These paper aims to answer to three main research questions:
1) Has the financial corporate event studied been beneficial for the different stakeholders of the company (i.e.: investors, managers, employees and debtholders)?
2) What is the main positive impact on companies’ financial performance following the financial corporate event?
3) Which industry and country compensates more following those financial corporate events?
In order to reach the answers for the three formulated research questions, this paper is driven and follows a similar research methodology of D’Souza, Megginson & Nash (2007), where they study the short-term impact on privatisations. The major differentiating factor between
5 | P a g e Performance analysis of corporate events
this study and D’Souza, Megginson & Nash (2007) is that both M&As throughout their waves and IPO of family owned businesses, are taken into account, and a regression analysis is carried out as a check to see if the positive performance of the studied events statistically depends on the country and industry where the event took place. Furthermore, the privatisation analysis is carried out with more variables, with an increased the data frame to 2017, and takes into consideration not only share-issue privatisations, but private sales likewise.
The main motivation for choosing these three specific events is the fact that there are a limited amount of studies following these subjects, and of these, most are outdated or are county and industry specific rather than worldwide and industry-generalised. By understanding the main motivations of a company to choose one of the mentioned corporate events, we can verify if in fact it is favourable for a company to follow such actions, and analyse what the main financial motivations are. This paper offers especially valuable insights, since it provides a thorough analysis of the short term effects of three corporate events in a single study paper.
The paper will start by overviewing the main drivers of the research by doing a brief literature review. Following this, it will outline the methodology in which the conducted tests are explained, and how the data was extracted and subsequently treated. Next, a brief description of the variables established for this research will be provided as well as the reasons why they were chosen. Finally, the results of the prior stated tests will be discussed. Subsequently, in the conclusion the results will be reasoned and compared to the findings of our key drivers mentioned in literature review and the limitations of this study will be stated.
Literature review
This segment describes previous main studies in these three key addressed areas, to better understand what the motivations to study these corporate events were. Since this paper focuses on three different financial corporate topics, three sub-segments were chosen to describe previous literatures on the three different areas:
1) Privatisations
One of the first empirical studies addressing privatisations, Brada (1996), defined privatisation as state-owned enterprises being sold to private owners, resulting in a change of corporate governance due to the transfer of ownership. In this paper the author also defines four types of privatisation methods: share issue privatisation restitution, direct asset sales, restitutions and voucher privatisation. Furthermore, Megginson & Netter (2001), covers the history of
6 | P a g e Performance analysis of corporate events
privatisations that took place in Germany and more importantly, the several privatisations undertaken by Margaret Thatcher in the Railway, Telecom and Gas industries in the UK, which due to its success, propelled privatisations across Europe. The aim of this paper was to understand what the main drivers for governments to privatise state-owned enterprises are. The authors concluded that the main objective consisted in raising revenue for the state, promote economic efficiency, reduce government interference, promote wider share ownership, encourage competition and the intention to develop the country’s capital markets.
However, the first study that focuses on how restructurings and corporate governance changes affect the firm’s post-privatisation financial and operating performance was conducted by D’Souza, Megginson & Nash (2007), by performing empirical tests to analyse the newly privatised firms’ changes in profitability, efficiency and other variables. Based on the authors’ sample they reached seven main findings regarding post-privatisation performance: (1) increased profitability (2) increased efficiency (3) increased investments (4) increased output (5) reduced employment (6) reduced leverage and (7) increased dividend payments.
The three mentioned papers were the ones considered to be most relevant and a great addition for the study of privatisations worldwide. However, there are many other studies such as Smith, Cin and Vodopivec (1997), Claessens, Djankov and Pohl (1997) and Frydman, Gray, Hessel and Rapaczynski (1999) which focus on privatisations in central and eastern Europe concluding strong improvements in performance, however both papers had a big limitation: lack of observations. It is also worth mentioning, Boycko, Shleifer & Vishny (1996), Jenkinson (1999) and Megginson & Nash (2007) papers, which defend that governments try to look at multiple objectives to reach the social-welfare, which at times could be conflicting, resulting in inefficient corporate governance, hence the companies go private and try to maximize profit and eliminate inefficiencies of the business.
2) Mergers & Acquisitions
M&A activity is a topic that has been historically widely studied and analysed. Takeover activity lasts from more than a century which makes it attractive to understand how it is exacerbated by a variety of different factors, such as: (1) what the main drivers for positive synergies in takeovers are, Signori and Vismarra (2018); (2) what the impact of takeovers defences in the overall deal size is, Bhojraj, Sengupta and Zhang (2017); (3) the impact of corporate reforms on cross border acquisitions, Han Kim and Yao Lu (2013); (4) how the
7 | P a g e Performance analysis of corporate events
degree of investor protection affects the development of M&A activity, Cao, Cumming, Goh and Wang (2018); and (5) abnormal returns study following the announcement of M&A deals. It is a well-known fact that M&A activity suffers a lot from cyclicality, usually described as ‘waves’. The term M&A wave reflects the wave pattern of the number and the total value of takeover deals over time. Historically, there are six M&A waves defined by empirical researchers and specialists. Martynova and Renneboog (2008), identified that the beginning of each takeover wave typically coincides with a number of economic (credit expansion), political, and regulatory changes, usually in economic recovery context, and they are disrupted by a steep decline in stock markets and a subsequent period of economic recession.
The first wave, also called the Great Merger Wave which started in late 1890s and ended in 1903, took place in the US, it coincided with the introduction of new state legislation on corporations engaged in trading in industrial stocks in the NYSE. This wave was largely characterized by horizontal consolidation of companies leading to the creation of monopolies. The first wave came to an end when the equity market crashed. The ending of the First World War resulted in the emergence of the second wave, lasting from late 1910s to 1929, also in the US. This second wave was a move towards oligopolies since monopolies could not afford a further expansion. This wave ended with the rise of the US’ economic great depression of 1929. The third M&A wave took off on the 1950s with the beginning of the tightening anti-trust regime in the US, and was characterized by a very high number of diversifying takeovers that led to the development of conglomerates. The third wave came to an end with the oil crisis in 1973. The recovery of the stock market, the changes in the anti-trust policy, and the deregulation on the financial services converged in the beginning of the fourth wave, lasting from 1981 to 1989. This wave was characterised by an unprecedented number of divestures, hostile takeovers and privatisations. Similarly to all other waves, the fourth one declined after the stock market crashed in 1987. The fifth takeover wave was from 1993 to 2000, and surged along the increasing economic globalisation, technological innovation, deregulation and privatisation. The striking feature of this wave was essentially the internationalisation of firms. The fifth wave halted as consequence of the equity market crash of 2000. Since 2003 takeover activity picked up in the US, Europe and Asia, with the continuation of the globalisation by firms with the difference that in this wave, acquirers prefer friendly negotiations as opposed to hostile takeovers. Much like all the other waves it came to an end with the subprime mortgage crisis of 2007.
8 | P a g e Performance analysis of corporate events
Recently, a study conducted by Cordeiro (2014) mentions that based on the previous study conducted by Martynova and Renneboog (2008), we are currently facing and observing a seventh M&A wave after the recovery from economic crisis that with worldwide repercussions. In 2015, M&A activity reached the second highest total transaction value of $3.5tn, only surpassed by 2007’s total deal value of $3.7tn. In 2016 and 2017 M&A activity recorded the third and fourth largest deal values with a total of $3.2tn and $3.1tn, respectively. This wave can be characterised by strong and intense technological revolutions, with firms betting a lot on new applications and innovative ways to reach their clients or develop new products. Moreover, companies are keeping their internationalisation strategies and expanding to various markets around the world.
3) Family owned business IPOs
Regarding IPOs of family owned business, it is the sub-segment where we have the most difficulties in identifying empirical studies that addresses this specific topic. We can identify several motives for the reason why there are not many empirical studies addressing family owned business IPOs. As studied by Tremaine (2017), when a family owned business wants to raise capital there are several ways of achieving that without going public, such as issuing debt or raise capital from a private fund. It is also very challenging for a family owned company go public as families do not want to lose the control in the company or have obligations to meet the requirements that a public company must report.
Nonetheless, we still observe many family owned companies that took the challenge and decided to go public. Despite its downsides, there a lot of advantages for a family owned business to raise new equity through an IPO. Several studies and articles, Wagen (1999), Kenyon-Rouvinez (2011), Steen (2014) and Smith (2018, for the Financial Times), mention the advantages of families that go to an IPO: (1) liquidity to the company; (2) increases the visibility and media interest; (3) new opportunities to get access to capital (more advantageous types of debt); (4) increases the negotiating power of the company because the company can use shares as bargaining tools; (5) more ability to expand, have new suppliers and create new products and; (6) creation of a more effective corporate governance structure.
Regarding empirical research, there are two different main categories approached by most empirical papers. The first one is understanding what happened to the change in corporate governance and ownership following the IPO and, if the choice of issued shares (ordinary vs non-voting shares has an impact on the resulting ownership structure of the firm, and Körfgen
9 | P a g e Performance analysis of corporate events
(1997) and Ehrhardt and Nowak (2003). In both papers, the authors conclude that when a family owned business files for an IPO, the founding family owners tend to stay 10 or more years exercising considerable corporate control. Furthermore, both studies concluded that when a family company issues non-voting shares in their IPO (high concentration of voting rights), in the majority of the cases, this leads to negative abnormal returns. The second category that most of empirical papers analyse are abnormal returns’ event study, Jaskiewicz, González, Menéndez, Schiereck (2005) which studied the abnormal return of family owned businesses in Germany and Spain; Sadaqat, Akhtar and Ali (2011) studied the abnormal returns in Pakistan; and Bateni and Asghari (2014) studied the abnormal returns in Tehran. In the Pakistan and Tehran stock exchanges family owned businesses outperform the market but on Spanish and German stock exchanges there is a negative abnormal return of family owned companies’ shares.
However, the above mentioned studies are focused on the market performance and the abnormal returns of family owned business. This paper focuses on the operating and financial performance which differentiates substantially from previous studies. Credit Suisse (2007) released a report where it concluded that family owned businesses comfortably outperforming their peers in every region and sector, revenue and EBITDA growth is stronger, EBITDA margins are higher. Moreover, cash flow returns are better and momentum in gearing is moderate, and new investments are largely financed through organic cash flows or equity. However, another finding of this study is that family owned companies are weaker in
governance than non-family owned.
Methodology
Regarding the methodology, it had been prepared in three segments: Data, variables selection and empirical study. The data segment will present a detailed analysis on how the data was sourced for each financial corporate event and, consequently, treat it in order to be able to compute the empirical tests. For each financial corporate event, there was a different variation of the methodology applied when treating the data. For this reason, this segment has been divided in three sub segments, one for each corporate event. In the variables selection segment, the paper will mention which variables will be tested and the reasoning behind why they were chosen. In the empirical study section, it will explain the three empirical tests that were made in order to answer to our three research questions and understand the short term financial and operational impact of corporate events has on a firm’s performance.
10 | P a g e Performance analysis of corporate events
1) Data
a) Privatizations
The privatization data set was taken from World Bank repertoire which includes 447 companies that went private in Europe from 1987 to 2017. To investigate the short-term effect of the privatization on the different performance variables of each company, this paper gathers financial figures three years before and three years after each privatization takes place, since this was the proxy considered for short-term effect. To retrieve company’s financials, the sourcing of data was made from Compustat Capital IQ. Since this tool only allows for financials from the year 1988 onwards, the first privatization year considered was 1991, and 2014 considered as the last year from which the privatizations and the changes three years before and after can be investigated. To study the short-term effect on privatizations this paper considers all types of privatization (share issue privatisation restitution, direct asset sales, restitutions and voucher privatisation). The primary concern was to get the most observations as possible. However, in several cases, governments choose to dispose only a particular stake of the state owned firm to be privatised, so for the purpose of this paper we only consider the first privatisation of a state owned firm. The reasoning behind this is to see what is the full spectrum of impact, differences in strategy, and the way of operating between a hundred per cent state owned firm and a firm with private ownership.
A limitation of only considering the first privatisation of state owned firms, is that it reduces our dataset from 447 to 193 observations. Furthermore, data could not be retrieved for all companies, in all necessary years in the different categories to be investigated. This resulted in varying number of observations between 47 and 118.
b) Mergers & Acquisitions
For this specific corporate event, the paper considers several datasets, more specifically, one for each wave. Both the acquisitions and financials were sourced from Thomson Reuters Eikon platform. The platform only presents data since 1984, so Wave nº I (1890s-1903), II (1910s-1929) and III (1950s-1973) were not included in this analysis. Moreover, only the second half of Wave IV (1981-1989) was included.
In Wave nº IV, the data set includes 28 acquisitions, and depending on the variables the number of observations varies from 28 to 23 acquisitions. This short number of acquisitions is due to the fact that the analysis was only able to start in 1984 and not 1981 when Wave nº IV actually
11 | P a g e Performance analysis of corporate events
began. It is important to note that this number of observation is not statistically relevant, nevertheless, it is interesting to check the comparison of pre and post-acquisition performance, to give a slight indication of what were the main drivers of this wave. In this data set the minimum deal value is $511m when Hanson Trust a US-based textiles and apparel company acquired US industries, a US-based textiles company for $511m. The maximum deal value was the acquisition of Kodak, a US-based electronics company acquiring Sterling Drug, a US-based pharmaceutical company for $5.1bn.
The second data set created was Wave nº V, which includes 115 acquisitions from 1993 to 2000, and depending on the variables, the number of observations ranges from 70 to 58 acquisitions analyzed. The minimum deal value is the acquisition of Burlington Resources US-based Oil and Gas Company acquired Poco Petroleums a Canada-US-based Oil and Gas company for $2.5bn. The maximum deal value was $202.8bn when Vodafone Air Touch, a UK-based wireless company acquired the Germany-based wireless company, Mannesmann.
Furthermore, the paper jumps in to the creation of Wave nº VI data set, from 2003 to 2007, which includes 294 acquisitions, and depending on the variables, the observations vary from 219 and 211 acquisitions. The minimum deal value is $2.5bn when Medco Health Solutions, a US-based healthcare company acquired Medco Health Solutions also a US-based Healthcare company. The maximum deal value from the sample is the acquisition of Shell Transport and Trading, a UK-based Oil and Gas company by Royal Dutch Petroleum, a Netherlands-based Oil and Gas company for $95.4bn.
To finalize the construction of the M&A data set, the paper built Wave nº VII data set, from 2009 to 2017, including 366 acquisitions, and depending the variables, the observations range from 213 to 240 acquisitions. The minimum deal value is $2.5bn when Salix Pharmaceuticals, a US-based pharmaceutical company acquired Santarus, also, a US-based pharmaceutical company. The maximum deal value is the acquisition of SAB Miller a UK-based beverage company by Anheuser-Busch Inbev a Belgium-based beverage company for $110.6bn.
c) Family owned business IPOs
For construction of the family owned business IPO, the raw data set was based on a study conducted by the University of St. Gallen (Switzerland) in cooperation with EY Switzerland, in June 2017. The study is named Global Family Business Index and comprises the largest 500 family firms around the globe. The objective of this study was to show the impressive evidence of the economic power and relevance of family firms in the world. For this study I defined
12 | P a g e Performance analysis of corporate events
family owned business as a firm that started to be 100% owned by a family and went public with, at least, 50% stake before the IPO took place. From the 500 companies in the Global
Family Business Index, only 243 were companies that went public with a 50% stake owned by
the family, From these 243 companies, only 127 companies had disclosed financial information three years before and after the IPO took place. The first IPO date is 1981 with the IPO of Universal Health, a US-based healthcare company, and the last date is 2015 with the IPO of Schaefler, a Germany-based components producer for the automotive industry.
2) Variables selection
To measure performance, eleven variables were used. Below, this paper will make a brief explanation of these variables, their importance, and why they were included to test financial and operational performance of the short-term effect of corporate events.
a) Expansion rate
The expansion rate variable is defined by the total of property plant equipment (PP&E) a company holds in its books. Through PP&E we are able to identify if a company, after the corporate event studied, decided to take an expansion strategy where increased the number of factories, machines and stores. Through PP&E we also can observe if a company decided to expand to new markets, or at least speculate, assuming that the company will not open more factories and stores in regions where it is already present. In this study, it is expected that following an M&A, a company increases its PP&E values since it going to acquire also the fixed assets from the target company. There are, however, cases where the company incurs in too much leverage and doesn’t capture the expected synergies and, thus has to sell some PP&E to balance its accounts. In IPOs, an increase on PP&E is expected since the company issues new capital, most of the times, to expand its assets, develop its machinery and enter new markets. When studying privatisations, it is expected that a decrease in PP&E is verified, because when a state owned firm seeks social welfare, it must make some investments that, despite at times not being profitable, ensure the well-being of the population. As a result, when a company is privatised, its new owners may decide to divest some unprofitable investments to reach efficiency.
13 | P a g e Performance analysis of corporate events
The employment variable measures the total number of employees a company has. This variable will also assess which policy a company is following post corporate event studied. As a result of this, if a company is growing, the number of employees will tend to necessarily increase too. As the expansion rate variable I expect this value to increase in M&A and IPO cases, and decrease in the privatisation sample.
c) Investment efficiency
This variable is defined by return on invested capital (ROIC) and assesses a company’s efficiency at allocating the capital under its control to profitable investments. This variable gives a sense of how well a company is using its money to generate returns. After these three studied events, a company will usually have capital to make further investments. In an M&A scenario, a company already made the investment by acquiring other company, so it is interesting to observe if a company post corporate event will be able to use its money efficiently and take the right decisions. This variable will test the ability of a company to spend and generate money efficiently and understand the effectiveness of its management team on taking adequate decisions for the company.
d) Shareholders’ return
To measure the shareholders’ return the return on equity (ROE) was selected as relevant. ROE is calculated as net income over total shareholders’ equity. This variable is a key measure of how profitably a company employs its investment by the shareholders. This variable shows if theoretically a company decides to give all its net income to its shareholders, how much of it would be for each shareholder, so it is a measure of profitability.
e) Profitability
Profitability variable is defined by net income margin, meaning, net income divided by total sales. This ratio represents how much profit each dollar of sales generates, and fundamentally shows how profitable and efficient a company is, when considering not only its operational figures but also its ability to be financial competent. This is relevant since net income takes into consideration interests and other financial income and expenses. Since it is a measure of efficiency and profitability it makes sense to use this variable in such study.
14 | P a g e Performance analysis of corporate events
Efficiency variable is defined by total revenue over the total number of employees. This ratio shows how much money each employee generates for the firm. Ideally, a company wants the highest revenue per employee possible, since it indicates higher productivity and effective / efficient utilization of the firm’s resources. In essence, this ratio shows how efficient the asset utilisation of a firm is, measuring the financial productivity for each employee of the company. Finally, this ratio can also be seen as a proxy to measure how productive, innovative, and effective company’s resources (machinery, technology) are. This is because despite the efficiency of the employees playing a significant role, such would not be true if they did not have the adequate resources available.
g) Output
The output variable is defined by the total gross sales of a company. Since, this paper defined other variables that study how well a company is spending its money, from which the majority comes from sales, it is interesting to show how a company’s gross sales behaves after the corporate event. Gross sales could give a proxy of the ability of the company gaining market share against the competition, increase its sales through the expansion to new markets, or expand its product portfolio, and the ability to reach more customers. After a corporate event takes place, it is important to understand how the gross sales will react since the purpose of this corporate event is, in fact, to gain more visibility and increase market share.
h) Investment
This variable is characterised by Capital Expenditure (Capex) over sales. This ratio is a measure of company’s investment intensity. This is a very sensitive ratio because a high ratio could undermine the short term liquidity of the firm since Capex is a measure of the long term investment of the company. This will have a negative impact on the short term growth of the company. On the other hand, a low ratio can jeopardize the company’s future as well since it shows that the company is not investing in the long term. The reason why this ratio was chosen it is because gives a view what are the future strategy of a company is, and why they decided to undertake the corporate event. This ratio measures the level of investments a company is making in the future, and how aggressive the company is re-investing its revenue back into productive assets.
15 | P a g e Performance analysis of corporate events
Shareholders’ wealth variable is defined as the dividend per share a company give to its shareholders. If a company is able to maintain or increase its dividend policy, this could give a positive signal to the market regarding the company’s past financial health and its current financial stability. The reason behind the choice of this variable is to understand if after the corporate event, the company improve its dividend policy or not.
j) Liquidity
The liquidity variable is given by the total of net debt of the company. Net debt is computed by subtracting the total debt (short and long term) a company holds, by its cash and cash equivalents and its short term investments. Net debt is a measure of the ability of a company to repay its debt when due, indicating the overall debt situation of a company. This metric is a very important factor for an investor to take into consideration when investing in a company since it provides estimations if the company is over or under leveraged.
k) Leverage
Leverage variable is given by debt to assets ratio. This ratio indicates the percentage of assets that are being financed with debt rather than equity. The higher the ratio is, the greater the degree of leverage and financial risk. This ratio is commonly used by creditors to understand the ability the company has to repay its debt, and if they are able to handle it without too much added risk an additional increase in debt implies. Furthermore, investors use the ratio to make sure the company is solvent and is able to meet current and future obligations. This ratio also shows that, if a company needed to liquidate all its debt, what would be the percentage of assets a company would need to dispose of.
3) Empirical study
Using the clean data set, this paper created the first table and most important, since it is from this table that we are able to answer to the first two research questions formulated in the
Executive Summary of this paper. From this one will be able to understand the performance
and what are the main strategies that a company follows post a corporate event. The aforementioned table will be, in essence three tables: one for each corporate event, and these shall include:
The means of the three years before and after the corporate event were taken, and their difference was calculated to examine the change between the two averages. The mean and median of all means of the years before and after, and the change were calculated on each
16 | P a g e Performance analysis of corporate events
performance variable, previously mentioned. Furthermore, the number of companies that improved their average from before to after the corporate event was taken as a percentage of the total number of companies in the sample.
Finally, the results were tested using a nonparametric test called the Wilcoxon-rank-sum test or the Mann-Whitney U test. This test assesses whether the distributions of observations obtained between two separate groups on a dependent variable, are systematically different from one another. Developed by Franck Wilcoxon in 1945, this test replaces the obtained values of a dependent variable with a rank score, and inferentially tests whether the sum of the ranks within each group is likely to be obtained from the same population (if there are similarities between samples), or not. This test is often used, for instance, to test the effects of a new medicine has on a person, for example: a sample with persons with fever from 39 degrees to 42 degrees, after that the sample takes the new medicine and measure again the fever creating a second sample. If the sum of the first sample is statistically different from the second sample the null hypothesis is rejected, if not, the null hypothesis is not rejected. Taking this study into account again, the test was done for the averages before and after privatisation to understand if the sample before the corporate event will be statistically different from the sample after the corporate event. Furthermore, the paper also conducts a Z-test to understand if the percentage of companies that improved, is statistically significant or not, assuming a normal distribution of our sample.
For the second part of the research, this paper aims to answer to the third research question. In order to reach conclusions, a regression analysis was conducted to test which variables have explanatory power for the mean differences of the performance variables. Thus, the dependent variables consist on the mean change of the variables used as a proxy to measure performance improvements, i.e. Profitability, Output, Efficiency, Dividends, Employment, Leverage, and Investment. The independent variables consist of industry and region of established firm (old/new Europe) for the privatisation and continent for the M&A and IPOs of family owned businesses data sets. To further understand the significant improvements' change in the performance variables, this paper makes two different regressions: one for industries and another for the regions/continents. These two different categories will be the dummy variables of our regression. The main objective is to examine the relationship between the mean change of the performance variables (dependent variables) and our dummy variables, specifically; this paper aims to see if the post corporate event performance of a company depends of being from
17 | P a g e Performance analysis of corporate events
Results
This section outlines the results based on the conducted tests as explained above to see whether statistical inferences could be made regarding the firm's performance after the corporate event took place. First, the significance of the mean differences will be tested for the prior explained variables. Second, a regression analysis will test which of these variables, including some additional variables have explanatory power for the firm's improved performance.
1) Empirical tests (Wilcoxon test and Z-statistic) a) Privatisation
In the privatisation empirical study, this paper was able to find some significantly financial and operational improvements after a company shifts from being a state owned firm to a privatised company. The paper verified some expected efficiencies, but also some results that were not expected at the beginning of research. Table 1 summarizes the specific findings.
[Table 1]
Following a privatisation, 75% of the companies increase their PP&E values (expansion rate variable), meaning that after a privatisation, a company invests in its infrastructures and develops its machinery in the majority of the cases. This 75% of improvement is statistically significant at one per cent (Z-statistic significant), but there is no significance on the difference between samples (Wilcoxon test is not significant). However, if we look at the mean change, we verify that the PP&E value is highly negative following a privatisation, which could indicate that the biggest companies that went through privatisation processes had to reduce their PP&E. One can state this since the average considers the outliers (big companies), in contrast to the median that gives positive PP&E value, disregarding the outliers of the sample.
Analysing the Employment evolution pre and post the event, we verify that only 44% of the companies increase their number of employees, however, this variable is not statistically significant. Although it can give some signs that a company after being privatised cuts its non-profitable investments, it also worth mentioning that average and median differ where the mean has negative increase (-0.84 thousand) and the median records a positive increase (2.51 thousand).
Thirdly, we analyse the Profitability variable, which also gives a non-statistical significance. Only 55% increased its profitability after the privatisation, similarly to the employment
18 | P a g e Performance analysis of corporate events
variable, the mean and median differ where mean record a negatively improvement (-0.9%), and median registered a positive improvement (1.1%). In this variable also both differences between samples (Wilcoxon test) and significance on the improvement percentage (Z-Statistic) are non-statistically significant.
Efficiency, which gives the sales per employee, verifies a 67% increase post a privatisation
performance, which shows that in fact, a company increases efficiency after a privatisation. Despite the difference in samples being highly insignificant, there is significance regarding the percentage of companies that improved performance. Like previous variables, both mean and median register different patterns, with exactly same pattern negative on mean (-20.16 thousand) and positive on median (0.59 thousand).
Additionally, total sales (Output) variable has an increase of 63% after the event took place, this increase has a significant Z-Statistic at 5% confidence level, but its Wilcoxon test it is non-significant. This variable follows the same differences in pattern regarding mean and median. Further to this, Investment variable improves 58% of the cases but is insignificant for both tests. However in this variable both the median (1.1%) and the mean (2.4%) follow positive patterns.
Shareholder’s wealth, the variable that translates the total of dividends that company gives to
its investors, is the only variable in this sample that has both Wilcoxon test and Z-Statistic test significant at a one per cent level, showing that after the private investment, the private owners will try get some return back on the company that they invested in. This is because 75.6% per cent of the times, dividends increase after a privatisation event and also mean and median record positive change.
To conclude the first test on the privatisation event, we have the Leverage variable. In this figure we need to analyse in the opposite way from all the other variables studied because in this case is good to verify a negative performance, meaning that the company after the privatisation followed an unleveraged policy, because the mean and median difference is negative (-4.4% and 3.1%, respectively). However, as observed, companies increase their leverage policy 61% of the times. This variable only is significant for the Z-Statistic at 10% level.
19 | P a g e Performance analysis of corporate events
In the M&A empirical study, this paper was also able to find some significantly financial and operational improvements after a company acquires another company. The paper verified some expected efficiencies but also some results that were not expected in the beginning of the research. Table 2 summarizes our specific findings of M&A Wave nº IV, Table 3 is focused on Wave nº V, Table 4 lists Wave nº VI results and Table 5 outlines Wave nº VII results.
[Table 2]
In Wave nº IV, there are several variables that substantially increase performance after acquiring a company, such as: Efficiency (96%), Market Value (96%), Liquidity (86%), Net sales (82%), Leverage (82%), PP&E (79%), Investment (59%) and Shareholders’ Wealth (52%). The variables that did not improve more than half per cent of the times were: Profitability (46%), Employment (44%), Shareholders’ return (44%) and Investment efficiency (37%). Through the observation of this percentage we already can understand why firms follow M&A procedures because there are more variables that improved than variables that did not improve, more than half per cent of the times. In M&A Wave nº IV table, there are four variables that have statistically significance in the different samples before and after a takeover (Wilcoxon test) and, at the same time, are statistically significant on the percentage of improved firms (Z-Statistic). These variables are: Market value, Efficiency, Liquidity and Leverage. The only variable that is statistically significant in the Wilcoxon test but it is non-significant in the Z-Statistic is the Investment variable. Subsequently, the variable that has statistically significance on Z-Statistic and non-significance on the Wilcoxon test is the expansion rate variable. The remaining non mentioned variables, employment, shareholders’ return, investment efficiency, profitability, output and shareholders wealth are non-significant for both studied tests. To finalize we verify if the variables have the same pattern in terms of mean and median values of change. The variables that have the same positive pattern are PP&E, Market Value, Efficiency, Output, Liquidity, Leverage and Investment. On the reverse way, Shareholders’ return and Investment efficiency have the same negative pattern between mean and median values. Employment and Profitability have differences in pattern between mean and median, where mean records a positive value and median a negative value. For the Shareholders’ wealth mean has negative value but a positive median change between pre and post takeover.
20 | P a g e Performance analysis of corporate events
Regarding Wave nº V, as in Wave nº IV (despite some differences) we verify a substantial increase in performance after a takeover event. The studied variables that increase performance were: Output (97%), Market value (94%), Expansion rate (85%), Liquidity (81%), Efficiency (70%), Profitability (60%), Leverage (60%) and Shareholders’ wealth (53%). In contrast, the variables that did not improve more than half per cent of the times were: Shareholders’ return, Investment (36%) and Investment efficiency (33%). In Wave nº V case, we also observe a considerable positive difference between variables that improves performance comparing with variables that did not improve performance. In Table 3, we verify that Expansion rate, Market value, Employment, Efficiency, Output and Liquidity variables are statistical significance for the Wilcoxon and Z-Statistic tests. The Leverage variable is the only variable that is significant for the Wilcoxon test, but insignificant for the Z-Statistic. On the other hand, Investment efficiency, Shareholder’s returns and Investment are the variables. In Wave nº V, the only variables that are non-statistically significant for both tests are Profitability and Shareholder’s wealth. To conclude the analysis of Wave nº V, we verify that the variables that have mean and median changes with the same positive sign are: Expansion rate, Market expectations, Employment, Profitability, Efficiency, Output, Liquidity and Leverage. The variables with same negative sign on mean and median changes were Shareholder’s return and Investment efficiency. The only variable that records differences between the pattern of mean and median changes was Shareholder’s wealth with a mean being negative and median positive.
[Table 4]
Concerning, Wave nº VI we observed performance improvements in Output (94%), Expansion rate (93%), Liquidity (88%), Employment (88%), Efficiency (83%), Shareholders’ wealth (60%), Leverage (60%) and Profitability (52%) variables. Variables that did not improve its performance more than half per cent of the times were Investment (47%), Shareholder’s return (40%) and Investment efficiency (37%). There are seven variables that are statistically significant in both Wilcoxon and Z-Statistic tests, which are: Expansion rate, Market value, Employment, Efficiency, Output, Liquidity and Leverage. Shareholders’ return, Investment efficiency and shareholders’ wealth are statistically significant variables only for Z-Statistic test. The variables that are non-statistically significant for any of both tests are Profitability and Investment variable. To finalize we verify if the variables have the same pattern in terms of mean and median values of change, the variables that have the same positive pattern are Expansion Rate, Market Expectations, Employment, Efficiency, Output, Liquidity and Leverage. On the reverse way, Shareholders’ return, Investment efficiency and Investment
21 | P a g e Performance analysis of corporate events
have the same negative pattern between mean and median values. Profitability and Shareholders’ wealth has differences in pattern between mean and median, where mean records a negative value and median a positive value.
[Table 5]
Finally, in Wave nº VII there are several variables that substantially increase its performance after acquiring a company, such as: Expansion Rate (86%), Market Expectations (86%), Liquidity (85%), Employment (83%), Output (79%), Leverage (65%) Shareholders’ wealth (63%) and Investment (55%). The variables that did not improve more than half per cent of the times were: Efficiency (46%), Profitability (40%), Shareholders’ return (38%) and Investment efficiency (35%). Through the observation of this percentage we already can understand why firms follow M&A procedures because there are more variables that improved than variables that did not improve more than half per cent of the times. In M&A Wave nº VII table, there are six variables that have statistically significance in the different between samples before and after a takeover (Wilcoxon test) and, at the same time, is statistically significant on the percentage of improved firms (Z-Statistic), these variables are: Expansion Rate, Market Expectations, Employment, Output, Liquidity, and Leverage. There are a few variables that are statistically significant on Z-Statistic and non-significant on the Wilcoxon which are: Shareholders’ return, Investment efficiency, Profitability, Efficiency and Shareholders’ Wealth. The remaining non mentioned variable, Investment, is non-significant for both studied tests. To finalize we verify if the variables have the same pattern in terms of mean and median values of change, the variables that have the same positive pattern are Expansion Rate, Market Expectations, Employment, Output, Shareholder’s Wealth, Liquidity and Leverage. On the reverse way, Shareholders’ return, Investment efficiency and Profitability have the same negative pattern between mean and median values. Efficiency has differences in pattern between mean and median, where mean records a positive value and median a negative value. For Investment, mean has negative value but a positive median change between pre and post takeover.
c) Family owned business IPOs
Regarding IPO of family owned business, the empirical study was able to identify some improvements after family company issues equity through the capital markets. These improvements may lead to possible justifications as to why private owners decide to take their
22 | P a g e Performance analysis of corporate events
businesses private. Also, these results may help us understand what may be the main operational and financial consequences when a family owned company take an IPO.
[Table 6]
In family owned business results, there are seven variables that substantially increase its performance after acquiring a company, such as: Expansion rate (86%), Employment (75%), Efficiency (73%), Output (92%), Shareholders’ wealth (67%), Liquidity (55%) and Investment (51%). The variables that did not improve more than half per cent of the times were: Profitability (50%), Leverage (38%), Investment efficiency (30%), Shareholders’ return (24%). Through the observation of this percentage we already understand why family owned firms follow IPO procedures: there are more variables that improved than variables that did not improve more than half per cent of the times. In IPO’s table, there are five variables that have statistically significance in the different between samples before and after a takeover (Wilcoxon test) and, at the same time, are statistically significant on the percentage of improved firms (Z-Statistic), these variables are: Expansion rate, Employment, Efficiency, Output and Shareholders’ wealth. The only variable that is statistically significant in the Wilcoxon test, but it is non-significant in the Z-Statistic is the Liquidity variable. Subsequently, the variables that are statistically significance on Z-Statistic and non-significance on the Wilcoxon test are the Shareholders’ return, Investment efficiency and leverage. The remaining non mentioned variables, profitability and Investment are non-significant for both studied tests. To finalize we verify if the variables have the same pattern in terms of mean and median values of change, the variables that have the same positive pattern are PP&E, Employment, Profitability, Output, Liquidity and Investment. On the other hand, Shareholders’ return, Investment efficiency and Leverage have same negative pattern between mean and median values. Both variables have differences in pattern between mean and median, where mean records a positive value and median a negative value.
2) Regression
In this section this paper draws two different regressions: one regression with dummy variables representing the region the event took place, and other regression with dummies representing the industry the company is. The main reason to build these two regressions is to understand if a positive impact in the selected variables are dependent of any specific region or industry the event took place. From Table 7 to Table 12 there are the results to the regressions, the bold line in the table separates one regression from another regression
23 | P a g e Performance analysis of corporate events
a) Privatisation
[Table 7]
Privatisation results are presented in Table 7. In this table it was not possible to find any significance between the chosen dummy variables, and our selected performance variables. However, we can draw some conclusions based on the regression coefficients, despite of being robust and weak conclusions. In the PP&E variable, the values that registered the biggest negative performance are the Utilities sector and Old Europe region. The best performance following a privatisation is given by Telecommunications and New Europe. In terms of the Employment variable, the worse performance was given by the Utilities sector (negative impact) and Old Europe and the best performance is given by the Transportation sector and the New Europe region. Profitability variable registered highest negative performance in the Telecommunications sector and the best performance is in the Manufacturing industry, both in New Europe and Old Europe the coefficients are similar. Jumping to Efficiency variable, once again, Utilities sector recorded the worse and negative coefficient and the best performance was recorded by Telecommunications industry, Old Europe region also registered high negative coefficient. Regarding Output, the most best and worse coefficient was given by Telecommunications and Utilities industries, where Old Europe stands out for the negative reasons, once again. Shareholders’ wealth is affected positively if a company comes from the Telecommunications industry and by the negative if it is from the Trading industry, in terms of region there is no significant difference. A company that comes from Telecommunications segment has highest likelihood of increasing its leverage policy, while a company from Transportation decreases its Leverage, a company that is based in the Old Europe region has highest likelihood to decrease its Leverage policy than a company coming based in New Europe. To finalize, Investment variable is positively affected if it belongs to Utilities sector but if it comes from the Trading industry is going to be negatively affected, in this variable there is no significant difference between Old Europe or New Europe.
b) M&A
[Table 8]
In Table 8 this paper presents Wave nº IV results, in contrast to Privatisation results, these results are statistically significant values so we will focus on these figures. Shareholders’ return
24 | P a g e Performance analysis of corporate events
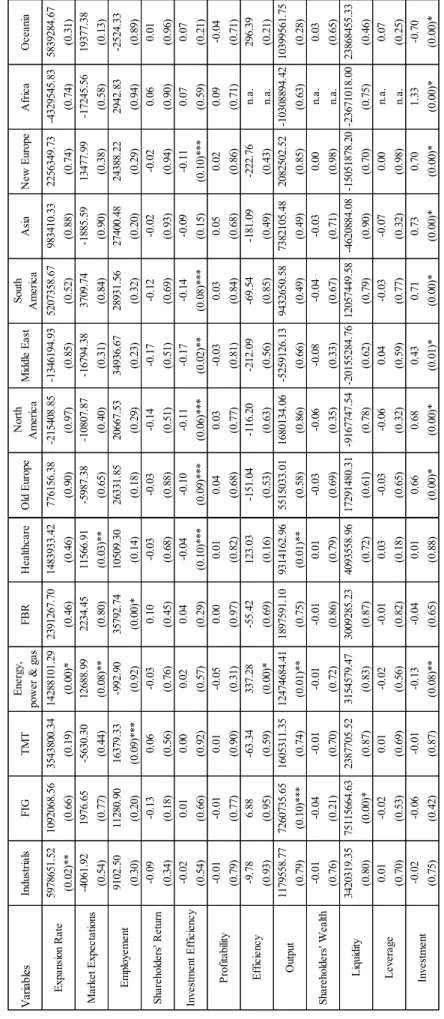
has five significant industry variables that may affect the takeover performance, when the acquisition comes from Industrials segment, its Shareholder return decreases 0.17 units, if a company belongs to FIG industry, its Shareholder return decreases 0.21 units. If it belongs to the Energy, Power and Gas industry or Food, Beverage and Retail (FBR) industry, the shareholder return after an acquisition will decrease 0.16 units and if a company belongs to the healthcare industry it will improve its shareholder return by 0.14 units. Regarding the Efficiency variable, only TMT industry increases 4,474 units when a company follows an M&A procedure. In the Shareholder’s wealth variable when a company from Energy, Power and Gas sector acquires a company its dividend policy decreases 0.02 units. Furthermore, if a company is based in North America its Shareholders’ wealth will decrease will 0.03. A company after a takeover decreases its Leverage if it belongs to the Industrials, Energy, Power and Gas and Food, Beverage and Retail industry by 0.19, 0.24 and 0.25 units, respectively. At the same time if a company belongs to the Healthcare industry or is an Oceania based company; its leverage will increase by 0.33 and 0.18, respectively. Last variable in the Wave nº IV regression that has statistically significance values is Investment variable. If a company belongs to the Energy, Power and Gas segment or it is a North America based company, the Investment performance will decrease 0.15 and 0.11 units, respectively. If a company is from Healthcare industry or it is headquartered in Oceania it Investment performance will increase 0.05 and 0.08 units, respectively.
[Table 9]
Secondly, we are going to analyse any dependency in Wave nº V. In Expansion rate variable, after a company acquired other company if it belongs to the Energy, Power and Gas industry, PP&E will increase 10.4 million units. In terms of Market value, this variable will increase 63,529 and decrease 53,826 if it belongs to Healthcare and Food Beverage and Retail industry, respectively. If a company is present in the Industrials segment its Investment efficiency will decrease 0.24 units. Regarding efficiency variable, if companies are from Energy, Power and Gas industry this variable would likely to increase 615 units. Jumping to the Output variable, this variable increased 11.9 million units if a company belongs to the Healthcare industry. In terms of Shareholders’ wealth, if a company is based in Old Europe or North America its dividends will decrease by 0.06 and 0.05 units, respectively, and increase 0.05 units if a company is based in Oceania. A company that belongs to FIG industry will increase its Liquidity variable by 56.9 million units after an M&A process. To conclude Wave nº V
25 | P a g e Performance analysis of corporate events
regression analysis, a company that is from TMT industry will increase its Leverage by 0.12 units after a takeover of a company.
[Table 10]
In Wave nº VI, if a company belongs to Industrials or Energy, Power and Gas its Expansion rate will likely increase to 5.9 and 14.2 million units following a takeover process. Regarding Market expectations, a company that acquires other company and it is from Energy, Power and Gas or Healthcare sector will likely increase its market value by 12,688 and 11,566 units. A company after a takeover process will likely increase its Employment strategy by 16,379 and 35,792, units if a company belongs to TMT and FBR, respectively. Jumping to Investment efficiency, a company that belongs to Healthcare or its based in Old Europe, North America, Middle East, South America and New Europe will likely to decrease its Investment efficiency by 0.10, 0.11, 0.17, 0.14, and 0.11 units, respectively. A company that is from Energy, Power and Gas has some likelihood of increasing its Efficiency by 337 units. If a firm belong to FIG, TMT and Healthcare sector will likely increase its Sales by 7.2, 12.5 and 9.3 million units, respectively after an M&A process. In terms of Liquidity, this paper observes that a firm from FIG industry increases its Net Debt by 7.2 million units. Concluding Wave nº VI regression analysis, this paper verify that a company from Energy, Power and Gas industry or headquartered in Oceania will likely decrease its Investment strategy by 0.13 and 0.70 units, respectively. Also it will increase its Investment policy if the company is based in Old Europe, North America, Middle East, South America, Asia, New Europe or Asia by 0.66, 0.68, 0.43, 0.71, 0.73, 0.70 and 1.33 units, respectively.
[Table 11]
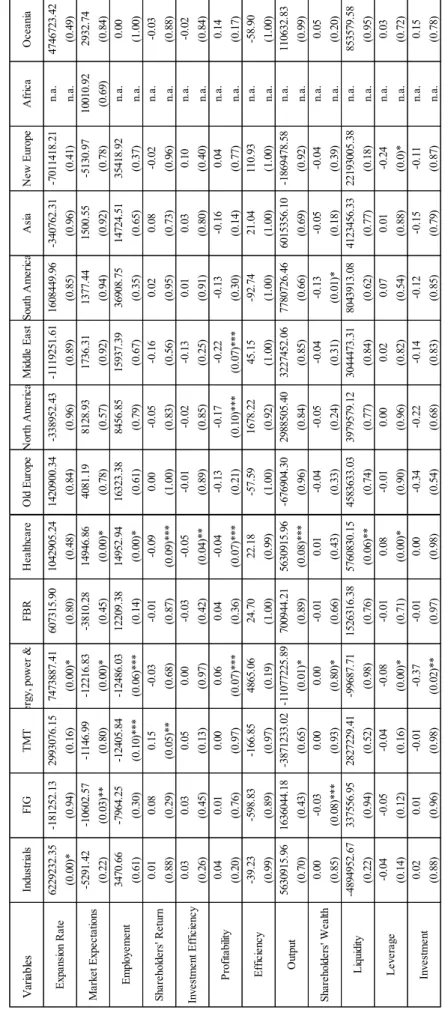
Our last regression analysis in the M&A section is Wave nº VII. In this wave we observed that when a company follows a takeover process, it will likely increase its Expansion rate if it is from Industrials, and Energy, Power and Gas by 6.2 and 7.4 million units. Regarding Market value variable, a company from FIG and Energy, Power and Gas will likely decrease its value by 10,602 and 12,216 units, also it will increase its Market Value if belongs to the Healthcare industry by 14,946 units. Regarding Employment variable, this value will increase by 14,952 units if a company operates in the Healthcare segment, and it is likely to decrease if operates in the TMT or Energy, Power and Gas industry by 12,405 and 14,486 units. In terms of Shareholder return, this value will probably increase if the company operates in the TMT sector by 0.15 units and decrease 0.09 units if a company is from Healthcare industry. Investment
26 | P a g e Performance analysis of corporate events
efficiency variable decreases 0.05 units if a company belongs to the Healthcare sector, after a takeover process. If a company belongs to the Energy, Power and Gas it is likely to increase its Profitability by 0.06, and if it is from Healthcare or it is based in North America or Middle East the company will decrease its Profitability by 0.04, 0.17, 0.22 units, respectively. Regarding Output variable, if a company is from Energy, Power and Gas is likely to decrease its sales by 11.1 million units but if operates in the Healthcare segment its sales might go up by 5.6 million units after acquiring other company. Shareholders’ wealth is likely to go down if a company comes from FIG sector or it is headquartered in South America, and similarly, if it comes from Energy, Power and Gas its performance will stay the same. After a takeover process, a company which belongs to the Healthcare industry will increase it Net Debt by 5.7 million units. Regarding Leverage, a company operating in the Energy, Power and Gas sector or based in New Europe will likely decrease its leverage policy by 0.08 and 0.24 units respectively, however a company from Healthcare it will increase its Leverage by 0.08 units. Last variable with statistically significant results after a takeover process is Investment variable, that is likely to decrease 0.37 units if the company operates in the Energy, Power and Gas industry
c) IPO of family owned business
The last corporate event that the regression analysed is the IPO of family owned business. Table 12 presents the results of the regression, where one can find some statistically significant coefficients, which allow for the identification of a pattern between the performance variables and countries / regions.
[Table 12]
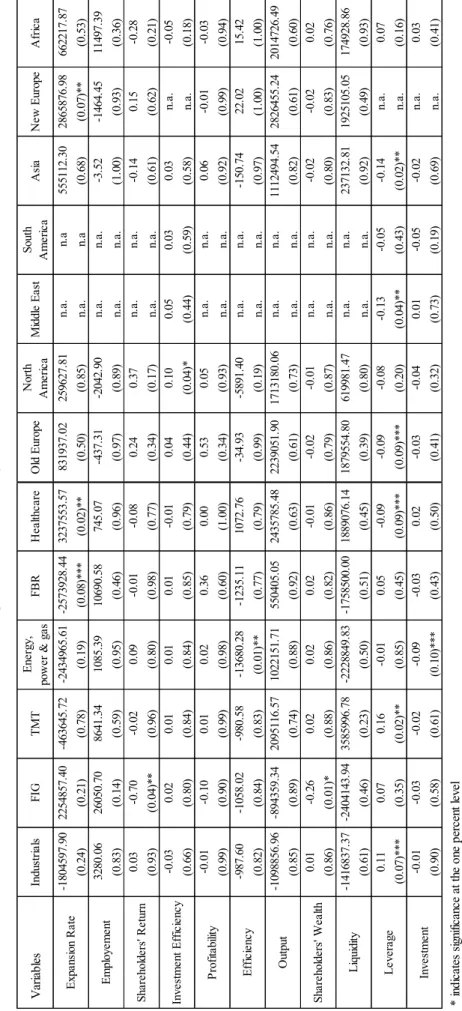
The first variable with statistically significant coefficient is Expansion rate, where we can identify that, post an IPO, a company from FBR sector is likely to decrease its PP&E value by 2.5 million units, however, if a company goes public from a Healthcare industry or is based in New Europe, its PP&E value might increase 3.2 and 2.8 million units. A family company that goes through an IPO process will likely decrease its Shareholders’ return by 0.70 units if it operates in the FIG industry. If a family business is based in North America region its Investment efficiency will increase 0.10 units after the company goes public. In terms of Efficiency, a company that company from Energy, Power and Gas will likely decrease this variable by 13,680 units. Regarding Shareholders’ wealth it is likely to decrease 0.26 units if a company belongs to the FIG industry. Leverage performance variable will increase 0.11 and 0.16 if a company operates in the Industrials or TMT sector, respectively. However, it is likely
27 | P a g e Performance analysis of corporate events
to decrease its performance if present in the Healthcare segment or if it is headquartered in Old Europe, Middle East or Asia by 0.09, 0.09, 0.13 and 0.14 units, respectively. To finalize, Investment variable will likely decrease 0.09 units after the family company goes public, operating in the Energy, Power and Gas sector.
Discussion
In this section, this paper will further elaborate on the reasoning for the results mentioned on the previous chapter. This analysis finds significant and interesting results and as a result, it is important to understand the main reasons, or ultimately, suggest reasons to explain the given results. The results suggest that, in fact, there is financial and operating motivation for the owners and managers follow Privatisations, M&A and family owned businesses to go public. Nonetheless, there is still margin to improve and the aforementioned shareholders should take into consideration several factors when they decide to follow such corporate action, namely:
1) Privatisations
Following a Privatisation process, this paper was able to identify several financial and operating performance variables. The results showed that, in fact, a state owned firm does not have the same objectives as private company. The first and main difference is the fact that state owned firms do not look for profit maximisation. Instead, they seek social welfare. Second difference is in terms of return to the shareholders. A company owned by the state is not looking to return profits to its owners. On the other hand, a private company with private investors is constantly focused in delivering return to its shareholders to compensate their investment in the company. Lastly, one other major difference between private and state owned firms, is the fact that public companies, when issuing debt to finance operations, have to understand if this new issuing of debt is indirectly influencing the overall public deficit of the state, and respective country. On the other hand, the company only really focuses on it if the issuance of the new debt is going to affect its financial stability, being much easier issuing new debt in a private company than in a state owned company.
Expansion rate variable improves 75% on Privatisations cases, against one’s expectations. Despite having a positive median change, between before and after the privatisation process, this paper got negative mean change results, which can imply that big companies (because mean values fail to eliminate outliers), in fact, cut some inefficient and profit loss businesses, supporting the idea that when a company gets privatised, it eliminates businesses that were part of the state owned company, solely to ensure the social welfare of citizens. Other results that