HUMAN IMPACTS
Moving in the Anthropocene:
Global reductions in terrestrial
mammalian movements
Marlee A. Tucker,1,2* Katrin Böhning-Gaese,1,2William F. Fagan,3,4John M. Fryxell,5 Bram Van Moorter,6Susan C. Alberts,7Abdullahi H. Ali,8Andrew M. Allen,9,10 Nina Attias,11Tal Avgar,12Hattie Bartlam-Brooks,13Buuveibaatar Bayarbaatar,14 Jerrold L. Belant,15Alessandra Bertassoni,16Dean Beyer,17Laura Bidner,18 Floris M. van Beest,19Stephen Blake,20,21Niels Blaum,22Chloe Bracis,1,2 Danielle Brown,23P. J. Nico de Bruyn,24Francesca Cagnacci,25,26
Justin M. Calabrese,3,27Constança Camilo-Alves,28,29Simon Chamaillé-Jammes,30 Andre Chiaradia,31,32Sarah C. Davidson,33,20Todd Dennis,34Stephen DeStefano,35 Duane Diefenbach,36Iain Douglas-Hamilton,37,38Julian Fennessy,39Claudia Fichtel,40 Wolfgang Fiedler,20Christina Fischer,41Ilya Fischhoff,42Christen H. Fleming,3,27 Adam T. Ford,43Susanne A. Fritz,1,2Benedikt Gehr,44Jacob R. Goheen,45
Eliezer Gurarie,3,46Mark Hebblewhite,47Marco Heurich,48,49A. J. Mark Hewison,50 Christian Hof,1Edward Hurme,3Lynne A. Isbell,18,51René Janssen,52Florian Jeltsch,22 Petra Kaczensky,6,53Adam Kane,54Peter M. Kappeler,40Matthew Kauffman,55
Roland Kays,56,57Duncan Kimuyu,58Flavia Koch,40,59Bart Kranstauber,44Scott LaPoint,20,60 Peter Leimgruber,27John D. C. Linnell,6Pascual López-López,61A. Catherine Markham,62 Jenny Mattisson,6Emilia Patricia Medici,63,64Ugo Mellone,65Evelyn Merrill,12
Guilherme de Miranda Mourão,66Ronaldo G. Morato,67Nicolas Morellet,50 Thomas A. Morrison,68Samuel L. Díaz-Muñoz,69,70Atle Mysterud,71
Dejid Nandintsetseg,1,2Ran Nathan,72Aidin Niamir,1John Odden,73Robert B. O’Hara,1,74 Luiz Gustavo R. Oliveira-Santos,75Kirk A. Olson,14Bruce D. Patterson,76
Rogerio Cunha de Paula,67Luca Pedrotti,77Björn Reineking,78,79Martin Rimmler,80 Tracey L. Rogers,81Christer Moe Rolandsen,6Christopher S. Rosenberry,82 Daniel I. Rubenstein,83Kamran Safi,20,84Sonia Saïd,85Nir Sapir,86Hall Sawyer,87 Niels Martin Schmidt,19,88Nuria Selva,89Agnieszka Sergiel,89Enkhtuvshin Shiilegdamba,14 João Paulo Silva,90,91,92Navinder Singh,9Erling J. Solberg,6Orr Spiegel,93Olav Strand,6 Siva Sundaresan,94Wiebke Ullmann,22Ulrich Voigt,95Jake Wall,37David Wattles,35 Martin Wikelski,20,84Christopher C. Wilmers,96John W. Wilson,97George Wittemyer,37,98 Filip Zięba,99Tomasz Zwijacz-Kozica,99Thomas Mueller1,2,27*
Animal movement is fundamental for ecosystem functioning and species survival, yet the effects of the anthropogenic footprint on animal movements have not been estimated across species. Using a unique GPS-tracking database of 803 individuals across
57 species, we found that movements of mammals in areas with a comparatively high human footprint were on average one-half to one-third the extent of their movements in areas with a low human footprint. We attribute this reduction to behavioral changes of individual animals and to the exclusion of species with long-range movements from areas with higher human impact. Global loss of vagility alters a key ecological trait of animals that affects not only population persistence but also ecosystem processes such as predator-prey interactions, nutrient cycling, and disease transmission.
W
ith approximately 50 to 70% of Earth’s
land surface currently modified for
hu-man activities (
1), patterns of
biodiver-sity and ecosystem functions worldwide
are changing (
2). The expanding
foot-print of human activities not only is causing the
loss of habitat and biodiversity, but is also
affect-ing how animals move through fragmented and
disturbed habitats. The extent to which animal
movements are affected by anthropogenic effects
on the structure and composition of landscapes
and resource changes has been explored only in
local geographic regions or within single species.
Such studies typically report decreasing animal
movements
—for example, as a result of habitat
fragmentation, barrier effects, or resource changes
(
3–6)—with only a few studies reporting longer
movements as a result of habitat loss or altered
migration routes (
7, 8).
We conducted a global comparative study of
how the human footprint affects movements of
terrestrial nonvolant mammals, using Global
Po-sitioning System (GPS) location data of 803
in-dividuals from 57 mammal species (Fig. 1 and
table S2). Mean species mass ranged from 0.49
to 3940 kg and included herbivores, carnivores,
and omnivores (
n = 28, 11, and 18 species,
respec-tively). For each individual, we annotated
loca-tions with the Human Footprint Index (HFI), an
index with a global extent that combines multiple
proxies of human influence: the extent of built
environments, crop land, pasture land, human
population density, nighttime lights, railways,
roads, and navigable waterways (
9) (see
supple-mentary materials for details). The HFI ranges
from 0 (natural environments: e.g., the Brazilian
Pantanal) to 50 (high-density built environments:
e.g., New York City).
In addition to the human footprint, we included
other covariates that are known to influence
mammalian movements. Because individuals may
need to cover a larger area to gather sufficient
resources, mammals generally move farther in
environments with lower productivity (
10). To
capture this effect, we annotated locations with
the Normalized Difference Vegetation Index (NDVI),
a well-established, satellite-derived measure of
resource abundance for both herbivores and
car-nivores (
11). Because an allometric scaling
rela-tionship shows that animals of greater body size
usually move farther (
12), and because diet may
influence movements as a result of differences in
foraging costs and availability of resource types
(
13, 14), we annotated the database with species
averages for body size and dietary guild (i.e.,
car-nivore, herbivore, or omnivore).
We then calculated displacements as the
dis-tance between subsequent GPS locations of each
individual at nine time scales (15) ranging from
1 hour to 10 days. For each individual at each
time scale, we calculated the 0.5 and 0.95
quan-tile of displacement. The combination of different
time scales and quantile allowed us to examine
the effect of the human footprint on both the
median (0.5 quantile) and long-distance (0.95
quan-tile) movements for within-day movements (e.g.,
1-hour time scale) up to longer time
displace-ments of more than 1 week (e.g., 10-day time
scale). We used linear mixed-effects models that,
in addition to all covariates (i.e., NDVI, body mass,
diet), also accounted for taxonomy and spatial
autocorrelation (see supplementary materials for
details).
We found strong negative effects of the human
footprint on median and long-distance
displace-ments of terrestrial mammals (Fig. 2, Fig. 3A, and
table S3). Displacements of individuals (across
species) living in areas of high footprint (HFI =
36) were shorter than displacements of
individ-uals living in areas of low footprint (HFI = 0) by as
much as a factor of 3. For example, median
dis-placements for carnivores over 10 days were 3.3 ±
1.4 km (SE) in areas of high footprint versus
6.9 ± 1.3 km in areas of low footprint (Fig. 2A
and table S3). Likewise, the maximum
displace-ment distances for carnivores at the 10-day scale
averaged 6.6 ± 1.4 km in areas of high footprint
versus 21.5 ± 1.4 km in areas of low footprint
(Fig. 2B and table S3). The effect was
signifi-cant on all temporal scales with 8 hours or more
between locations.
on January 25, 2018
http://science.sciencemag.org/
The effect was not significant at shorter time
scales (Fig. 3A, 1 to 4 hours), which suggests that
the human footprint affects ranging behavior
and area use over longer time scales, rather than
altering individual travel speeds (i.e.,
individ-uals may travel at the same speed if measured
across short time intervals, but have more
tor-tuous movements in areas of higher human
footprint and thus remain in the same locale if
displacement is measured across longer time
intervals).
Reduction in movement may be attributable
to (i) an individual-behavioral effect, where
in-dividuals alter their movements relative to the
human footprint, or (ii) a species occurrence
ef-fect, where certain species that exhibit long-range
movement simply do not occur in areas of high
human footprint. To disentangle these two effects,
we ran additional models where we separated the
HFI into two components: (i) the
individual-behavioral effect represented by the individual
variability of HFI relative to the species mean
(i.e., the individual HFI minus the species mean
HFI), and (ii) the species occurrence effect as the
mean HFI for each species. Results from the
two-component model indicate behavioral as well as
species effects. We found a significant behavioral
effect on median displacements and on
long-distance displacements (0.95 quantile) at most
time scales (from 8 hours to 10 days) (fig. S2A
and table S4). The species occurrence effect was
significant only over longer time scales (128- and
256-hour periods, or 5 and 10 days, respectively)
(fig. S2B and table S4). However, we note that the
estimate of the species occurrence effect is
con-servative because our model incorporated
taxon-omy as a random effect. Some variability in the
data may have been accounted for by the
species-level random effect rather than the species-species-level
HFI (see table S3).
In addition to the human footprint effect, body
mass, dietary guild, and resource availability were
also related to movement distances. First, as
ex-pected from allometric scaling and established
relationships of body size with home range size
(
14) and migration distance (16), larger species
traveled farther than smaller species (Fig. 3C
and tables S3 and S4). Second, we found a negative
Tuckeret al., Science 359, 466–469 (2018) 26 January 2018 2 of 4
1Senckenberg Biodiversity and Climate Research Centre, Senckenberg Gesellschaft für Naturforschung, 60325 Frankfurt (Main), Germany.2Department of Biological Sciences, Goethe University, 60438 Frankfurt (Main), Germany.3Department of Biology, University of Maryland, College Park, MD 20742, USA.4SESYNC, University of Maryland, Annapolis, MD 21401, USA.5Department of Integrative Biology, University of Guelph, Guelph, Ontario N1G 2W1, Canada.6Norwegian Institute for Nature Research, P.O. Box 5685 Torgard, NO-7485 Trondheim, Norway.7Departments of Biology and Evolutionary Anthropology, Duke University, Durham, NC 27708, USA.8Hirola Conservation Programme, Garissa, Kenya.9Department of Wildlife, Fish and Environmental Studies, Swedish University of Agricultural Sciences, Umeå 90183, Sweden.10Institute for Water and Wetland Research, Department of Animal Ecology and Physiology, Radboud University, 6500GL Nijmegen, Netherlands.11Ecology and Conservation Graduate Program, Federal University of Mato Grosso do Sul, Campo Grande, MS, Brazil.12Department of Biological Sciences, University of Alberta, Edmonton, Alberta, Canada.13Structure and Motion Laboratory, Royal Veterinary College, University of London, London NW1 0TU, UK.14Wildlife Conservation Society, Mongolia Program, Ulaanbaatar, Mongolia.15Carnivore Ecology Laboratory, Forest and Wildlife Research Center, Mississippi State University, Box 9690, Mississippi State, MS, USA.16Animal Biology Postgraduate Program, São Paulo State University, São José do Rio Preto, SP 15054-000, Brazil.17Michigan Department of Natural Resources, 1990 U.S. 41 South, Marquette, MI 49855, USA.18Department of Anthropology, University of California, Davis, CA 95616, USA.19Department of Bioscience, Aarhus University, 4000 Roskilde, Denmark.20Max Planck Institute for Ornithology, Vogelwarte Radolfzell, D-78315 Radolfzell, Germany.21Wildlife Conservation Society, Bronx, NY 10460, USA.22University of Potsdam, Plant Ecology and Nature Conservation, 14476 Potsdam, Germany.23Department of Biology, Middle Tennessee State University, Murfreesboro, TN 37132, USA.24Mammal Research Institute, Department of Zoology and Entomology, University of Pretoria, Hatfield 0028, Gauteng, South Africa.25Department of Biodiversity and Molecular Ecology, Research and Innovation Centre, Fondazione Edmund Mach, 38010 San Michele all’Adige (TN), Italy.26Department of Organismic and Evolutionary Biology, Harvard University, Cambridge, MA 02138, USA.27Smithsonian Conservation Biology Institute, National Zoological Park, Front Royal, VA, USA.28Departamento de Fitotecnia, Universidade de Évora, Pólo da Mitra, 7002-554 Évora, Portugal.29ICAAM–Institute of Mediterranean Agricultural and Environmental Sciences, University of Évora, Évora, Portugal. 30Centre d’Ecologie Fonctionnelle et Evolutive UMR 5175, CNRS–Université de Montpellier–Université Paul-Valéry Montpellier–EPHE, 34293 Montpellier Cedex 5, France.31Phillip Island Nature Parks, Victoria, Australia.32School of Biological Sciences, Monash University, Melbourne, Australia.33Department of Civil, Environmental and Geodetic Engineering, Ohio State University, Columbus, OH 43210, USA.34Department of Biology, Fiji National University, P.O. Box 5529, Natabua, Lautoka, Fiji Islands.35U.S. Geological Survey, Massachusetts Cooperative Fish and Wildlife Research Unit, University of Massachusetts, Amherst, MA 01003, USA.36U.S. Geological Survey, Pennsylvania Cooperative Fish and Wildlife Research Unit, Pennsylvania State University, University Park, PA 16802, USA.37Save the Elephants, P.O. Box 54667, Nairobi 00200, Kenya.38Department of Zoology, University of Oxford, Oxford OX1 3PS, UK.39Giraffe Conservation Foundation, P.O. Box 86099, Eros, Namibia.40German Primate Center, Behavioral Ecology and Sociobiology Unit, 37077 Göttingen, Germany. 41Restoration Ecology, Department of Ecology and Ecosystem Management, Technische Universität München, 85354 Freising, Germany.42Cary Institute of Ecosystem Studies, Millbrook, NY 12545, USA.43Irving K. Barber School of Arts and Sciences, Unit 2: Biology, University of British Columbia, Okanagan Campus, Kelowna, BC V1V 1V7, Canada. 44Department of Evolutionary Biology and Environmental Studies, University of Zurich, 8057 Zurich, Switzerland.45Department of Zoology and Physiology, University of Wyoming, Laramie, WY 82071, USA.46School of Environmental and Forest Sciences, University of Washington, Seattle, WA 98195, USA.47Wildlife Biology Program, Department of Ecosystem and Conservation Sciences, College of Forestry and Conservation, University of Montana, Missoula, MT 59812, USA.48Bavarian Forest National Park, Department of Conservation and Research, 94481 Grafenau, Germany.49Chair of Wildlife Ecology and Management, Albert Ludwigs University of Freiburg, 79106 Freiburg, Germany.50CEFS, Université de Toulouse, INRA, Castanet Tolosan, France.51Animal Behavior Graduate Group, University of California, Davis, CA 95616, USA.52Bionet Natuuronderzoek, 6171EL Stein, Netherlands.
53Research Institute of Wildlife Ecology, University of Veterinary Medicine Vienna, A-1160 Vienna, Austria.54School of Biological, Earth and Environmental Sciences, University College Cork, Cork, Ireland.55U.S. Geological Survey, Wyoming Cooperative Fish and Wildlife Research Unit, Department of Zoology and Physiology, University of Wyoming, Laramie, WY, USA. 56North Carolina Museum of Natural Sciences, Raleigh, NC 27601, USA.57Department of Forestry and Environmental Resources, North Carolina State University, Raleigh, NC 27695, USA.58Department of Natural Resource Management, Karatina University, P.O. Box 1957-10101, Karatina, Kenya.59Department of Psychology, University of Lethbridge, Lethbridge, Alberta T1K 3M4, Canada.60Lamont-Doherty Earth Observatory, Columbia University, Palisades, NY 10964, USA.61Cavanilles Institute of Biodiversity and Evolutionary Biology, Terrestrial Vertebrates Group, University of Valencia, E-46980 Paterna, Valencia, Spain.62Department of Anthropology, Stony Brook University, Stony Brook, NY 11794, USA. 63International Union for Conservation of Nature (IUCN) Species Survival Commission (SSC) Tapir Specialist Group (TSG), Rua Licuala, 622, Damha 1, Campo Grande, CEP: 79046-150, Mato Grosso do Sul, Brazil.64IPÊ (Instituto de Pesquisas Ecológicas; Institute for Ecological Research), Caixa Postal 47, Nazaré Paulista, CEP: 12960-000, São Paulo, Brazil. 65Vertebrates Zoology Research Group, Departamento de Ciencias Ambientales y Recursos Naturales, University of Alicante, Alicante, Spain.66Embrapa Pantanal, Corumbá, MS 79320-900, Brazil.67National Research Center for Carnivores Conservation, Chico Mendes Institute for the Conservation of Biodiversity, Atibaia-SP 12952-011, Brazil.68Institute of Biodiversity, Animal Health and Comparative Medicine, University of Glasgow, Glasgow, UK.69Center for Genomics and Systems Biology, Department of Biology, New York University, New York, NY 10003, USA.70Department of Microbiology and Molecular Genetics, University of California, Davis, CA 95616, USA.71Centre for Ecological and Evolutionary Synthesis, Department of Biosciences, University of Oslo, Blindern, NO-0316 Oslo, Norway.72Movement Ecology Laboratory, Department of Ecology, Evolution and Behavior, Alexander Silberman Institute of Life Sciences, Hebrew University of Jerusalem, Jerusalem 91904, Israel.73Norwegian Institute for Nature Research, NO-0349 Oslo, Norway.74Department of Mathematical Sciences and Centre for Biodiversity Dynamics, Norwegian University of Science and Technology (NTNU), 7491 Trondheim, Norway.75Department of Ecology, Federal University of Mato Grosso do Sul, Campo Grande, MS 79070-900, Brazil.76Integrative Research Center, Field Museum of Natural History, Chicago, IL 60605, USA.77Consorzio Parco Nazionale dello Stelvio, Bormio (Sondrio), Italy.78Univ. Grenoble Alpes, Irstea, UR LESSEM, BP 76, 38402 St-Martin-d’Hères, France.79University of Bayreuth, BayCEER, 95447 Bayreuth, Germany. 80Nationalpark Schwarzwald, 77889 Seebach, Germany.81Evolution and Ecology Research Centre and School of Biological, Earth and Environmental Sciences, University of New South Wales, Sydney, NSW 2052, Australia.82Pennsylvania Game Commission, Harrisburg, PA 17110, USA.83Department of Ecology and Evolutionary Biology, Princeton University, Princeton, NJ 08544, USA.84Department of Biology, University of Konstanz, 78467 Konstanz, Germany.85Directorate of Studies and Expertise (DRE), Office National de la Chasse et de la Faune Sauvage, Montfort, 01330 Birieux, France.86Department of Evolutionary and Environmental Biology, University of Haifa, 3498838 Haifa, Israel.87Western Ecosystems Technology Inc., Laramie, WY 82070, USA.88Arctic Research Centre, Aarhus University, 8000 Aarhus C, Denmark.89Institute of Nature Conservation Polish Academy of Sciences, 31-120 Krakow, Poland.90REN Biodiversity Chair, CIBIO/InBIO Associate Laboratory, Universidade do Porto, Campus Agrário de Vairão, 4485-661 Vairão, Portugal.91Centre for Applied Ecology“Prof. Baeta Neves”/InBIO Associate Laboratory, Instituto Superior de Agronomia, Universidade de Lisboa, Tapada da Ajuda, 1349-017 Lisbon, Portugal.92Centre for Ecology, Evolution and Environmental Changes, Faculdade de Ciências da Universidade de Lisboa, Campo Grande, 1749-016 Lisbon, Portugal.93Department of Environmental Science and Policy, University of California, Davis, CA, USA.94Jackson Hole Conservation Alliance, Jackson, WY 83001, USA.95Institute for Terrestrial and Aquatic Wildlife Research, University of Veterinary Medicine Hannover-Foundation, 30173 Hannover, Germany.96Center for Integrated Spatial Research, Environmental Studies Department, University of California, Santa Cruz, CA 95060, USA. 97Department of Zoology and Entomology, University of Pretoria, Hatfield 0028, South Africa.98Department of Fish, Wildlife and Conservation Biology, Colorado State University, Fort Collins, CO 80523, USA.99Tatra National Park, 34-500 Zakopane, Poland.
*Corresponding author. Email: [email protected] (M.A.T.); [email protected] (T.M.) RESEARCH | REPORT
on January 25, 2018
http://science.sciencemag.org/
Latitude
Longitude
50
Human Footprint Index
−20
0
20
40
60
−100
−50
0
50
100
150
−40
Displacement (km)
0.1
10
100
40
30
0
1
2
0
0
Image © 2016 DigitalGlobe Google™ earth Image Landsat
Image © 2016 Google © 2009 GeoBasis-DE/BKG
Fig. 1. Locations from the GPS tracking database and the Human Footprint Index. (A) GPS relocations of 803 individuals across 57 species plotted on the global map of the Human Footprint Index (HFI) spanning from 0 (low; yellow) to 50 (high; red). (B) Examples of landscapes under HFI = 2 (the Pantanal, Brazil), HFI = 20 (Bernese Alps, Switzerland), HFI = 30 (Freising, Germany), and HFI = 42 (Albany, New York). (C) Species averages of 10-day long-distance displacement (0.95 quantile of individual displacements). Species (from top to bottom): Mongolian wild ass (Equus hemionus hemionus), Mongolian
gazelle (Procapra gutturosa), giraffe (Giraffa camelopardalis), wolverine (Gulo gulo), muskox (Ovibos moschatus), African forest elephant (Loxodonta africana cyclotis), African buffalo (Syncerus caffer), wolf (Canis lupus), brown bear (Ursus arctos), maned wolf (Chrysocyon brachyurus), coyote (Canis latrans), leopard (Panthera pardus), wildcat (Felis silvestris), yellow baboon (Papio cynocephalus), tapir (Tapirus terrestris), roe deer (Capreolus capreolus), wild boar (Sus scrofa), European hare (Lepus europaeus), brushtail possum (Trichosurus vulpecula).
Fig. 2. Mammalian displacement in relation to the Human Footprint Index. (A) Median displacements; (B) long-distance (0.95 quantile) displacements. Both displacements decline with increasing HFI at the 10-day scale (n = 48 species and 624 individuals). Plots include a smoothing line from a locally weighted polynomial regression. An HFI value of 0 indicates areas of low human footprint; a value of 40 represents areas of high human footprint.
on January 25, 2018
http://science.sciencemag.org/
relationship between resource availability and
displacement distance, such that movements
were on average shorter in environments with
higher resources (Fig. 3B and tables S3 and S4).
These results are consistent with reports of larger
home range size (
17) and longer migration
dis-tance (
18) in mammals living in resource-poor
environments. Finally, our analyses showed that
carnivores traveled on average farther per unit
time than herbivores and omnivores (tables S3
and S4). These results concur with prior
un-derstanding that carnivores have larger home
range sizes (14) because they need to find mobile
prey and compensate for energy conversion loss
through the food web. For all of these variables,
effects were significant across time scales longer
than 8 hours for both median and long-distance
displacements.
The reduction of mammalian movements in
areas of high HFI likely stems from two
nonex-clusive mechanisms: (i) movement barriers such
as habitat change and fragmentation (
19, 20) and
(ii) reduced movement requirements
attribut-able to enhanced resources [e.g., crops,
supple-mental feeding, and water sources (
5, 21)]. Studies
have shown both mechanisms at work with
vary-ing responses across populations or species (see
table S5 for examples). In some cases, they act
together on single individuals or populations.
For example, red deer in Slovenia have smaller
home ranges because of the enhancement of
re-sources via supplemental feeding and the
distur-bance and fragmentation caused by the presence
of roads (
22).
Although these mechanisms can have
differ-ential effects on population densities [i.e.,
in-creases under supplementation (
23) and decreases
under fragmentation (
24)], the consequences of
reduced vagility affect ecosystems regardless of
the underlying mechanisms and go far beyond
the focal individuals themselves. Animal
move-ments are essential for ecosystem functioning
because they act as mobile links (
25) and mediate
key processes such as seed dispersal, food web
dynamics (including herbivory and predator-prey
interactions), and metapopulation and disease
dynamics (
26). Single-species or single-site studies
have shown the severe effects of reduced vagility
on these processes (
27, 28). The global nature of
reduced vagility across mammalian species that
we demonstrate here suggests consequences for
ecosystem functioning worldwide. Future
scape management should strive to maintain
land-scape permeability by including animal movement
as a key conservation metric. Ultimately, because
of the critical role of animal movement in human/
wildlife coexistence (
29) and disease spread (30),
the effects of reduced vagility may go beyond
ecosystem functioning to directly affect human
well-being.
R E F E R E N C ES A ND NOT ES
1. A. D. Barnosky et al., Nature 486, 52–58 (2012). 2. J. A. Foley et al., Science 309, 570–574 (2005). 3. H. Sawyer et al., J. Appl. Ecol. 50, 68–78 (2013). 4. S. Saïd, S. Servanty, Landsc. Ecol. 20, 1003–1012
(2005).
5. S. Prange, S. D. Gehrt, E. P. Wiggers, J. Mammal. 85, 483–490 (2004).
6. B. Jedrzejewska, H. Okarma, W. Jedrzejewski, L. Milkowski, J. Appl. Ecol. 31, 664–676 (1994).
7. L. A. Tigas, D. H. Van Vuren, R. M. Sauvajot, Biol. Conserv. 108, 299–306 (2002).
8. J. Lenz et al., Proc. R. Soc. London Ser. B 278, 2257–2264 (2011).
9. O. Venter et al., Nat. Commun. 7, 12558 (2016). 10. T. Mueller et al., Glob. Ecol. Biogeogr. 20, 683–694
(2011).
11. N. Pettorelli et al., Clim. Res. 46, 15–27 (2011). 12. W. Jetz, C. Carbone, J. Fulford, J. H. Brown, Science 306,
266–268 (2004).
13. B. K. McNab, Ecol. Monogr. 56, 1–19 (1986).
14. M. A. Tucker, T. J. Ord, T. L. Rogers, Glob. Ecol. Biogeogr. 23, 1105–1114 (2014).
15. J. M. Rowcliffe, C. Carbone, R. Kays, B. Kranstauber, P. A. Jansen, Methods Ecol. Evol. 3, 653–662 (2012). 16. A. M. Hein, C. Hou, J. F. Gillooly, Ecol. Lett. 15, 104–110
(2012).
17. N. Morellet et al., J. Anim. Ecol. 82, 1326–1339 (2013). 18. C. S. Teitelbaum et al., Ecol. Lett. 18, 545–552 (2015). 19. J. F. Kamler et al., J. Mammal. 84, 989–995 (2003). 20. L. Fahrig, Funct. Ecol. 21, 1003–1015 (2007). 21. J. D. Jones et al., Ecol. Appl. 24, 1769–1779 (2014). 22. K. Jerina, J. Mammal. 93, 1139–1148 (2012). 23. J. S. Gilchrist, E. Otali, Can. J. Zool. 80, 1795–1802
(2002).
24. A. Benítez-López, R. Alkemade, P. A. Verweij, Biol. Conserv. 143, 1307–1316 (2010).
25. J. Lundberg, F. Moberg, Ecosystems 6, 87–98 (2003). 26. S. Bauer, B. J. Hoye, Science 344, 1242552 (2014). 27. I. Hanski, O. Ovaskainen, Nature 404, 755–758
(2000).
28. B. F. Allan, F. Keesing, R. S. Ostfeld, Conserv. Biol. 17, 267–272 (2003).
29. M. D. Graham, I. Douglas-Hamilton, W. M. Adams, P. C. Lee, Anim. Conserv. 12, 445–455 (2009).
30. J. M. Hassell, M. Begon, M. J. Ward, E. M. Fèvre, Trends Ecol. Evol. 32, 55–67 (2017).
AC K NOW L E D GM E NTS
Supported by the Robert Bosch Foundation and additional funding sources (see supplementary text). The data reported in this paper are available at datadryad.org (doi: 10.5061/dryad. st350). M.A.T., T.M., K.B.-G., W.F.F., J.M.F., and B.V.M. conceived the manuscript; M.A.T. and T.M. conducted the analyses and wrote the first manuscript draft. Co-authors contributed data sets and assisted with writing the final version of the manuscript.
SUPPLEMENTARY MATERIALS
www.sciencemag.org/content/359/6374/466/suppl/DC1 Materials and Methods
Supplementary Text Figs. S1 and S2 Tables S1 to S5 References (31–89)
15 February 2017; accepted 11 December 2017 10.1126/science.aam9712
Tuckeret al., Science 359, 466–469 (2018) 26 January 2018 4 of 4
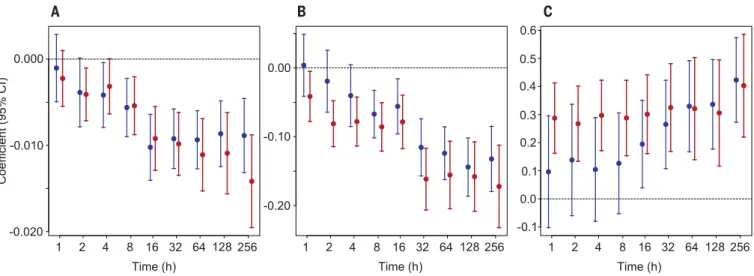
Fig. 3. Model coefficients (with confidence intervals) of linear mixed-effects models predicting mammalian displacements. Coefficient values are shown for (A) Human Footprint Index (HFI), (B) Normalized Difference Vegetation Index (NDVI), and (C) body mass.
Models were run for the median (blue) and long-distance (0.95 quantile; red) displacements of each individual calculated across different time scales. Where the error bars cross the horizontal line, the effect is not significant. See table S3 for details.
RESEARCH | REPORT
on January 25, 2018
http://science.sciencemag.org/
C. Wilmers, John W. Wilson, George Wittemyer, Filip Zieba, Tomasz Zwijacz-Kozica and Thomas Mueller
Spiegel, Olav Strand, Siva Sundaresan, Wiebke Ullmann, Ulrich Voigt, Jake Wall, David Wattles, Martin Wikelski, Christopher
Schmidt, Nuria Selva, Agnieszka Sergiel, Enkhtuvshin Shiilegdamba, João Paulo Silva, Navinder Singh, Erling J. Solberg, Orr
Rolandsen, Christopher S. Rosenberry, Daniel I. Rubenstein, Kamran Safi, Sonia Saïd, Nir Sapir, Hall Sawyer, Niels Martin
Moe
Bruce D. Patterson, Rogerio Cunha de Paula, Luca Pedrotti, Björn Reineking, Martin Rimmler, Tracey L. Rogers, Christer
Nandintsetseg, Ran Nathan, Aidin Niamir, John Odden, Robert B. O'Hara, Luiz Gustavo R. Oliveira-Santos, Kirk A. Olson,
de Miranda Mourão, Ronaldo G. Morato, Nicolas Morellet, Thomas A. Morrison, Samuel L. Díaz-Muñoz, Atle Mysterud, Dejid
Guilherme
Pascual López-López, A. Catherine Markham, Jenny Mattisson, Emilia Patricia Medici, Ugo Mellone, Evelyn Merrill,
Kauffman, Roland Kays, Duncan Kimuyu, Flavia Koch, Bart Kranstauber, Scott LaPoint, Peter Leimgruber, John D. C. Linnell,
Edward Hurme, Lynne A. Isbell, René Janssen, Florian Jeltsch, Petra Kaczensky, Adam Kane, Peter M. Kappeler, Matthew
Hof,
Fritz, Benedikt Gehr, Jacob R. Goheen, Eliezer Gurarie, Mark Hebblewhite, Marco Heurich, A. J. Mark Hewison, Christian
A.
Fennessy, Claudia Fichtel, Wolfgang Fiedler, Christina Fischer, Ilya Fischhoff, Christen H. Fleming, Adam T. Ford, Susanne
Andre Chiaradia, Sarah C. Davidson, Todd Dennis, Stephen DeStefano, Duane Diefenbach, Iain Douglas-Hamilton, Julian
Brown, P. J. Nico de Bruyn, Francesca Cagnacci, Justin M. Calabrese, Constança Camilo-Alves, Simon Chamaillé-Jammes,
Alessandra Bertassoni, Dean Beyer, Laura Bidner, Floris M. van Beest, Stephen Blake, Niels Blaum, Chloe Bracis, Danielle
H. Ali, Andrew M. Allen, Nina Attias, Tal Avgar, Hattie Bartlam-Brooks, Buuveibaatar Bayarbaatar, Jerrold L. Belant,
Marlee A. Tucker, Katrin Böhning-Gaese, William F. Fagan, John M. Fryxell, Bram Van Moorter, Susan C. Alberts, Abdullahi
DOI: 10.1126/science.aam9712
(6374), 466-469.
359
Science
, this issue p. 466
Science
altering ecological interactions.
affecting the species themselves, such changes could have wider effects by limiting the movement of nutrients and
were shorter in areas with high human impact, likely owing to changed behaviors and physical limitations. Besides
examined GPS locations for more than 50 species. In general, animal movements
et al.
have been restricted. Tucker
substantially to ecological processes. As humans have increasingly altered natural habitats, natural animal movements
Until the past century or so, the movement of wild animals was relatively unrestricted, and their travels contributed
Restrictions on roaming
ARTICLE TOOLS
http://science.sciencemag.org/content/359/6374/466
MATERIALS
SUPPLEMENTARY
http://science.sciencemag.org/content/suppl/2018/01/24/359.6374.466.DC1
REFERENCES
http://science.sciencemag.org/content/359/6374/466#BIBL
This article cites 81 articles, 4 of which you can access for free
Terms of Service
Use of this article is subject to the
is a registered trademark of AAAS.
Science
licensee American Association for the Advancement of Science. No claim to original U.S. Government Works. The title
Science, 1200 New York Avenue NW, Washington, DC 20005. 2017 © The Authors, some rights reserved; exclusive
(print ISSN 0036-8075; online ISSN 1095-9203) is published by the American Association for the Advancement of
Science
on January 25, 2018
http://science.sciencemag.org/
PERMISSIONS