Globalization and wine business: Port wine
João Rebelo, Leonida Correia, José Vaz Caldas
Paper prepared for presentation at the I Mediterranean Conference of Agro-Food
Social Scientists. 103rd EAAE Seminar ‘Adding Value to the Agro-Food Supply Chain
in the Future Euromediterranean Space’. Barcelona, Spain, April 23rd - 25th, 2007
Copyright 2007 by [João Rebelo, Leonida Correia, José Vaz Caldas]. All rights reserved. Readers may make verbatim copies of this document for non-commercial purposes by any means, provided that this copyright notice appears on all such copies.
Globalization and wine business: Port wine João Rebelo, Leonida Correia, José Vaz Caldas
Centre for Transdiciplinary Development Studies (CETRAD), Department of Economics, Sociology and Management (DESG), University of Trás-os-Montes and Alto Douro (UTAD), Av Almeida Lucena, 1, 5000-660 Vila Real, Portugal. E-mails: [email protected]; [email protected]; [email protected]
Abstract
In the past two decades the world has seen acceleration in the process of globalisation, affecting virtually all industries and consumers. The wine sector is no exception, witnessing increased exports and imports, decreasing consumption per capita in the producing countries, and a wave of direct foreign investment and mergers and acquisitions in the industry.
Among European wine producers the Port wine can be seen as a representative case of globalisation and as a benchmark, because almost 90% of its production is exported. With this in mind, the main objective of this paper is to analyse the structure and behaviour of the Port wine chain in terms of industrial organisation and trade. To achieve this objective a survey about the role of organisations in national growth and descriptions of the European wine industry and of the Port wine chain was conducted. Moreover, we identify and characterise the dynamics of production, price and trade of the Port wine after World War II.
Despite the Port wine activity having been subjected to cycles there has been a trend toward a continued increase in production and exports, stabilisation of real market prices and a slight increase in the real prices paid to grape growers, leading to positive economic effects for Port wine firms and grape growers. The pro-active behaviour of Port wine chain agents contributed to this result, namely exporters who were able to adopt market strategies to respond to the challenges of globalisation.
Globalization and wine business: Port wine 1 Introduction
One aspect of the term ‘globalization’ describes the growing process of international economic integration, involving a significant growth in international trade of goods, services and flow of production factors. Globalization is not a new phenomenon, being part of a 200-year burst in economic growth, but it has rapidly accelerated since the last decade of the 20th century1.
Virtually all industries and consumers have been affected by globalisation, regardless of the way it is understood or defined by different people. For the more liberal economists it is a positive thing, representing a way to reduce costs associated with geographic locations, thus adding to productivity by conserving resources. From this perspective, internationalisation is a very important component of globalisation, in which we include the growth of international trade of goods, services and various forms of capital (physical, human and intellectual property). Inversely, the anti-globalisation groups consider this to be a bad thing, relating it, for example, to the homogenisation of products for sale, the growing dominance of multinational companies and the disappearance of small companies with individualized products and services. In the case of wines (Anderson et al., 2004) these concerns are understood as the difference in the identity of the wines, the conversion of this traditional industry to modern high technology with a reduced number of companies that supply standardised products for distant markets, instead of distinctive products for local markets.
On a world scale, wine represents 3.5% of world trade in agri- food products, about 0.4% of household expenditure, and vineyards occupy only 0.5% of the cultivated area. However, with the increase in exports and imports there was a wave of direct foreign investment, mergers and acquisitions in the industry, with more ‘flying winemakers;’ viticulturalists and oenologists broadening their experience, changing contexts and even hemispheres. Beyond trade, globalisation is reflected in the international transfer of technology, not only via multinational companies but also
1 The growth of the world’s trade of goods and services increased from 5.5% in 1970-89 to 6.5% in 1990-2005. In both periods, the average growth rate of world’s trade exceeded the growth rate of the world’s product (Banco de Portugal, 2006). Moreover, the ratio of the average growth rates of both indicators increased from 1.2% to 1.8% between 1970-1989 and 1990-2005.
through the winegrowers and individual technicians who export their services, with heavy consequences on supply and demand. There is no doubt that the heterogeneity of preferences on the demand side and the infinite range of possibilities of production and experiments on the supply side make it possible for a large number of small and average-scale producers to coexist, filling certain market niches simultaneously with a reduced number of big companies, most of them following low-cost strategies based on scale and scope economies.
Simultaneously the supply side needs to meet the new requirements and preferences of consumers impacting the behaviour of marketing variables, expressed in statements such as those in a recent article of The Economist (October, 14th 2006: 85): “the value of the wine is as much about the bottle as what’s inside”; “the price of wine is largely determined by objective standards such as colour, ranking and vintage, rather then simply by taste and smell”; “the label is a big part of the glamour”; “investing in wine has become a popular way of diversifying a financial portfolio”; “interest in wine investment has also spurred the creation of wine funds”; “better availability of price information and more demand for wine in emerging markets has created a fine-wine bull market”. This article ends with the statement that “Despite its recent resurgence, fine wine remains a luxury investment that carries risks. Rarity depends on the whims of weather and demand can fluctuate. But at least investors can take comfort that this liquid asset is drinkable – and that what tastes best is not always dearest”.
It is in this globalised world that public, private and associated stakeholders of the viticultural sector must take up the challenges and opportunities, giving special attention to the decision- making processes (organization), assuming that their future will be based on a service economy and involve increasing customer knowledge in the production process. In the formulation of the decision-making process it is necessary to consider what has been learned from successful (and unsuccessful) cases. Among European wines, the case of Port wine deserves special attention because of its history and integration in international markets (on average almost 90% of its production is exported).
The main objective of this paper is to analyze the structure and behaviour of the Port wine chain during recent decades so that we can understand how the Port wine industry has been able to survive in the context of the globalization explosion. Therefore, this paper includes a brief survey of the role of organizations in national growth (section 2) and a short description of the European wine industry (section 3). Section 4 includes a description of the Port wine chain. Section 5 presents the evolution of production, prices and trade of Port after World War II. Section 6 closes with some final remarks.
2. Organizations and national growth
There is a vast body of literature on the determinants of national and regional wealth. One part of this literature considers trade as the central factor, based on a concept of David Ricardo and using the theory of comparative advantage. He demonstrated how the wealth of two nations (the UK and Portugal) increased if they specialized their industries in products in which they had comparative advantages, using the example of textiles for the UK and wine (Port wine) for Portugal. Globalization, as we currently identify it, is essentially an application and extension of the comparative advantages principle.
Another stream of literature on the determinants of economic growth considers the core role of institutions (North, 1999), emphasising that stable institutions and organizations, such as private firms, are a basic prerequisite for economic growth. The institutions (including belief systems) are the structure of the economic system and they result from culture and local experience as well as reflecting them. To explain the development of big business, can be used the concept of organizational capabilities (Lopes, 2005), which refers to the advantage gained by one firm over its competitors when it can better exploit scale and scope economies and add value to its products. Porter (1990) highlights the competitive advantages based on the diamond (the threat of new entrants and of substitute products or services, the bargaining power of suppliers and of buyers, and the rivalry among the existing competitors) and the importance of clusters on competition. More recently, some authors (Doz et al., 2001) argue that the source of competitive advantage in most
industries is not scale nor “position” in the market, but it is essentially the quality of the resources owned by the firm, i.e., the key source of sustainable competitive advantage is valuable, firm-specific tacit knowledge. For these authors, the real challenge is think global and act local, incorporating in the decision process all the possible innovations, melding various fonts of knowledge.
In a global world, change is a key feature of any economic system or industrial network. According to Hakansson (1992) it can be induced either by the dynamics of the economic cycle or actors struggling for control. The struggle for control is particularly interesting in the context of the Port wine chain, inasmuch as it involves two interwoven and opposite tendencies (Brito, 2001). First, hierarchicalisation leads to an increased control of resources and activities by a decreasing number of actors. Second, extrication occurs when such control is diminished and, as a consequence, spreads through the network.
3. The European wine industry
The European Union (EU) wine industry has a global dimension and is a leader in the world market (European Commission, 20062). The vineyards account for approximately 45% of the world’s vine growing area3 and almost 60% of the world wine production and consumption. The
present per-capita consump tion in the EU-25 is almost 30 litres/year, after a sharp fall during the last twenty years, especially in the producer countries, where it has dropped by one half.
The EU is also the world’s leading exporter and importer of wine, exporting an average of 12.5 million hl (€ 4.5 billion) and importing an annual average of 9 million hl. The main exporting members are Italy (35% of the total volume and 30% of the total value), France (30% of the volume and 30% of the value) and Spain (21% of volume and 10% of the value).
2 This paper provides a good overview of the structure of the EU wine chain.
3 However, since the prohibition of new plantations and the introduction of a premium for grubbing up in 1975/76 has decreased, falling from to 1975 to 1996 from 4.5 to 3.4 million ha, an annual rate of decrease of 1.4%, equivalent to 56.000 ha/year. More recently the rate of decrease has slowed. At the present (2002), the area of vineyards EU -15 is almost 4.8 million ha (60% of the world area).
France, Italy and Spain form the leading trio4 of exporting countries accounting for the almost
60% of world quantity exports (including intra-Community trade). In the last decade their exports increased significantly, i.e., from France by 34%, Spain 31% and Italy 21%. By contrast, they fell in Greece (-30%), Hungary (-19%) and Germany (-10%). But it is the New World countries which have seen a spectacular growth in their exports (European Commission, 2006): South Africa (+770%), Australia (+500%), Chile (+270%) and USA (+160%), provoking a fall of the market share of the Old World. In relation to imports, the main quantity countries are Germany, United Kingdom (UK), USA and France, whereas by value the main importer is UK, followed by USA, Germany and Japan. O utside of its members, the main source of EU imports are Australia, Chile and USA.
That dramatic entry on to the international stage by New World producers has presented and will continue to present serious challenges to producers in the Old World in both Western and Eastern Europe. Moreover, following a dramatic expansion in their vineyard planting in the later 1990s, New World regions too face challenges, as the production from those recent plantings adds significantly to the stock of wine available for sale in the world market. As expressed by Remaud and Couderc (2006: 406): “Old wine companies have been taking more than a decade to start reacting to the rising competition from New World. Moreover, due to the recent tend of global grape and wine oversupply, markets are beginning to experience deep discounting as wineries look to clear out excess inventory in order to make room for new vintages. To sustain their growth wine producers will have two alternatives; either go along with the supermarket chains and become global by investing in some of the main wine producing countries, or develop a niche strategy (through a specific product, and or a specific service) to differentiate themselves”.
Inherent to the world wine competition there has been a growing industrial concentration (Table 1), especially in the New World countries. The lower concentration in the Old World results from the fact that the traditional viticulture structure in the EU is one of small properties and
4
This trio is followed by Australia, USA, Chile, Germany, Portugal and South Africa. In value the order is France, Italy, Spain, Australia, Chile USA, Portugal, Germany and South Africa (European Commission, 2006).
transformation/commercialisation depends on producer cooperatives, most of which were founded in fifties and sixties of the past century when the main objectives were to solve problems of wine processing and stocking of the production of a large number of very small vine growers. Now we are in the presence of small-scale units (Table 2) with insufficient organizational ability to develop goods, services and skills demanded by an increasingly competitive international market.
Table 1 – Firm concentration within the wine industry, selected Old World and New World Countries, 2000
Top 5´s share of national wine production (%)
Average wine sales of top 5 firms (US$ million)
Old World
France (excluding champagne) 13 330
Italy 5 125 Spain 10 190 New World USA 73 750 Australia 68 31 New Zealand 80 n.d Argentina 50 97 Chile 47 90
Source: Anderson et al. (2004: 17).
Table 2 – Prevalence of wine cooperatives in the European Union, 2000
Number Members Market share Sales (Euro million)
Sales per coop. (Euro million)
France 870 121,000 52 4,570 5.3
Italy 607 208,000 55 n.d n.d
Spain 715 167,000 70 650 0.9
Portugal 90 55,000 49 220 2.4
Source: Anderson et al. (2004: 18).
4. The Port wine chain
Port Wine is a fortified wine named after Porto, Portugal’s second largest city, from where it has traditionally been shipped. However, it begins life in the Douro Demarcated Region (DDR) starting 100 km east of Porto and extend ing to the Spanish border on the steep hills of the Douro River valley and its tributaries. In 1756 this dema rcation was created to protect Port wine, more precisely quality Douro wines, against the competition of other (southern) Portuguese wines. This
was a pioneering decision at a global level in the concepts and regulating principles of controlled denominatio ns of origin, accepted worldwide (especially in Europe).5
The DDR has an area of 250,000 hectares, with vineyards occupying only 17% of the land. There are 257,100 inhabitants, with a population density of 46.62 inhabitants/km2. In the last 40 years the region has lost 40% of its population and there is evidence of significant aging of the population. Associated with this negative demographic are high asymmetries in the distribution of wealth. Hand- in-hand with this is a viticultural mosaic embodying a great variety of situations, and a high number of small-scale grape growers6 in relation to a reduced number of average and large-scale grape growers7.
A greater part (on average 55%) of the annual grapes in the DDR is used for the production of Port wine. The regulating institution of the sector (presently IVDP) stipulates the quantity of Port wine to be produced. This is done after the main stakeholders have been heard (production and commerce) taking into account the recent evolution and the short-term perspectives of sales and the stock available. Then, in agreement with the property records, (namely the location, the nature of the soil, the varieties and age of the vines) the approved quantity of grapes for Port wine production is distributed among the parcels that have that property right. This is the benefício system, a typical quota policy.
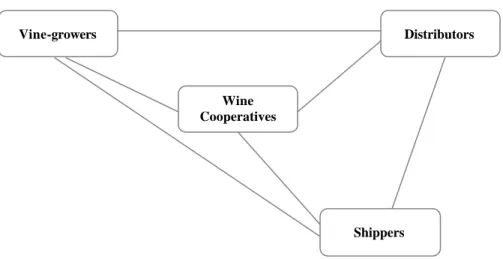
Using the network approach, we can say that despite the involvement of thousands of players in the Port wine chain they can be grouped into four main categories (Figure 1): vine-growers, wine cooperatives, shippers and distributors.
5 Despite the geographical, institutional and administrative changes, the DDR constitutes a region with a collective memory, with a strong tradition of grape farming and socio-economic specific characteristics, classified as a world heritage site (evolutive and living landscape, where the vineyards have role key) by UNESCO in 2001.
6
In the DDR the approximate 45,000 hectares of vineyard are divided into 85,000 parcels that are owned by roughly 33,000 farmers, i.e., 1.36 hectares per farmer. The region displayed characteristics of soil (hillside schist ground and high exposition to the sun) and climate (very hot and dry summers and cold winters) that favoured the production of wine with distinctive qualities that are hard to replicate in others regions.
7
Some of these vine-growers, have in the last two decades become individually integrated through the statute of producer-bottler.
Figure 1 – The Port wine chain
Source: adapted from Brito (2001)
In the past, grape growing and Port wine vinification were undertaken by individual producers who transformed and sold the wine in bulk to the shipping houses. Over the last five decades several new developments have changed this process. First, the setting up of a set of wine cooperatives8 in the 1950s and 60s which receive the grapes from the members and produce the wine, usually sold in bulk to the shippers. Second, a large number of grape growers have closed their wineries, selling the grapes to shippers for making Port wine. This shift has been reinforced since the 1980s because shippers have also acquired large vineyards (called quintas) in the DDR, following a backward vertical integration. Third, in the last two decades most of large scale farmers, moving in a forward vertical integration9, now age and bottle a small share of their own wine (Estate-bottled, Quinta Ports) and ship it directly from the DDR.
In the Port wine chain the shippers (also known as export firms) have a key role. Since the seventeenth century the export of Port wine has been done by firms whose owners are mainly English. The exporters tended to be organized in family networks primarily based in London, with export operations in Gaia-Porto and wholly owned marketing and distribution channels established
8
Presently, 20 wine cooperatives transform about one third of the Port wine production of the DDR, integrating in forward process 16 thousand small scale vine-growers. Only a small share (almost 10%) of the Port wine that they produced is bottled and commercialized either directly or trough distributors. The wine cooperatives have a dominant position in the other types of wine, transforming about 60% of its production.
9
The presence of these producers is relevant in the denominated Douro wine tables, essentially in the segment of the high quality wines.
Vine-growers Distributors
Wine Cooperatives
in the country where the wine is sold. Until 199610, a large share of Port wine was exported in bulk to the consumption market where it was labelled with the brand names of their wholesalers or retailers, having the shippers little or no control over the marketing of their brand.
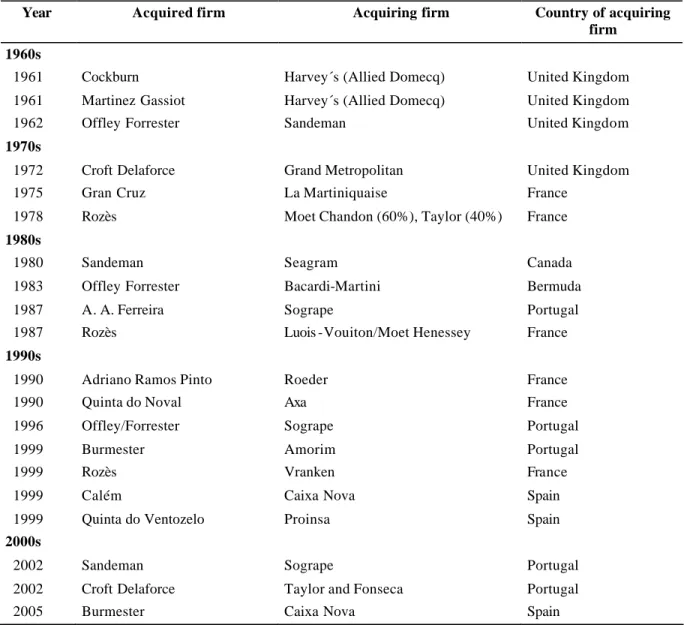
With the changes in the economic environment, as has occurred in the alcoholic beverage sector of other countries in the last five decades, we have observed a number of mergers and acquisitions (M&A) in Port wine firms (Table 3), with a relevant intervention of foreign companies.
Table 3 – Major M&A in the Port wine industry
Year Acquired firm Acquiring firm Country of acquiring
firm 1960s
1961 Cockburn Harvey´s (Allied Domecq) United Kingdom
1961 Martinez Gassiot Harvey´s (Allied Domecq) United Kingdom
1962 Offley Forrester Sandeman United Kingdom
1970s
1972 Croft Delaforce Grand Metropolitan United Kingdom
1975 Gran Cruz La Martiniquaise France
1978 Rozès Moet Chandon (60%), Taylor (40%) France
1980s
1980 Sandeman Seagram Canada
1983 Offley Forrester Bacardi-Martini Bermuda
1987 A. A. Ferreira Sogrape Portugal
1987 Rozès Luois -Vouiton/Moet Henessey France
1990s
1990 Adriano Ramos Pinto Roeder France
1990 Quinta do Noval Axa France
1996 Offley/Forrester Sogrape Portugal
1999 Burmester Amorim Portugal
1999 Rozès Vranken France
1999 Calém Caixa Nova Spain
1999 Quinta do Ventozelo Proinsa Spain
2000s
2002 Sandeman Sogrape Portugal
2002 Croft Delaforce Taylor and Fonseca Portugal
2005 Burmester Caixa Nova Spain
Source: Lopes (2005)
During the 1960s, multinational UK firms invested in Port wine, believing that it was possible to blend Port to obtain a beverage with homogeneous characteristics which could be more easily
10
In this year the exportation in bulk was suspended, being the Port wine bottled in Gaia-Porto or in the DDR. However, the shippers continued to commercialize their wines trough warehouses or retailers.
branded. Allied Domecq, for example, acquired Cockburn and Martinez Gassiot in 1961 with this in mind (Lopes, 2005). In the following decades were French and Spanish firms that invested in the sector, buying a number of Port wine companies.
The intervention of multinationals in the Port wine business changed and refined the way this beverage was sold, name ly through the segmentation of the market and creation of product line extensions11. However, the difficulty in controlling the quality due to the natural and biological origins of the wine12 and in creating and sustaining brands in the international market, associated with the low level of return on capital when compared to that obtained from sales of spirits, such as vodka, tequila or cognac and other processed wine, led most of the leading multinationals to divest the Port wine business in the beginning of 2000s. However, since the 1990s Portuguese firms have become involved in the M&A, and their goal is to consolidate13 domestic leadership.
Simultaneously with the M&A in the Port wine sector the firm size and market concentration increased, especially in recent years. Taking into account the concentration ratios (CR), i.e., the accumulated market share of the 4 (CR4) or 8 (CR8) bigger firms or holdings, we obtain the results shown in Table 4.
Table 4 – Market concentration (CR4 and CR8) by firm and holding (%)
1991 1998 2004 CR4 - Firm - Holding 35.0 48.9 34.7 44.4 49.2 59.1 CR8 - Firm - Holding 54.6 73.0 52.5 64.2 69.1 77.2 Source: Rebelo (1998) provides 1991 and The Douro and Port Wine Institute 1998 and 2004.
There was a decrease in concentration between 1991 and 1998, a situation that completely inverted in recent years. In 2004, the 4 and 8 biggest firms traded 49.2% and 69.1% of Port wine,
11
For example, in 1983, Allied Domecq created the line extension Cockburn Special Reserve, which, in the short run, became a premium wine with high acceptation in the wo rld market (Lopes, 2005).
12 Difficulties that are reinforced because of, inside DDR, coexists different microclimates and the structure of the property to be of small dimension, when compared with patterns of the New World or even of UE.
13 A typical example is Sogrape. Until the 1990s the sales of this firm depended at about 95% on one brand (the table wine Mateus Rosé). However, the decline of this brand forces the company to diversify into other types of wines, essentially Port (Lopes, 2005).
values which increase to 59.1% and 77. 2% if the data is seen in the light of a holding. The values are close to those observed in some New World countries (Table 1), indicating that in some way the commercial Portwine firms are attentive to the movements of the world wine market.
In spite of an increase in the concentration index, no Port wine company is included in the ranks of the largest alcoholic drink corporations. Indeed, in 2000 the sales of Sogrape, the leading Portuguese firm in wine and spirits, was about 145 times smaller than that of Diego (Lopes, 2005), indicating that in international patterns some fragmentation remains in the Port wine business. Nonetheless, domestically there is a small group of medium-size firms in a lead position: Cockburn, Taylor, Symington and Sogrape. Excepting the first, the y are family owned, controlled and managed.
5. Production, trade and prices of Port wine
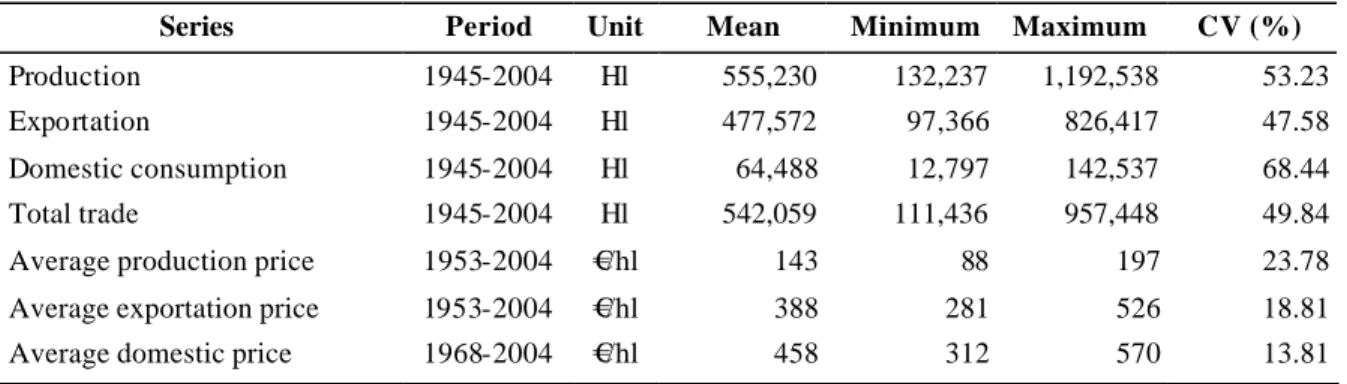
The production and trade of Port wine are closely linked to the history of the DDR, whose economy is characterized by historical cycles. To analyze the evolution of the trend and cycle components of a set of variables related to production, trade (exportation and domestic consumption) and prices14of Port wine in the post Second World War we use a time-series approach. Descriptive statistics of the series are in Table 5. As expected the variability (shown by the coefficient of variation – CV) of the prices is smaller than to the variables that represent volumes.
Table 5 – Descriptive statistics of the original series
Series Period Unit Mean Minimum Maximum CV (%)
Production 1945-2004 Hl 555,230 132,237 1,192,538 53.23
Exportation 1945-2004 Hl 477,572 97,366 826,417 47.58
Domestic consumption 1945-2004 Hl 64,488 12,797 142,537 68.44
Total trade 1945-2004 Hl 542,059 111,436 957,448 49.84
Average production price 1953-2004 €/hl 143 88 197 23.78
Average exportation price 1953-2004 €/hl 388 281 526 18.81
Average domestic price 1968-2004 €/hl 458 312 570 13.81
Sources: The Douro and Port Wine Institute and “Banco de Portugal” (2001, 2005).
14 With regard to prices, we use the average price per hectolitre observed in production, export and domestic market in real terms, or rather at constant 2002 prices. Until 1967 the domestic value of sales was unknown, therefore there is no annual price.
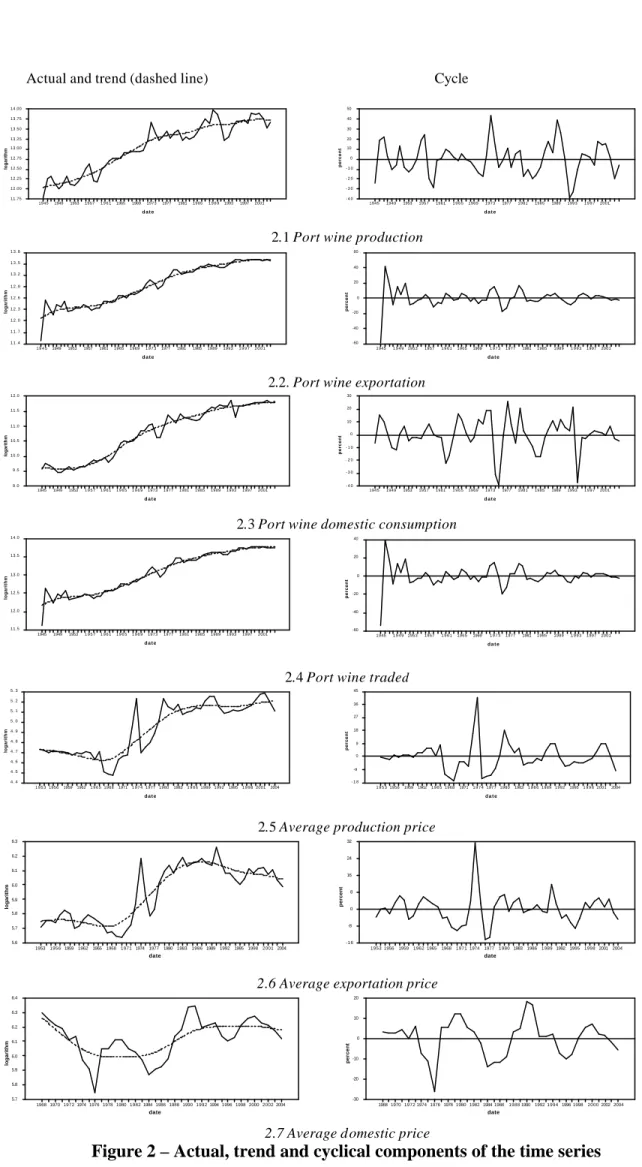
In relation to the means to isolate the trend, ytT, from the cyclical component ytC, of a time series yt, the Hodrick-Prescott (HP) filter (1997) is applied to annual data of the logarithm of the production, trade and prices of Port wine, which results (λ=100) are illustrate in Figure 2. The charts on the left show the evolution of the observed series and their trends; those on the right show its cyclical component, i.e., the deviations observed around the trend. As the values are all in their natural logarithmic form, the units of the cyc le correspond to percentage deviations from trend growth paths.
In terms of volume, Figure 2 clearly shows the increasing systematic trend of Port wine production and trade over the last 60 years. After an initial weaker phase which lasted till the end of the 1950s, a stronger phase of vitality followed, where the production and trade grew at a quicker rate until the end of the 1970s, started to decelerate during the 1980s and moved on to a relatively stable phase from the 1990s onwards.
The main milestones in the history of Port wine are distinguishable in a more detailed analysis of the cyclic components in the graphs on the right. In terms of the cyclic variation, production, export and trade show a very similar cyclic pattern, even though there are more considerable cyclic fluctuations in the case of production. Given the importance of export in the total sales of Port wine (an average of 88.5% over the whole period), it is not surprising to see an almost perfect overlapping of the cycles of these two variables.
The charts also show that there is an increase in fluctuations after the 1970s where there appears to be a bigger sensitivity to the behaviour of the Portuguese domestic gross product. In general the recessions of aggregate economic activity correspond to the lower phase of the cycle of Port wine production in 1975, 1983/84, 1992/93 and 2003, the same as happened with the peaks of the expansion phase in 1973, 1989/90 and 1999. Here we highlight the fact that the domestic consumption cycle behaves in accordance with that of production with about a year’s delay. That is, the peak years and the contraction phase of the consumption cycle years happen about a year after being seen in the Port wine production.
Actual and trend (dashed line) Cycle d a t e logarithm 1945 1949 1953 19571 9 6 11965 19691973 1977 1981 19851 9 8 91993 19972001 11.75 12.00 12.25 12.50 12.75 13.00 13.25 13.50 13.75 14.00 d a t e percent 1945 1949 1953 1957 1961 1 9 6 51969 1973 1977 1981 1985 1989 1993 1 9 9 72001 - 4 0 - 3 0 - 2 0 - 1 0 0 10 20 30 40 50
2.1 Port wine production
d a t e logarithm 1 9 4 51949 1953 1957 1961 1965 19691 9 7 31977 1981 19851989 1993 1 9 9 72 0 0 1 1 1 . 4 1 1 . 7 1 2 . 0 1 2 . 3 1 2 . 6 1 2 . 9 1 3 . 2 1 3 . 5 1 3 . 8 d a t e percent 1945 1 9 4 91953 1957 1 9 6 11965 1969 1 9 7 31977 1981 1985 1989 1 9 9 319972001 -60 -40 -20 0 20 40 60
2.2. Port wine exportation
d a t e logarithm 1945 1949 1953 1 9 5 71 9 6 11 9 6 51 9 6 919731977 1981 1985 19891993 1997 2001 9.0 9.5 10.0 10.5 11.0 11.5 12.0 d a t e percent 1945 1949 1953 1957 1961 1 9 6 51969 1973 1977 1981 1985 1989 1993 1 9 9 72001 - 4 0 - 3 0 - 2 0 - 1 0 0 10 20 30
2.3 Port wine domestic consumption
d a t e logarithm 1945 1949 1953 1 9 5 71 9 6 11 9 6 51 9 6 919731977 1981 1985 19891993 1997 2001 11.5 12.0 12.5 13.0 13.5 14.0 d a t e percent 1945 1 9 4 91953 1957 1 9 6 11965 1969 1 9 7 31977 1981 1985 1989 1 9 9 319972001 -60 -40 -20 0 20 40
2.4 Port wine traded
d a t e logarithm 1 9 5 3 1956195919621 9 6 5 196819711 9 7 4 1977 198019831 9 8 6 1989 199219951 9 9 8 20012004 4 . 4 4 . 5 4 . 6 4 . 7 4 . 8 4 . 9 5 . 0 5 . 1 5 . 2 5 . 3 d a t e percent 1 9 5 3 1956195919621 9 6 5 196819711 9 7 4 1977 198019831 9 8 6 1989 199219951 9 9 8 20012004 - 1 8 -9 0 9 18 27 36 45
2.5 Average production price
date logarithm 19531956 1959 19621965 19681971 1974 19771980 19831986 1989 19921995 19982001 2004 5.6 5.7 5.8 5.9 6.0 6.1 6.2 6.3 date percent 1953 195619591962 196519681971 197419771980 1983 19861989 1992 19951998 2001 2004 - 1 6 -8 0 8 16 24 32
2.6 Average exportation price
date logarithm 1968 1970 1972 1974 1976 1978 1980 1982 1984 1986 1988 1990 1992 1994 1996 1998 2000 2002 2004 5.7 5.8 5.9 6.0 6.1 6.2 6.3 6.4 date percent 1968 1970 1972 1974 1976 1978 1980 1982 1984 19861988 1990 1992 1994 1996 19982000 2002 2004 -30 -20 -10 0 10 20
2.7 Average domestic price
The trend of the production and export prices of Port wine appears slightly lower between 1953 and 1967/68, after which there is a rapid increase until the middle of the 80s then decreasing until the present (in the case of the export price there is a decrease until 1995 and, in the case of the production price, an increase until the present day). The trend behaviour of the average price in the domestic market, for which we only have data from 1968 to 2004, is differentiated: there is a negative evolution until the beginning of the 1980s, starting to increase gradually until the beginning of the 1990s at a slow rate until 1999 and from then onwards stays relatively stable.
By complementing the information in Figure 2 with that obtained from bibliographical sources, we can affirm that at the end of the Second World War the scenario for the wine sector in the Douro region was quite grim. In 1945 the amount of wine exported was one of the lowest since the demarcation in 1756, explained by the worldwide decrease in the consumption of Port wine (Moreira, 1998) resulting from the economic crisis in the main export destination countries, i.e., England, France, Belgium and Luxembourg.
After World War II, due to the economic progress of the eastern countries and the elimination of trade barriers, commerce expanded quickly at a world level. This was also true for the Port wine, although less in the 1950s where there was some stagnation due to changes in the Brit ish lifestyle and consumption trends as a consequence of the war, which brought American soldiers to Europe along with their lifestyle and led to the increased consumption of non-alcoholic drinks such as Coca-Cola and other drinks suc h as whisky, sherry, rum and vermouth. In addition to the decrease in the British market, Port wine also faced stiff competition from other alcoholic drinks that were launched with persuasive publicity campaigns to influence consumer preferences.
Despite the marketing campaigns by some Port wine companies to establish themselves in various markets, they were not as successful as those of other alcoholic drink producers. Nevertheless these publicity campaigns had a positive effect and from the mid 1950s onwards there was an increase in sales to France, which to a certain extent offset the decrease in exports to the British market. During this period other markets started to consume more Port wine, such as those
of Belgium, Germany and Italy. The home market also recovered as the Portuguese standard of living improved. In other words, the Port wine business has both felt and influenced the effects of globalisation, with some Port wine firms carrying out mergers and acquisitions to benefit from economies of scope and scale. Following a normal pathway, Port wine has consolidated its position in the European markets since 1974, having expanded its production and trade as well as increasing its sales and production prices.
6. Final remarks
The wine market, in general, and the Port wine, in particular, is a good illustration of the globalization movement in recent decades. Consumption has decreased and the market has expanded and international competition has become more intense. Europe is the continent where globalisation has been most felt, suffering an accentuated reduction in consumption, a large drop in the vineyard area and an increasing in international trade.
On account of its history, Port wine can be considered as a benchmark case of globalization. During the last five decades, despite the influence of cycles, there has been a trend toward a continued increase in Port wine production and exports. In addition to the increase in production, there has been a trend to maintain real prices in the market and a slight increase in the real price paid to the grape growers. Relating the evolution of production to that of prices we can conclude that in terms of the added value chain, a larger quantity of Port wine results in positive effects for Port wine companies and for grape growers. Also, the quota policy has allowed small-scale grape producers to benefit from part of this additional prosperity.
As has happened in the world wine market, increasing industrial concentration has also been seen in the Port wine sector, following a model of “strategic groups” type. This situation may be positive from the final product market point of view but the same cannot be said in relation to the up-stream situation, since oligopsonist behaviour can have serious consequences for grape growers. The inter-professional organisation, as a forum for discussion and agreements of the sector, should be attentive to this situation.
To sum up, there is no doubt about the fact that the Port wine sector’s adopted entrepreneurial and marketing strategies have been able to respond to challenges of globalization. The different agents of the Port wine chain, namely the commercial firms, have acted in a “glocal” way, considering the global environment but not neglecting the local one. During this evolutive process the Douro region has always felt the need and benefits from the public intervention in the external and domestic defence of the Porto wine.
References
Anderson, K., Norma D., Wittwer G. (2004). The global picture. The World´s Wine Market, Globalization at Work. Anderson, K. (Ed.), Edward Elgar Publishing Limited, UK, pp. 14-55.
Banco de Portugal (2001). Séries Longas para a Economia Portuguesa: Pós II Guerra Mundial (versão revista e prolongada para 1994 e 1995). Banco de Portugal, Lisboa.
Banco de Portugal (2005). Relatório e Contas da Gerência de 2004. Banco de Portugal, Lisboa.
Banco de Portugal (2006). Relatório e Contas da Gerência de 2005. Banco de Portugal, Lisboa.
Brito, Carlos M. (2001). Towards an institutional theory of the dynamics of industrial networks. Journal of Business & Industrial Marketing, Vol 16 (3): 150-166.
Doz, Yves, J. Santos and P. Williamson (2001). From Global to Metanational. How Companies Win in the Knowledge Economy. Harvard Business School Press, Boston, MA.
European Commission (2006). Wine, Economy of the sector. Working paper, Directorate General for Agriculture and Rural Development, February 2006. http://ec.europa.eu/agriculture/ markets/wine/studies/rep_econ2006_en.pdf.
Hakansson, H. (1992). “Evolution Process in Industrial Networks”, in Axelsson, B. and Easton, G. (Editors), Industrial Networks: A New View of Reality, Routledge, London
Hodrick, R.J., Prescott, E.C. (1997). “Postwar U.S. business cycles: an empirical investigation”. Journal of Money, Credit and Banking, 29(1): 1-16.
Lopes, T. S. (2005). “Competing with Multinationals: Strategies of the Portuguese Alcohol Industry”. Business History Review, 79: 559-585.
Moreira, V. (1998). O Governo de Baco. Edições Afrontamento, Porto, Portugal.
North, D.C. (1999). Institutions, Institutional Change and Economic Performance. Cambridge, UK.
Rebelo, J. (1998). Evolução económica recente do sector vitivinícola português: o caso da RDD/vinho do Porto. Os Vinhos Licorosos e a História. Centro de Estudos de História do Atlântico, Funchal, Portugal: 323-345.
Remaud, H. and J. Couderc (2006). "Wine Business Practices: A New Versus Old Wine Perspective”. Agribusiness, Vol. 22 (3): 405-416.