railway ballast
Patrícia Jerónimo
a, Ricardo Resende
b,⁎, Eduardo Fortunato
a,c aFaculdade de Engenharia da Universidade do Porto, PortugalbUniversity Institute of Lisbon (ISCTE-IUL), ISTAR-IUL, Lisboa, Portugal cLaboratório Nacional de Engenharia Civil, Portugal
A R T I C L E I N F O Keywords: Railway ballast Particle shape 3D scanning Laser Contact scanning Rock breakage A B S T R A C T
Performance of traditional railway structure depends significantly on the behaviour of its support layers, par-ticularly the ballast. This layer’s rock particles are selected to ensure high mechanical strength, but traffic and mechanical maintenance break and wear the particles. Consequently, the layer incurs permanent deformations that degrade its strength and increase deformability and permeability. Particle physical characteristics, in par-ticular those related to size and shape, influence their fragmentation and wear and must be studied accordingly. In addition, structural numerical models that represent individual particles, such as the discrete element method, have been increasingly used to model the infrastructure and therefore detailed geometrical characterization in the form of 3D digital models of the particles are necessary. This work contributes to this goal by investigating a contact-based cost-effective method that digitizes particle form and allows the determination of their geometric parameters. This method is described, compared with well-established laser scanning technique and then applied to study degradation of particles in Los Angeles and microDeval fragmentation tests.
Introduction
The conventional railway track consists of a superstructure (rails fastening systems, sleepers and ballast) and a substructure, which in-cludes the sub-ballast layer and the foundation, the upper part of which is usually referred as capping layer. The behaviour of these elements under the cyclical action originated by rail circulation is relatively complex, with the ballast layer assuming a predominant role[32]. This layer directly receives loads transmitted by the sleepers and its main function is to distribute these loads, reducing stresses transmitted to bottom layers and guaranteeing the track’s horizontal stability.
To exhibit adequate performance it is expected that materials con-stituting the track’s support layers – in particular, the ballast – exhibit resilient behaviour that provides near-complete deformation recovery at each load cycle. On the contrary, when permanent deformations develop, rail operation may be significantly affected, and significant structural damage may occur[20].
The ballast layer consists of coarse rock particles of nearly uniform granulometry and is usually 20–40 cm thick. Interaction between par-ticles gives the layer high compressive strength, particularly in the vertical direction. The horizontal forces (transverse and longitudinal) induced by the rolling stock and temperature variation of the rails are
balanced by friction generated between the ballast particles and the sleepers and by imbrication between the particles. Ballast allows the partial anchoring of the sleepers, providing stability to the remaining elements of the superstructure.
In addition to the structural function, the ballast layer has other functions, namely: (a) it contributes to the track’s drainage by permit-ting water percolation between the particles; (b) dissipates energy and attenuates vibrations resulting from the passage of vehicles; (c) avoids vegetation growth; and d) provides electrical insulation between the rails. The fact that ballast consists of coarse particles of similar size makes it relatively easy to place and remove both the material itself and other components of the track. In addition, throughout the life cycle of the infrastructure particles are rearranged through maintenance op-erations that restore the geometric quality of the track.
Performance of the ballast layer is affected when the particle size changes, when voids arefilled by fine particles resulting from fracturing and wear of the ballast particles themselves or by infiltration of mate-rial from the underlying layers from outside the railway brought by weather agents or fallen from the compositions, or material originated from sleeper wear[27,5,19,10,12].
Ballast particles essentially degrade in one of the following ways [23]: (i) fragmentation of the particles into even parts; (ii) breaking of
https://doi.org/10.1016/j.trgeo.2019.100302
Received 11 April 2019; Received in revised form 7 November 2019; Accepted 26 November 2019
⁎Corresponding author.
E-mail addresses:[email protected](P. Jerónimo),[email protected](R. Resende),[email protected](E. Fortunato).
Available online 30 November 2019
2214-3912/ © 2019 Elsevier Ltd. All rights reserved.
arrangements of the granular medium, with imbrication, preventing rolling or significant translational movements which result in reduced compactness, geometric variation and layer destabilization. Thus, the ballast particles should be cubic, i.e. polyhedral isometric shaped, have rough faces and sharp edges. The cubic shape also contributes to the reduction of the breaking and crushing of the particles– by reducing breaking under heavy mechanical maintenance and by reducing contact forces between particles (by increasing contact points) resulting from the passage of rail traffic. The adequate shape is defined by the im-position of maximum values for geometric parameters such asflakiness index, shape index and particle length[24].
In this context the study of the influence of the shape of the particles and their geometric parameters on the behaviour of the ballast layer and the granulometric evolution of the ballast layer has been one of the key research lines of the railroad life-cycle analysis [30,4,15,16,18]. Moreover, the recent development of discrete element railroad nu-merical models has highlighted the importance of knowing the shape of the particles. Under these models, the effects of traffic and mechanical maintenance actions on particle shape evolution, layer stability and track dynamic behaviour can be analysed[9,26,31,34,3].
The establishment of an efficient method to evaluate the shape of the particles of the ballast layer has, over time, been a desire of the technical-scientific community, and the technological evolution has provided the development of several techniques that have been more or less suitable for this purpose[6].
This work aims to establish a method that allows the digitization of the form of particles and the determination of their geometric para-meters. Previous works have established several techniques to the characterisation of particles in several scales and in laboratory andfield environment. Guo et al.[8]presents a recent review of image analysis methods for characterization not only of individual particles but also of ballast particles collective behaviour. Laser scanning of ballast, which can be traced to at least Tolppanen [29], is becoming the de facto method for ballast particle scanning. Works such as [1,17]or, more recently, Guo[7]who proposes new parameters for ballast degradation based solely on analysis of 3D digital particle models, have employed laser scanning to investigate particles from different rocks, before and after testing, with coarser andfiner meshes. Paixão et al.[21]proposes a low-cost photogrammetry method that compares, in many aspects, favourably with laser scanning. At a smaller scale, Barbieri and Silva [2]aims to establish lower cost photogrammetry with electron micro-scope of very small rock particles and compares it with well-established tomography and x-ray tomography[22]. Other authors[14]have em-ployed 2D imaging to study shape evolution of railway ballast particles and propose new indices, structured light technologies[28]are also viable and deliver convincing results.
Finally, Resende et al.[25], who employed needle contact scanning to digitize small (10–20 cm) rock joint surface roughness, are one of few recent applications of contact scanning to geomaterials, not considering analogic and digital 2D profilometers, which have been employed for decades in laboratory andfield roughness characterization.
This work proposes the application of a needle-point automated contact-based technique to the characterization of rock ballast particles, which is, to the knowledge of the authors, a novel method. The tech-nique’s performance is accessed, and its weak and strong points are examined.
Development and application of two methods of ballast particle digitization
Digitization with mechanical equipment
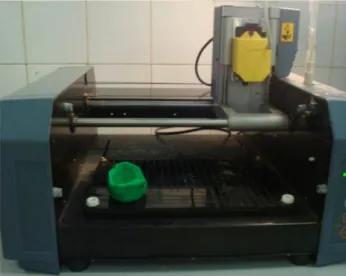
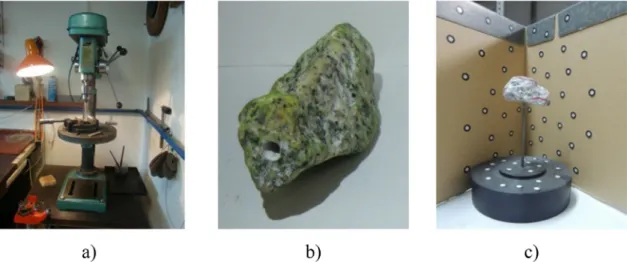
To digitize ballast particles (obtained from a quarry that produces railroad ballast from granite rock crushing), a three-dimensional me-chanical digitizer called Roland Modela MDX–20 belonging to EDP FabLab (https://www.edp.com/pt-pt/fablab-edp) was employed (Fig. 1). This equipment allows the scanning of objects through the contact of a piezoelectric needle of great sensitivity. It produces three-dimensional scans with a resolution up to 0.05 mm in the horizontal plane (corresponding to the resolution of the servo-motor driving the needle in the horizontal plane, directions X and Y) while the precision of the touch sensor is 0.025 mm in the vertical plane (Z direction). The piezoelectric needle sweeps a pre-defined rectangular area moving vertically, touching and moving away from the object, obtaining the three coordinates of each touched point. The 0.08 mm diameter needle is a high precision tool attached to a piezoelectric sensor capable of scanning objects with maximum plan dimensions of 203.2 × 152.4 mm2and a maximum height of 60.3 mm above the scanning table. The number of points per object depends on its size and the chosen resolution, the latter parameter being worth special atten-tion, because whenever resolution doubles, reading time increases ap-proximately four times. The process is controlled by the equipment’s software, Dr. Picza.
Since the Roland Model MDX-20 needle moves vertically along the horizontal plane, and ballast particles are irregularly shaped and have recess areas, digitization would have to be done in multiple planes to capture the complete shape of the particles. These plans would later be merged using 3D modelling software. To avoid the merging of several surfaces, which can be very time consuming and introduces errors, it was decided to build physical moulds (negatives) of the particles. The choice of the mould material considered that: it must adequately ac-quire the form of the particle and gain sufficient stiffness; and it must release from the particle without breaking, deforming or attach to the concavities and surface irregularities.
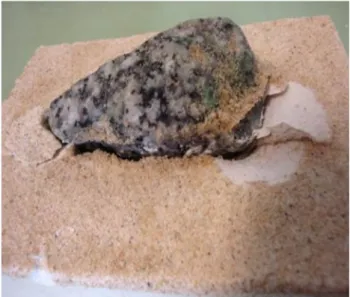
Thefirst attempt was made with gypsum, but moulds would fre-quently break when being released from the particle, as can be seen in Fig. 2. Moreover, the time spent in the process was quite high, since the gypsum takes 1–2 days to dry completely.
The authors then tested plasticine, which is easily workable and does not require drying or set time. Moulds of two distinctly shaped and sized particles, one relatively cubic and regular (particle I) and another elongated, irregular and with several concavities (particle II) were
made.Fig. 3shows that the material captures well the shape and sur-face of the particles, leading to satisfactory results.
The four plasticine moulds were then simultaneously scanned for two particles (Fig. 4), with a 0.75 mm resolution. A good representation of the live edges of the particles was obtained. This task took about 13 h.
The scanner software controls the scanning process, verifies its quality, and generates the cloud point, a triangle mesh and images of the mesh, as shown in Fig. 5. Since the point location is regular, the meshing process is unequivocal and straightforward. Both the point cloud and the mesh can be exported in several formats, compatible with most 3D modelling software.
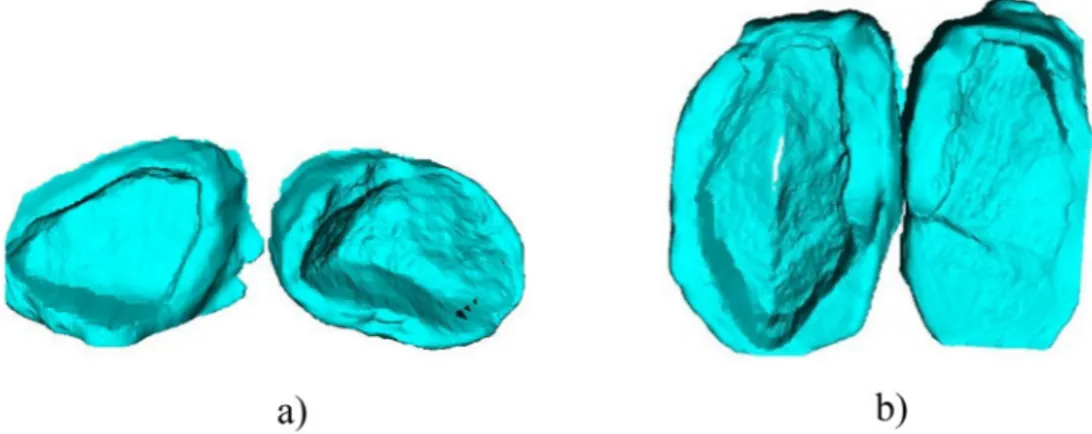
To merge the partial meshes produced for each particle, the fol-lowing steps were performed. First, voids in each sub-mesh werefilled. Second, the mesh parts representing plasticine mould in excess (see Fig. 5) was removed. Third, using mesh translation and rotation, the two halves were matched, and a new mesh was generated, as shown in Fig. 6. Several 3D modelling tools were used for this task, namely Meshmixer, CloudCompare, GOM Inspect and Rhinoceros[13].
Although the process of mechanical digitization is relatively slow, taking several hours per piece, it is predictable and runs unsupervised.
When compared to non-contact methods, the mechanical scanning method has several advantages, namely: the equipment is easily available in Fablabs where it can usually be used for free, the precision is well defined, it offers a regular grid which is easy to process and avoids errors from numerical interpolation. No noise is generated during the scan, contrary to laser or photogrammetry. All points cor-respond to contact between the needle and the object, be it the particle or the mould. Meshing, i.e. the generation of triangle-based surfaces is therefore much easier, requiring less tuning of the meshing algorithm. In addition, indirect methods must be calibrated before each use, cloud points require careful positioning of the samples and the use of posi-tioning targets and do not work well on rocks with crystals with re-flecting characteristics such as quartz. Finally, with the contact scan it is possible to obtain points in the exact position in consecutive sweeps, without position matching.
Fig. 2. Aspect of the demoulding of a gypsum mould.
Fig. 3. Aspects of the execution of testing plasticine moulds: (a) particle I; (b) particle II.
Digitization with laser scanning equipment
Equipment and preliminary tests
To compare and access the performance of the contact scanning method, particles were also digitized using a Creaform EXAscan portable laser scanner. This equipment has a laser emitter, three high definition cameras and eight LEDs located around the cameras (Fig. 7). According to the manufacturer, image resolution is 0.05 mm, and accuracy is at least 0.04 mm, permitting the scanning of surfaces with detail and texture of objects of relatively small dimensions, as is the case of ballast particles. In this method an external reference system is not necessary, as the point cloud localization is obtained with the aid of retroreflective targets, consisting of adhesives placed in the object or in the sur-rounding area, forming an irregular pattern. At the beginning of the process, the targets are recognized by the scanner and a reference system is automatically generated, so it is important that the targets’ positions remain constant throughout the scan. Reflected laser beams are captured, and, through triangulation, the location of the equipment is calculated in real time. Thus, it is necessary that, as in a GPS system, the beam hits three or more auxiliary targets at all times. The ambient light reflected by the scanned surface is captured by the cameras, so the colour of the captured points is also recorded along with their position. The equipment’s native software creates a high-resolution triangle mesh of the object in real time during operation, with the resulting data being exported and available to be processed in digital meshing and manip-ulation software.
Several tests were carried out with the equipment to check the viability of the solution and to optimize the scanning process. For this, a particle (particle III) was placed on a table with reflective targets and then scanned with a resolution of 0.2 mm (Fig. 7).
Throughout the procedure it was verified that the laser was re-fracted by granite quartzites, generating voids in the triangule mesh. Treatment of these small areas of the mesh was necessary, which was done by spraying it with a mixture containing afine and uniform grain powder. After drying this spray creates a thin film on the surface, making it opaque. It should be noted that the powder, although forming a thinfilm, may introduce a small error in the measurement of particle size. Also, information about the point colour is not captured.
The scanning process with 0.2 mm resolution had a duration of approximately two hours, which included temperature, atmospheric pressure and luminosity equipment calibration. Scanning at 0.2 mm resolution requires very controlled and slow scanner movement, otherwise the mesh will have“voids” corresponding to regions where no data is captured. This level of resolution provided details on the level of“rough texture”[11](Fig. 7d).
Since the particle was laid on a surface, it was digitized in phases: the upwardly oriented surface was scanned, then the particle was ro-tated and scanned again. The process was repeated until the whole particle was captured. As a result, three separate meshes with common regions were obtained. Mesh manipulation and regularization was thus necessary to obtain a unified particle mesh. After scanning, the particle was printed at full scale on a polylactic acid (PLA) 3D printer. As seen in Fig. 5. Digital models of the particles’ moulds obtained with the Roland Modela MDX-20 and the Dr. Picza software: (a) particle I; (b) particle II.
Fig. 8, the particle and its replicate are very similar to the naked eye, which highlights the method’s precision.
Enhancements to the Laser scanning
Since the laser scanning process was slow and multi-step, im-provements were performed to make it more useful in a real-world si-tuation with large number of particles. In thefirst phase, different levels of resolutions were tested in a new particle (particle IV) to evaluate to what extent quality was adulterated. As expected, the lower the re-solution, the faster the process: two hours for 0.2 mm rere-solution, one hour for 0.5 mm resolution and 30 min for 1 mm resolution. Of course, with lower resolution, the detail level degrades, in particular at the edges of the particle where the meshing algorithms interpolates be-tween available points and cannot represent abrupt geometry varia-tions. Regarding the surface texture, at 0.5 mm resolution, it was still possible to capture details of the “smooth texture”; with 1.0 mm re-solution, it is only possible to detect the contours of the particle, as can be seen inFig. 9. Regarding particle volume calculated from the nu-meric mesh, the difference between 0.2 mm and 1.0 mm is less than 1%. Thus, to render the scanning procedure feasible for a considerable number of particles and if that the rough texture of the particle surface was not a goal in this phase of the study, a resolution of 1.0 mm could be adopted.
A second improvement to the procedure was to build a support pedestal to elevate the particle and allow the entire surface to be scanned at one time. This has two advantages: a single scan is enough for the whole particle, and the generated mesh includes the whole mesh, so no merging is necessary. The support consists of a steel rod with a 5.0 mm diameter and a PVC base, the assembly being about 150 mm tall. Before the scanning process, a circular, 10 mm deep hole is drilled on one of the more regular faces using mechanical equipment (Fig. 10). The hole was drilled on aflat surface of the particles, to re-duce deviations from reality in the reconstruction of this part of the mesh in the 3D modelling software. Since the particle is no longer laid
on a table, a screen with reflective targets was assembled (Fig. 10c). Fig. 11shows the same particle scanned in three phases, lying on the scanning table, and in one phase, using the pedestal. Apparently, the meshes look similar, but mesh density is different, and volume differs by about 5%. Full scanning of the particle in one phase was considered more rigorous, when compared with laboratory volume measurements. Scanning in one sweep with the pedestal also reduces the processing time from 30 to 15 min using the 1.0 mm resolution. A much shorter editing time of the mesh also greatly enhances pro-ductivity. The major disadvantage of the process is the need to drill the rock.
Comparison of contact and laser scanning
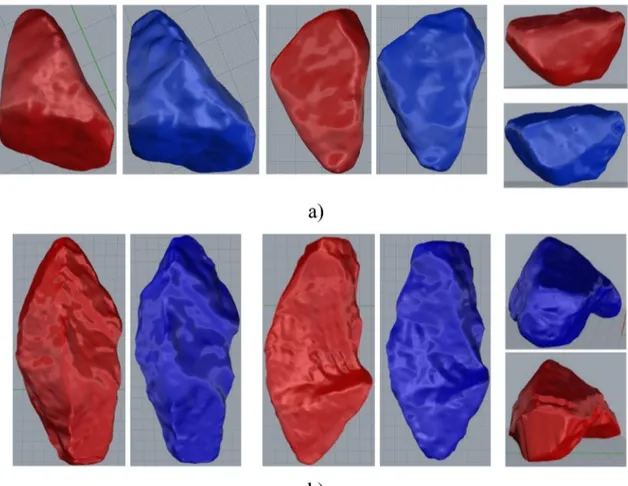
Particles I and II, which had previously been digitized by the me-chanical procedure were also processed using the laser scanner. After scanning, 3DReshaper software was used to close and regularize the digital mesh and to calculate the volume of each particle digital re-presentation.Fig. 12shows views of the digital representations of the particles.
Meshes for particle I obtained by the two methods look similar when analysed in 3D views. Their volumes differ in 3%, taking as reference the volume obtained with the laser. As far as particle II is concerned, the shapes obtained are somewhat different and the volumes of the two meshes differ by about 15%. In both cases, the volume evaluated by the mechanical method is higher.
Comparing quantitatively geometries of the digital representations wefind that the largest difference is about 2.7 mm in particle I and 4.5 mm in particle II (Fig. 13); in most of the surfaces, the absolute maximum difference is less than 0.3 mm in the first case and 1,5 mm in the second.
In conclusion, the differences are more significant in the case of particle II, which exhibits an elongated, irregular shape and several concavities. In fact, in the mechanical digitization, some recesses were Fig. 7. Laser scanning process: (a) equipment; (b) particle in table with reflective targets; (c) particle digital model; d) detail of the digital model.
not captured. In addition, for the same resolution value, the scanning times of both particles by the mechanical procedure was about 6.5 h, while the laser procedure took about 15 min. For the mechanical scanning, preparation of the particles and their moulds and the digital manipulation and gluing of the scanned meshes is also much higher.
Analysis of laser scanning precision
Visual comparison of the real ballast particle versus the scanned meshes and the 3D printed particle gave a good indication of the digital representation accuracy. To quantify it, particle volume was measured in laboratory and numerical models. Volume was chosen as an accuracy indicator since it is one of the geometric characteristics that can be directly and unequivocally measured in the laboratory.
Twenty-one particles were selected from a sample of competent rail ballast. These particles were hand-picked to contemplate the different forms that the ballast particles can take. The shape index of the picked set was 15%, considerably higher than the integral sample (6% shape index). The picked set is not considered adequate for rail ballast ap-plication, contrary to the integral sample.
Particle volume in the laboratory was determined by immersion in water. Precision gauges of 5 and 10 cm3were used, depending on the
particle size. Particles were saturated in a water bath for one day. All particles were measured more than once to confirm their volume.
Digital volume was determined from the scans performed with the EXAscan laser scanner with a resolution of 1.0 mm, using a pedestal. As previously described, the steel pole was eliminated from the mesh and the 5 mm wide circular hole in the mesh corresponding to its insertion wasfilled in 3D modelling software MeshLab.
Fig. 14a displays the relationship between volume measured by immersion of the real particle and the volume measured in the digital models before the test. It can be concluded that the values follow a good
correlation. Considering the volume measured by immersion as a re-ference, the largest difference is 12%, the mean value of the difference is 4% and the standard deviation of the distribution of the differences is 5%.Fig. 14b shows the same comparison after the accomplishment of the micro-Deval and the Los Angeles tests. Again values obtained by both immersion and digitalization correlate well, which reinforces the idea that the scanning method is adequate not only for intact particles but also for the determination of erosion after resistance testing, in-dependently of the test type.
To assess how laser scanning identifies particle damage caused by fragmentation and wear tests, the 21 particles were divided into two sets: one set was subjected to a Los Angeles test (EN 1097-2: 1998) and the remainder to the micro-Deval test (EN 1097-1) and then re-mea-sured and re-scanned. As these tests cause aggregate erosion and shape change, the selected particles were numbered and photographed at various angles so that, at the end of the test, they could be distinguished from each other and from other particles that must to be added to complete the test sample. To reinforce identification of the particles, the hole previously made in each particle for the installation on the ped-estal wasfilled with plasticine, whose colour varied for each particle.
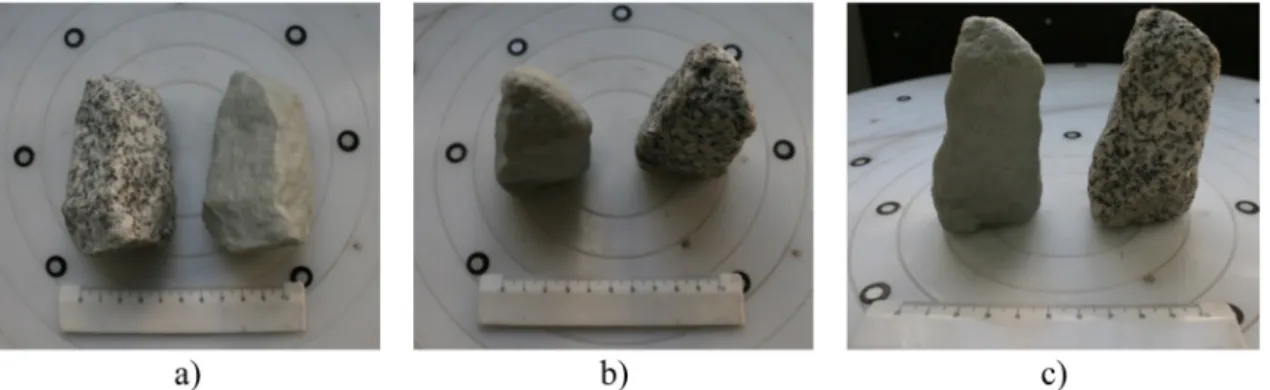
As expected, particles lost some of their volume during the tests, generatingfine material, as seen inFig. 15. The value of the Los Angeles coefficient of the tested sample was 16 and the value of the micro-Deval coefficient was 6.5, which confirms that, resistance wise, the material is adequate for a ballast layer. Being more aggressive, the Los Angeles test fragmented the particles, resulting in the destruction of four of the eleven particles. In the micro-Deval test, no fragmentation occurred, but particles came out in a rounder shape, as shown inFig. 15.
Theflakiness (EN 933-3) and shape (EN 933-4) indexes of the initial sample, with 21 particles, were 9% and 15%, respectively. After the test both indexes decreased to 7%.
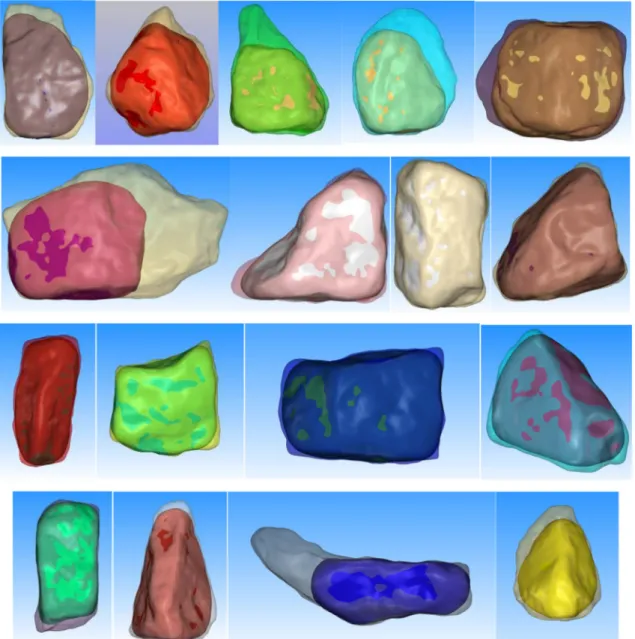
Fig. 16displays the superposition of the particle before the test, Fig. 9. Laser scanning digitization of particle IV: (a) particle; (b) scanning at 0.2 mm resolution; (c) scanning at 0.5 mm resolution and (d) scanning at 1.0 mm resolution.
shown in semi-transparent hue, and after the test. This comparison puts in evidence with detail and quantifiable precision the results of the resistance tests, and is only possible with 3D scanning. The particle fitting was performed using the Best Fit algorithm of the 3DReshaper software. In particles that suffered large shape change, the algorithm had difficulties in adjusting the two meshes, and in some areas, the final form exceeds the contours of the initial one, which is, of course, im-possible since no material as added to the particles. However, it was always guaranteed that the residues are lower than the scanning re-solution.
Fig. 17quantifies the difference (performed with the GOM Inspect software) in particles that suffered large degradation following the Los Angeles and micro-Deval tests.
The regions of the particles where the larger loss of material has
occurred are shown inTable 1. In micro-Deval test, most of the particles suffered an erosion in corners and edges, which confirms the visual observation that particles acquire a rounder form. In the Los Angeles test, although there is also erosion in corners and edges, many of the particles lost larger pieces in the prominent regions. Thus, it is under-standable that the particles which were subjected to the Los Angeles test exhibit larger differences in consecutive scanning.
The conclusion is that not only the digital scanning captures the geometry and volume difference due to wear and breakage, but also supports other assessments, such as comparison before and after test, geometryfitting, while opening the door to more sophisticated ana-lyses.
Fig. 11. Digital models of particle IV: (a) particle scanned in 3 phases; (b) particle scanned in a single phase, with the aid of the support.
Fig. 12. Digital representations (laser scanning in red and mechanical scanning in blue): (a) particle I; (b) particle II. (For interpretation of the references to colour in thisfigure legend, the reader is referred to the web version of this article.)
Particle shape characterization from digital models
Digital model manipulation may be also useful for an efficient de-termination of the geometric parameters of the particles, such as par-ticle size, flakiness and shape index. In addition, other indices have been proposed for analysis and classification of particle geometry, such as the sphericity (ψ), which can be calculated by the following ex-pression[35]: = + + + + + ψ S I I L S I I L S I I L 12, 8 ( / ) ( / ) 1 ( / )(1 ( / )) 6 1 ( / ) (1 ( / ) ) 2 2 2 3 (1) where L, I and S are the dimensions measured according to the major (“length”), intermediate (“width”) and minor (“thickness”) axes of the particle. From the analysis of the previous expression, two ratios stand out, S/I and I/L, which correspond, respectively, to theflatness ratio (p) and the elongation ratio (q). In turn, the form factor (F) can be defined as the quotient between theflatness ratio and the elongation ratio. A cubic or a spherical particle has a unit value form factor; a laminar particle has a shape factor greater than unity; in an elongated andfine particle, this factor is less than one.
Fig. 18 proposes a particle classification in terms of shape, as a function of the values assumed by these parameters: particles may show a discoid, cubic, rod or laminar formFig. 18 [33].
To ascertain the potential of the techniques and numerical tools available, particle dimensions were measured in the direction of the major, intermediate and smaller axes of each of the digital meshes using the GOM Inspect software. In an iterative process, the direction that can lead to the determination of the largest dimension is found and mea-sured using the Outer Disc Caliper function. Once the L axis is de-termined, it is aligned with one of the axes of an orthogonal Oxyz re-ference frame. The particle is then rotated around the L axis tofind the position leading to the largest intermediate axis I, and finally, the smallest axis, S.Fig. 19 displays this numerical procedure. Measure-ments were performed before and after the fragmentation and wear tests, allowing the calculation of the sphericity in both situations. Table 2shows the particle classification according to the abacus pre-sented inFig. 19(only 17 of the initial 21 particles were used, since the remaining 4 were damaged during the tests).
The relationship between the calculated sphericity value before and after the fragmentation and wear tests is shown inFig. 20. This index did not vary significantly, particularly in the particles that were sub-jected to the micro-Deval test. Although the sample under analysis is relatively small, the data allows several conclusions. First, the percen-tage of particles with a cubic shape is relatively low for a rail ballast layer, which is a consequence of the fact that particles were picked to represent the diversity of shapes that can be found in a ballast material. Fig. 13. Colour scale representation of the differences between laser scanning and mechanical scanning: (a) particle I; (b) particle II. (For interpretation of the references to colour in thisfigure legend, the reader is referred to the web version of this article.)
Fig. 15. Particles after resistance testing: (a) Los Angeles sample; (b) micro-Deval sample.
Second, the degree of sphericity of the particles varied very little after the mechanical tests; and there is no pattern of change associated with the different tests. Third, the digital scanning and numerical analysis workflow efficiently determines ballast particle geometric parameters. Final considerations
The major conclusions of the study are enumerated below:
•
Both methods, mechanical and laser scanning can capture the geo-metry of the rock ballast particles;•
The mechanical scanner is cheaper (scanner costs less than€2000 and is standard equipment in Fabrication Laboratories that usually grant free access, seehttp://www.fabfoundation.org/), produces, directly from the scan, a better-quality mesh and is not affected by transparent or reflective minerals. Although scanning can run without supervision, it takes longer, mesh merging is more difficult and introduces errors, particle size is limited, and no colour in-formation is obtained. The choice of the optimal method is not evident, and the authors do not aim to provide a definitive answer to this question, as it depends on researcher context and other criteria. Contact based scanning is advantageous when the available budget is low (can be zero if there is access to a Fablab), as well as the number of particles to scan, the size of the smallest feature to cap-ture is not smaller than 0.5 mm, a monochrome capcap-ture is sufficient Fig. 17. Mesh comparison before and after resistance tests: (a) Los Angeles test (particle 7); (b) micro-Deval test (particle 1).Table 1
Particle material loss after Los Angeles (LA) and micro-Deval (MD) tests.
Particle Shape Flakiness Maximum difference (mm) Wear location Test
2 Cubic Not Flat −9.44 Corners and Edges LA
3 Cubic Not Flat −20.16 Corners and Edges LA
4 Cubic Flat −12.15 Corners (one) LA
6 Cubic Not Flat −7.58 Corners LA
7 Non Cubic Not Flat −32.55 Corners (one) LA
j Non Cubic Not Flat −21.86 Corners LA
I Cubic Not Flat −6.19 Corners and Edges LA
1 Non Cubic Flat −7.95 Corners and Edges MD
8 Cubic Not Flat −3.85 Corners and Edges MD
9 Cubic Not Flat −2.43 Corners and Edges MD
10 Cubic Not Flat −3.15 Corners and Edges MD
a Cubic Not Flat −3.3 Corners and Edges MD
c Non Cubic Flat −3.3 Corners MD
f Cubic Not Flat −3.29 Corners and Edges MD
g Cubic Not Flat −2.81 Corners and Edges MD
h Cubic Not Flat −7.58 Corners and Edges MD
i Cubic Not Flat −3.68 Corners MD
and the researchers do not want to delve into cloud point treatment and meshing algorithms.
Other conclusions of the research are:
•
Laser scanning is more expensive (handheld scanners cost more than €5000), demand stable environments in terms of lighting and air moisture and temperature and their utilization demands greaterexpertise, but produce an almost ready mesh which is produced by the scanners’ software, and also deliver particle colour information.
•
Several improvements on laser scanning technique were performed, the main being the pedestal and the background screen, which al-most remove the variability associated with the scanning operator and 3D modelling manipulation, eliminating the need for the mesh merging, which is the most complex digital manipulation operation.•
The method’s precision is confirmed by particle dimensional and volume comparison between laboratory and digital meshes.•
From digital models of a particle set it was possible to calculate geometric parameters and their evolution in face of particle de-gradation during mechanical testing. Laser scanning detects and quantifies particle wear and fragmentation in a way that is not possible with previous methods, which could only quantify volume / mass loss and qualitative shape change. More sophisticated analyses can now be explored, such as calculation of sphericity, as ex-emplified.•
3D printing allows the reconstitution of tested particles. In this work printing material was plastic, but stiffer, denser materials can be employed.Regarding future areas of work, the authors consider that develop-ments external to geotechnics will place an array of very potent and useful tools in the researcher’s hands. These developments are:
•
Scanning hardware that is more powerful, cheaper, more robust and easier to use.•
Algorithms for digital geometry manipulation that include vision and artificial intelligence.•
Continuous computer processing power increase associated with 5G mobile networks, cloud computing and evolution of graphics card processors will allowfield capture and transmission of large data volumes for remote computation.The authors are working in parallel in the utilization of photo-grammetry for ballast particle scanning, that is, the process of building digital meshes from multiple photographs, relying on image recognition and matching algorithms for 3D models’ reconstruction. This line of work aims at improved resolution at faster scanning speed, which will allow for the accurate quantification of other important geometrical features of the ballast particles, namely surface roughness[21].
With contact-based scanning all kinds of materials and surfaces, even transparent ones, can be scanned, but the same is not true for Laser or photogrammetry digitization, so the authors keep investigating the reliability of photogrammetry in rock types employed in ballast that do not have such rich and heterogeneous colours, such as limestone and synergic aggregates.
Fig. 19. Digital determination of particle dimensions L (a) and S (b).
Table 2
Particle classification as determined by analysis of digital models. Particles in grey suffered shape change.
Particle Before testing After testing ΔF Test F Classification F Classification 1 0.57 Laminar 0.56 Discoid −0.01 MD 2 1.07 Cubic 1.04 Cubic −0.04 LA 3 1.08 Cubic 1.13 Cubic 0.05 LA 4 0.79 Discoid 0.95 Cubic 0.16 LA 6 0.89 Cubic 0.85 Cubic −0.04 LA 7 0.78 Laminar 0.68 Discoid −0.10 LA 8 1.06 Cubic 1.16 Cubic 0.10 MD 9 1.51 Rod 1.46 Rod −0.06 MD 10 1.12 Cubic 1.13 Cubic 0.01 MD a 1.93 Rod 2.06 Rod 0.13 MD c 0.44 Discoid 0.42 Discoid −0.02 MD f 1.05 Cubic 1.08 Cubic 0.03 MD g 1.11 Cubic 1.14 Cubic 0.03 MD h 1.31 Rod 1.18 Cubic −0.13 MD i 1.30 Rod 1.12 Cubic −0.18 MD j 1.55 Laminar 1.18 Rod −0.37 LA I 1.49 Rod 1.40 Cubic −0.09 LA
Fig. 20. Particle sphericity before and after fragmentation and wear tests de-termined by numerical analysis of the digital meshes.
partial meshes belonging to the same particle. After that, a third algo-rithm builds the complete mesh of each particle and assigns an iden-tifier. This would allow the utilization of the 3D scanning in bulk analysis in the laboratory and, in the future, automatic classification of particles in the laboratory or thefield.
Declaration of Competing Interest
The authors declare that they have no known competingfinancial interests or personal relationships that could have appeared to in flu-ence the work reported in this paper.
Acknowledgements
The authors thank the EDP FabLab, Geotrilho and SD3 for gra-ciously collaborating in the study. Part of the work was conducted in the framework of the TC202 national committee of the Portuguese Geotechnical Society (SPG)“Transportation Geotechnics”, in associa-tion with the Internaassocia-tional Society for Soil Mechanics and Geotechnical Engineering (ISSMGE-TC202). This research was partially funded by Foundation for Science and Technology (FCT) through ISTAR-IUL’s project UID/MULTI/4466/2018.
Appendix A. Supplementary material
Supplementary data to this article can be found online athttps:// doi.org/10.1016/j.trgeo.2019.100302.
References
[1] Anochie-Boateng JK, Komba JJ, Mvelase GM. Three-dimensional laser scanning technique to quantify aggregate and ballast shape properties. Constr Build Mater 2013;43:389–98.
[2] Barbieri G, Silva FP. Acquisition of 3D models with submillimeter-sized features from SEM images by use of photogrammetry: a dimensional comparison to micro-tomography. Micron 2015;121:26–32.
[3] Chen C, McDowell GR. An investigation of the dynamic behaviour of track transi-tion zones using discrete element modelling. Proc Instit Mech Eng Part F: J Rail Rapid Transit 2014.
[4] Descantes Y, Russo F, Balabaud JM. Angularity assessment of several railroad bal-last sources using image processing. Advanced characterisation of pavement and soil engineering materials; Athens, Greece; 20-22 Jun. 2007. p. 1809–16. [5] Fortunato E. Renovação de Plataformas Ferroviárias. Estudos Relativos à
Capacidade de Carga PhD. Thesis Porto: Faculdade de Engenharia da Universidade do Porto; 2005.
[6] Fortunato E. Comportamento estrutural de vias férreas balastradas. Contributos para melhorar a eficiência e a qualidade da operação. Lisboa: LNEC; 2016. ISBN: ISBN 978-972-49-2280-5.
[7] Guo Y, Markine V, Song J, Jing G. Ballast degradation: Effect of particle size and shape using Los Angeles Abrasion test and image analysis. Constr Build Mater 2018;169:414–24.
Numérica de Partículas Rochosas para Balastro Ferroviário MSc. Thesis Porto: Faculdade de Engenharia da Universidade do Porto; 2014.
[14] Koohmishi M, Palassi M. Evaluation of morphological properties of railway ballast particles by image processing method. Transp Geotech 2017;12:15–25. [15] Le Pen L, Powrie W, Zervos A, Ahmed S, Aingaran S. Dependence of shape on
particle size for a crushed rock railway ballast. Granular Matter 2013;Vol. 15:849–61.
[16] Moaveni M, Qian Y, Boler H, Mishra D, Tutumluer E. Investigation of ballast de-gradation and fouling trends using image analysis. 2nd international conference on railway technology: research, development and maintenance - railways 2014; Ajaccio, Corsica, France; 8-11 April 2014. 2014.
[17] Mvelase GM, Gräbe PJ, Anochie-Boateng JK. The use of laser technology to in-vestigate the effect of railway ballast roundness on shear strength. Transp Geotech 2017;11:97–106.
[18] Nålsund R. Railway ballast characteristics, selection criteria and performance PhD Thesis Trondheim, Norway: Norwegian University of Science and Technology; 2014.
[19] Nurmikolu A. Degradation and frost susceptibility of crushed rock aggregates used in structural layers of railway track PhD Thesis Tampere, Finland: Tampere University of Technology; 2005.
[20] Paixão A, Fortunato E, Calçada R. A contribution for integrated analysis of railway track performance at transition zones and other discontinuities. Constr Build Mater 2016;111:699–709.
[21] Paixão A, Resende R, Fortunato E. Photogrammetry for digital reconstruction of railway ballast particles– a cost-efficient method. Constr Build Mater 2018;191:963–76.
[22] Quintanilla ID, Combe G, Emeriault F, Voivret C, Ferellec JF. X-ray CT analysis of the evolution of ballast grain morphology along a Micro-Deval test: key role of the asperity scale. Granular Matter 2019;30:3–12.
[23] Raymond GP, Diyaljee VA. Railroad ballast load ranking classification. J Geotech Eng Divis 1979;105(10):1133–53.
[24] REFER. RF.IT.VIA.015 - Especificações técnicas para fornecimento de balastro novo. Lisboa: Rede Ferroviária Nacional, EPE; 2015.
[25] Resende R, Muralha J, Ramos AL, Fortunato E. Rock joint topography: three-di-mensional scanning and numerical analysis. Geotech Lett 2015;5(4):318–23. [26] Saussine G, Allain E, Vaillant A, Ribourg M, Neel O. High speed in extreme
con-ditions: ballast projection phenomenon. Birmingham; April: International Workshop on Train Aerodynamics; 2013.
[27] Selig ET, Waters JM. Track geotechnology and substructure management; London: Thomas Telford; 1994. ISBN: 0727720139, 9780727720139.
[28] Sun Q, Zheng Y, Li B, Zheng J, Wang Z. Three-dimensional particle size and shape characterisation using structural light. Geotech Lett 2019;9(4):1–7.
[29] Tolppanen P. 3-D characterization and degradation analysis of rock aggregates PhD Thesis Stockholm, Sweden: KTH Royal Institute of Technology; 2001.
[30] Tutumluer E, Huang H, Hashash Y, Ghataora J. Aggregate shape effects on ballast tamping and railroad. Track lateral stability. Proceedings of the AREMA 2006 an-nual conference. 2006.
[31] Tutumluer E, Qian Y, Hashash YMA, Ghaboussi J, Davis DD. Discrete element modelling of ballasted track deformation behaviour. Int J Rail Transport 2013;1(1–2):57–73.
[32] UIC. Best practice guide for optimum track geometry durability. Paris: Union Internationale des Chemins de Fer; 2008.
[33] Uthus L, Hoff I, Horvli I. Evaluation of grain shape characterization methods for unbound aggregates. 7th international conference on the bearing capacity of roads, railways and airfields (BCRA 2005); Trondheim, Norway; 27-29 Jun 2005. 2005. [34] Voivret C, Perales R, Saussine G, Costa D’aguiar S, Laurans E, Petit P. Multi-unit
tamping machine: beyond the linear performance. WCRR 2013– world congress on railway research; Sydney, Australia; 25–28 Nov. 2013. 2013.
[35] Rodriguez JM, Edeskär T, Knutsson S. Particle shape quantities and measurement techniques-A review. Electron J Geotech Eng 2013;18 A:169–98.

![Fig. 18. Abacus for particle classi fi cation (adapted from [33]).](https://thumb-eu.123doks.com/thumbv2/123dok_br/18137498.870844/10.892.68.839.451.711/fig-abacus-particle-classi-fi-cation-adapted.webp)
