*Corresponding author: E-mail: [email protected]
Received: August 25, 2016 Approved: January 30, 2017
How to cite: Santos PG, Almeida JA, Sequinatto L. Mineralogy of the clay fraction and chemical properties of soils developed from sedimentary lithologies of Pirambóia, Sanga-the-Cabral and Guará Geological Formations in Southern Brazil. Rev Bras Cienc Solo. 2017;41:e0160344.
https://doi.org/10.1590/18069657rbcs20160344
Copyright: This is an open-access article distributed under the terms of the Creative Commons Attribution License, which permits unrestricted use, distribution, and reproduction in any medium, provided that the original author and source are credited.
Division - Soil Processes and Properties | Commission - Soil Mineralogy
Mineralogy of the Clay Fraction
and Chemical Properties of Soils
Developed from Sedimentary
Lithologies of Pirambóia,
Sanga-the-Cabral and Guará
Geological Formations in
Southern Brazil
Pablo Grahl dos Santos(1)
, Jaime Antonio de Almeida(2)*
and Letícia Sequinatto(2)
(1)
Universidade do Estado de Santa Catarina, Centro de Educação Superior do Alto Vale do Itajaí, Departamento de Engenharia Sanitária, Ibirama, Santa Catarina, Brasil.
(2)
Universidade do Estado de Santa Catarina, Centro de Ciências Agroveterinárias, Departamento de Solos e Recursos Naturais, Lages, Santa Catarina, Brasil.
ABSTRACT: Quali-quantitative and crystallographic characterizations of the different minerals of a soil are essential for the best evaluation of its genesis, degree of weathering, active pedogenetic processes, physical and chemical properties, and its potential reserve of mineral nutrients. This study presents the results of mineralogical investigations carried out to
verify the influence of the different lithologies of three geological formations of a sedimentary
nature on the mineralogical composition of the soils and the relation of this mineralogical composition to soil chemical properties. The study area is located in the physiographic region of the Santa Maria River basin in the municipality of Rosário do Sul, RS, Brazil, at 30° 15’ 28” S and 54° 54’ 50” W, with average altitude of 132 m and Cfa climate type. Topolithosequences
were defined from soils developed from the lithology of the Pirambóia, Sanga-do-Cabral and Guará Formations, choosing representative soil profiles based on types of parent
materials and variations in relief and altitude. A general and morphological description of
the profiles was carried out, and soil samples were collected for analysis. The properties
determined were texture, active and potential acidity, organic C, exchangeable Al, sum of bases, CEC at pH7, and base saturation. Mineralogical characterization of the clay fraction
was performed by an X-ray diffractometer (XRD). In most of the profiles, kaolinite was the predominant clay, along with a significant contribution from 2:1 clay minerals and the presence of interstratified minerals in combination with kaolinite, which were related to the chemical properties of the soils. The crystallographic parameters of the kaolinite (full width
at half maximum - FWHM, layer-d spacing, mean crystallite size - D, and mean number of layers - NL) varied, revealing a distinct pedogenetic evolution, which can be attributed to
different degrees of weathering, as well as differences in the source material. Large and asymmetrical reflexes related to the d001 and 002 planes of kaolinite indicated that they are due to the presence of kaolinite-smectite strata in association with pure kaolinites.
INTRODUCTION
Among the various attributes of a soil, the mineralogical composition is one of the most
important because it influences most of the physical and chemical phenomena that
develop in it. The composition, properties, and mineralogical transformations in the parent material can provide a better understanding of the evolution of the weathering and pedogenetic systems (Coelho and Vidal-Torrado, 2003).
The occurrence of different groups and species of clay minerals is conditioned by the
parent material, weathering, and pedogenesis, throughout the stages of stability, transformations, and neoformations (Kämpf et al., 2012a). This large variety of clay
minerals can be represented in different types of soils or even within the same soil profile in the different horizons or layers, making them indicators of weathering intensity.
The hydrolysis reaction is one of the main mechanisms of chemical processes involved in
mineral formation in the clay fraction, and it can occur in different intensities according to
the degree of silicon leaching in the system (bisialitization, monosialitization, alitization)
(Melfi and Pedro, 1977). Neogenesis is another process of great relevance, in which clay
minerals are formed from aluminum ions, silicate, and other elements present in the soil solution. The clay minerals may also undergo incomplete transformations in the soil to
form interstratified minerals or, in acid environments, the 2:1 layer clay minerals may be
intercalated with hydroxyl-Al polymers in the interlayers (Barnhisel and Bertsch, 1989).
Knowledge of the mineralogical composition can indicate the degree of weathering the rock underwent in formation of the soil (Melfi and Pedro, 1977, 1978) and can help in interpretation
of the evolutionary dynamics of the soil and of its properties, with direct consequences for
management practices (Kämpf et al., 1995a). The minerals that constitute the rocks have different susceptibilities to weathering, and as the soils evolve, their mineral composition
comes to depend more on the weathering environment than on the composition of their source material. For this reason, the associations of clay minerals in soils are considered indicators of the degree of soil development (Kämpf et al., 2009a).
One of the main mineral components found in the clay fraction of most Brazilian soils of
low activity clay is kaolinite, as well as iron and aluminum oxides (Resende et al., 2005). In contrast, soils with high activity clay commonly have not only kaolinite, but also 2:1
minerals and interlayers of mica, vermiculite, and smectite. Several studies on the mineralogy of the clay fraction in acidic soils in the south of Brazil point to the simultaneous presence of
gibbsite, kaolinite, 2:1 clay minerals with hydroxyl aluminum polymers, and interstratified minerals (Kämpf et al., 1995b; Almeida et al., 2000; Teske et al., 2013).
Generally, the identification and semi-quantification of minerals of the clay fraction are performed by XRD techniques. According to Brindley and Brown (1980), the reflexes corresponding to basal spacing (d) in plane 001 for kaolinite are of approximately 0.715 nm.
However, variations in this spacing between 0.715 and 0.730 nm may be associated with the
small thickness of the crystals and/or the degree of structural disorder of kaolinite (Moore and Reynolds Jr., 1997); they may also be the result of the presence of interstratified clay minerals of the kaolinite-smectite type (Singh and Gilkes, 1992; Bortoluzzi et al., 2007).
Minerals of a secondary nature account for the vast majority of important phenomena
inherent to soil fertility, physics, chemistry, and management. Clay minerals also make
an important contribution to soil physical properties (texture, structure, consistency, permeability, expansion, and contraction) and chemical properties (nutrient availability, CEC, pH, and sorption of metals), mainly due to the small size of the particles, their high surface area, and surface reactivity (Kämpf et al., 2012b).
Most of the Argissolos, Luvissolos, and Latossolos occurring in the Central Depression of the
state of Rio Grande do Sul are developed from sedimentary rocks of the Permian, Triassic,
composition of the clay fraction of these soils. It is assumed that the soils of the region under
study have different chemical and mineralogical compositions not only due to differences
in their geological formations, but also because of lithological variations in the source material within the same formation, the position of the soils on slopes, and the variations in hydrological conditions. Thus, the general objective of this study was to investigate the mineralogical composition of soils developed from three geological formations of a sedimentary nature in the southwest region of the state of Rio Grande do Sul, and the relation of this mineralogical composition to soil chemical properties.
MATERIALS AND METHODS
The study area is located in the physiographic region of the Campanha Gaúcha, located in the Central Depression Geomorphological Province, Geomorphological Unit of the Ibicuí River-Negro River Depression (Justus et al., 1986), extending from the municipality of Rosário do Sul to Santana do Livramento, RS (Figure 1a). The municipality of Rosário do Sul, the main focus of the soils studied, is located at 30° 15’ 28” S and 54° 54’ 50” W, with
an average altitude of 132 m. The current climate, according to the Köppen classification
system (Köppen and Geiger, 1928), is humid subtropical, with hot summers and cold winters (Cfa) and average annual rainfall from 1,300 to 1,600 mm (PMRS, 2005).
The selection of soil profiles took into account the different types of source materials, variations in relief and altitude, rock outcrops, soil color, accessibility (roads), and cuts (ravines). The profiles P1T1, P2T1, P3T1, P1T4, and P2T4 are located on the Pirambóia Formation, the profiles P1T2, P2T2, and P3T2 on the Sanga-do-Cabral Formation, and the profile P1T3 on the Guará Formation (Figure 1b). The Pirambóia, Sanga-do-Cabral, and Guará Formations were recently identified and individualized in RS (CPRM, 2006) on
areas previously designated as the Rosário do Sul Formation (DNPM, 1989). The Pirambóia
Formation comprises medium to fine sandstones with well-developed lenticular geometry deposited in a continental, eolic environment with fluvial intercalations. Siltite layers may
also occur interspersed with the sandstones. The Sanga-do-Cabral Formation belongs to the
Rosário do Sul group and is characterized by subarkosic and arkosic sandstones in tabular or
elongated lenticular bodies consisting of breccia and intraformational conglomerate, siltite,
and rare argillite deposited in a continental, eolic environment with fluvial intercalations containing fragments of fossil vertebrates. The Guará Formation is composed of fine to
conglomeratic sandstone, with whitish to reddish colors, that is occasionally interspersed with centimetric levels of pellets, contains dinosaur footprints, and is deposited in a
continental desert environment with fluvial, eolic, and lacustrine deposits (CPRM, 2006).
After selection of representative pedons, a general and morphological description of
the soil profiles was conducted, according to the methods described in Santos et al. (2005) and Schneider et al. (2007). The profiles were taxonomically classified up to the
4th categorical level (subgroups) according to the SiBCS (Santos et al., 2013) and the
Soil Taxonomy (Soil Survey Staff, 2014) classifications.
In each sub-horizon of the profiles, a disturbed soil sample was collected for chemical,
physical, and mineralogical characterization. The soil samples were air-dried, crushed, milled and sieved in a 2-mm mesh, separating the coarse fractions and the air-dried
fine soil. Particle size distribution and basic chemical analyses were performed on the air-dried fine soil according to the methods described in Tedesco et al. (1995) and
Claessen (1997).
Active acidity (pH in H2O and 1 mol L
-1 KCl in a 1:1 ratio) was determined by potentiometry.
Organic C was determined by the Walkley-Black method by means of its oxidation with the
dichromate anion in acid medium and redox titration with ferrous sulfate solution in the presence of ferroin indicator. Exchangeable K and Na contents were determined using the
Figure 1. (a) Geographic location of the study area - municipality of Rosário do Sul and Santana do Livramento, RS, Brazil (Image
Landsat 5 Thematic Mapper - Composition 5R4G3B/Datum SAD69 (scale as indicated); and (b) Simplified geological map of part of
the southwest region of the state of Rio Grande do Sul, Brazil. Main Formations - P3T1p: Pirambóia Formation, T1sc: Sanga-do-Cabral
Formation, J3g: Guará Formation, J3K1bt: Botucatu Formation, K1β: Serra Geral Formation (scale as indicated). 10 5 0 10 20 30 40
km N
S E W
(a)
55o15’0” W 55o0’0” W 54o45’0” W
55o15’0” W 55o0’0” W 54o45’0” W
30o0’0” S
30o15’0” S
30o30’0” S
30o45’0” S
30o0’0” S
30o15’0” S
30o30’0” S
30o45’0” S
(b) 55o
15’0” W 55o0’0” W 54o45’0” W
55o15’0” W 55o0’0” W 54o45’0” W
30o0’0” S
30o15’0” S
30o30’0” S
30o45’0” S 30o0’0” S
30o15’0” S
30o30’0” S
30o45’0” S
SOIL PROFILES COUNTY BORDER K1 β gr
K1 β al
were extracted with 1 mol L-1 KCl and determined in an atomic absorption spectrophotometer. Exchangeable Al was obtained by neutralization titration with 0.0125 mol L-1 NaOH after extraction with 1 mol L-1 KCl. Potential acidity (H+Al) was extracted with 0.5 mol L-1 calcium
acetate buffered at pH 7 and quantified by titration with 0.02 mol L-1 NaOH. The sum of bases (SB), cation exchange capacity at pH 7 (CEC), and base saturation (V) were calculated according to the following expressions: SB = Ca2+ + Mg2+ + K+ + Na+, CEC pH7 (T) = SB + (H+Al), and V = (SB/T) × 100, respectively.
The clay fraction was determined by the simplified densimeter method (Bouyoucus,
1962) after dispersing the samples with 1 mol L-1 NaOH solution or Calgon (sodium
hexametaphosphate and anhydrous sodium carbonate). Sand content was quantified
gravimetrically (weighing) after mechanical sieving and oven drying, and silt content
was determined by the difference.
The clay fraction of samples selected from three to four horizons of each profile, which was
used in mineralogical analyses, was separated from the silt by sedimentation, according
to Stokes’ law. Part of the samples of the clay fraction were subjected to saturation with
potassium chloride solution (1 mol L-1 KCl) and another part with magnesium chloride solution (0.5 mol L-1 MgCl
2). After washing away excess salts, oriented clay slides were prepared using the following treatments: saturation with K and Mg and reading at room temperature (K25 and Mg25); saturation with Mg and solvation with ethylene glycol (Mg + EG); and saturation with K and then heating to 100, 350, and 550 °C (K100, K350, and K550). Mineralogical characterization of the clay fraction was performed by XRD using an
automated Philips PW 3710 X-ray diffractometer with copper tube, vertical goniometer with compensation angle of θ/2θ, and graphite monochromator with angular variation from 4 to 40 °2θ. The angular velocity was 0.02 °2θ/s in step mode, with a reading time
of 1s per step. The results were interpreted based on the interplanar spacing (d) and the
feautures of the diffraction reflexes according to Brindley and Brown (1980), Whittig and Allardice (1986), and Resende et al. (2005) through the APD (Automatic Powder Diffraction) and X’PERT HIGHSCORE PLUS programs, allowing identification of clay minerals.
The percentage distribution of the minerals in the clay fraction was estimated by analysis
of the diffractograms of samples on slides of oriented clay and not powder, being a relative semi quantification, calculated by comparison of areas of these minerals with the areas of the main peaks of clay minerals and Al oxides, which does not consider all
the components of the mixture. Iron oxides, quartz, and other minerals are excluded. The percentages indicated refer only to a rough proportion of those minerals.
The average crystallite size (ACS) perpendicular to a given diffraction plane (hkl index) was calculated by applying the Scherrer equation: ACS (hkl) = K λ 57.3/(B - b) cos θ, where: λ = wavelength of the radiation (tube) used; K = proportionality constant (0.9 for cubic
systems); (B - b) = FWHM (full width at half maximum) corrected for the instrumental
effect; B = FWHM of the mineral considered (kaolinite); b = FWHM of a standard mineral (quartz); 57.3 = angle conversion to radians; θ = diffraction angle in the plane in question (obtained from the division of angle 2θ in that position by 2). By calculating the ACS in
the plane (001), the mean number of layers of the clay mineral (MNL) could be calculated by the following expression: MNL = ACS (001)/d (001).
RESULTS AND DISCUSSION
The results of chemical analyses, the particle size distribution for general characterization,
and the taxonomic classification of the soils are shown in table 1. Concerning the results of mineralogical analysis, only the X-ray diffractograms of the samples saturated with
magnesium and read at room temperature will be shown (Figure 2), except for the
Table 1. Physical and chemical properties of soil profiles studied
Horizon Depth Sand Silt Clay pH(H2O) OC SB Al
3+
T V
m g kg-1
g kg-1
cmolc kg -1
% P1T1-PVd: Argissolo Vermelho Distrófico espessarênico (Arenic Kanhapludults)
A1 0.00-0.23 852 68 80 5.53 4.2 1.42 0.16 2.63 54
A2 0.23-0.70 834 86 80 4.67 1.7 0.85 0.58 2.38 36
AE 0.70-0.90/0.95 857 73 70 4.88 1.6 0.42 0.60 1.34 31
E 0.90/0.95-1.10 837 113 50 5.07 0.9 0.26 0.46 0.87 30
Bt1 1.10-1.20 643 87 270 4.71 3.9 1.01 1.95 4.04 25
Bt2 1.20-1.77 500 70 430 4.95 3.7 2.83 2.32 6.35 45
Bt3 1.77-2.44 611 79 310 5.11 1.9 2.26 2.24 4.94 46
BC 2.44-2.88 743 47 210 4.93 2.3 1.28 1.72 3.38 38
Cr 4.30-4.60 876 24 100 4.87 0.2 1.04 0.62 1.44 72
P2T1-PBACal: Argissolo Bruno-Acinzentado Alítico abrúptico (Oxyaquic Hapludults)
A1 0.00-0.20 797 83 120 4.76 7.8 1.33 1.70 4.37 30
A2 0.20-0.42 762 78 160 4.86 7.2 1.31 2.61 5.36 24
2BA 0.42-0.63 474 136 390 4.96 10.0 4.27 8.63 13.46 32
2Bt 0.63-1.25/1.40 598 132 270 5.25 3.9 6.55 9.62 15.47 42
2BC 1.25/1.40-1.70/1.80 713 67 220 5.44 1.6 10.04 5.71 14.75 68
R - 780 110 110 5.35 0.3 11.11 1.71 12.56 88
P3T1-PAal: Argissolo Amarelo Alítico plíntossólico (Oxyaquic Hapludults)
A1 0.00-0.28 801 89 110 4.96 6.6 1.42 0.66 2.91 49
A2 0.28-0.50 609 261 130 4.89 4.5 0.61 1.62 3.06 20
AB 0.50-0.66 680 120 200 4.88 4.3 0.84 2.46 3.90 21
BAx 0.66-0.82 602 148 250 5.01 5.6 1.30 3.29 5.56 23
Btf1 0.82-1.15/1.25 477 163 360 5.04 4.7 1.94 5.55 7.92 25
Btf2 1.15/1.25-1.70/1.85 505 175 320 5.29 2.6 3.14 4.56 8.00 39
R - 818 12 170 5.96 0.5 4.20 0.07 4.40 95
P1T2-PBACal: Argissolo Bruno-Acinzentado Alítico abrúptico (Arenic Hapludults)
A1 0.00-0.18 845 75 80 4.83 6.4 1.72 0.59 3.32 52
A2 0.18-0.34 833 77 90 4.61 5.9 1.28 1.22 4.03 32
A3 0.34-0.51 764 96 140 4.69 5.7 1.50 1.80 4.77 31
BAt 0.51-0.65 597 93 310 4.87 9.2 2.24 4.98 8.90 25
Bt 0.65-0.96 565 65 370 5.06 7.1 1.80 6.10 8.86 20
BC 0.96-1.15 681 59 260 5.02 4.2 1.43 6.28 7.19 20
R - 849 21 130 5.05 1.2 2.04 3.97 4.91 41
P2T2-TCk: Luvissolo Crômico Carbonático típico (Mollic Hapludalfs)
A 0.00-0.35 620 256 124 5.97 10.6 8.26 0.34 10.34 80
Btx 0.35-0.58 478 308 214 6.43 5.1 10.16 1.25 12.41 82
Bt 0.58-0.80 162 564 274 8.81 1.9 24.94 0.00 24.94 100
C/Cr 0.80-0.90 103 663 234 8.92 1.9 28.54 0.00 28.54 100
Cr 0.90-1.80+ 383 463 154 9.28 1.4 27.34 0.00 27.34 100
P3T2-FTd: Plintossolo Argilúvico Distrófico abrúptico (Plintic Paleudults)
A1 0.00-0.22 728 182 90 4.93 5.0 1.30 0.74 2.84 46
A2 0.22-0.60 728 182 90 4.68 3.3 0.99 0.79 2.35 42
2Btf1 0.60-0.78 502 168 330 4.94 4.9 2.26 2.77 6.34 36
2Btf2 0.78-1.20 510 140 350 4.95 4.0 2.62 3.02 6.57 40
2Btf3 1.20-2.00+ 500 150 350 5.17 2.3 3.34 2.46 6.20 54
Cr - 542 408 50 5.50 1.7 16.29 1.12 17.37 94
P1T3-LVe: Latossolo Vermelho Eutrófico típico (Typic Eutrudox)
A1 0.00-0.15 892 28 80 5.32 4.4 0.98 0.32 1.96 50
A2 0.15-0.50 862 38 100 5.12 2.8 0.82 0.56 2.11 39
AB 0.50-0.71 888 2 110 5.16 3.8 0.99 0.57 2.17 46
Bw1 0.71-0.95 845 45 110 5.44 2.0 1.25 0.41 2.07 61
Bw2 0.95-1.45 825 45 130 5.39 2.6 1.73 0.34 2.56 68
Bw3 1.45-1.70+ 778 32 190 5.33 1.7 2.17 0.38 3.07 71
R - 753 77 170 4.78 0.7 0.94 2.93 3.25 29
P1T4-TXp: Luvissolo Háplico Pálico típico (Oxyaquic Hapludalfs)
A1 0.00-0.11 749 121 130 5.35 12.8 4.50 0.07 6.21 72
A2 0.11-0.38 733 143 124 5.27 6.4 3.49 0.35 5.02 70
AB 0.38-0.48 607 119 274 4.97 7.7 5.24 2.99 10.06 52
BAt 0.48-0.70 374 172 454 5.26 10.6 9.98 7.29 18.89 53
Bt 0.70-0.85/0.98 345 241 414 5.60 5.7 21.06 8.00 29.21 72
BC 0.85/0.98-1.25 580 196 224 5.78 3.5 19.98 3.72 23.51 85
R - 841 105 54 5.48 1.1 26.85 0.32 26.95 100
P2T4-PVd: Argissolo Vermelho Distrófico arênico (Arenic Kandiudults)
A1 0.00-0.20 823 63 114 5.01 6.5 1.30 0.61 2.94 44
A2 0.20-0.55 812 74 114 5.14 3.8 1.21 0.64 2.68 45
AB 0.55-0.67 737 89 174 5.10 4.9 2.01 0.91 4.11 49
BAt 0.67-0.77 584 82 334 5.06 8.2 3.21 1.62 6.42 50
Bt1 0.77-0.98 454 102 444 5.00 7.3 3.51 2.23 7.37 48
Bt2 0.98-1.75+ 481 125 394 4.96 4.4 2.64 2.85 6.00 44
R - 675 191 134 5.42 0.7 6.30 3.70 9.05 70
pH in water in a 1:1 ratio; OC: organic carbon, determined by the Walkley-Black method; Al3+
: extracted with 1 mol L-1
KCl; SB: sum of bases (SB = Ca2+
+ Mg2+
+ K+
+ Na+
Clay mineralogy and chemical properties of soils
Toposequence 1: Pirambóia
In the samples of the Argissolo Vermelho Distrófico espessarênico/Arenic Kanhapludults (P1T1- PVd), collected from the highest elevation position in a highly drained environment
and whose substrate (R) was identified as a sandstone, the mineralogical assemblage
of the clay fraction is similar (Figure 2a). Among the phyllosilicates, there is dominance
of the peaks in the positions around 0.72, 0.36, and 0.24 nm, generally attributed to kaolinite; peaks around 1.0, 0.5, and 0.33 nm are indicative of small amounts of micas and/or illites; and low-intensity peaks around 1.48-1.50 nm are attributed to expandable
2:1 layer phyllosilicates. Minor components are represented by hematite and/or goethite
(peaks around 0.27 and 0.25 nm) and by quartz (peaks at 0.42 and 0.33 nm), both in
very low proportions. In the Cr horizon, collected at a depth of more than 4 m, the main
mica peak (1.0 nm) is observed, but the peaks attributable to vermiculites or smectites
are absent. However, their presence in the surface horizons indicates that their formation
occurs at the expense of alteration of micas. The peak of 1.5 nm in the diffractogram of
the sample saturated with Mg seems to be of vermiculite, which could be the product of transformation of micas through loss of K and gain of Mg. In the glycol sample, however,
the “c” spacing increases and does not form a clear reflex, but rather a plateau (data
not shown), indicating small expansion of the 2:1 layers, which may indicate that they are smectites or low-charge dioctahedral vermiculites (Douglas, 1989). There was an incomplete contraction of the 2:1 layers by heating, indicating, in any case, that the 2:1 layer minerals have strong intercalation with interlayered hydroxy-Al polymers (2:1HE).
The peaks at the positions around 0.72 and 0.36 nm, however, are wide and asymmetrical, suggesting that, along with kaolinite, there may be interstratified 1:1-2:1 clay minerals, possibly due to destruction of some of the micas, with formation of kaolinite-smectite
(K-S). The similarity of the mineralogical components, together with the low proportion of 2:1 layer minerals (Table 2), is therefore consistent with the low values of CEC at pH7 and the low clay activity of this soil (Table 1). The great mineralogical similarity of the clay fraction in the A2 and Bt2 horizons, whose textural characteristics are highly contrasting, reinforces the thesis that the high textural gradient of the soil is the result of internal pedogenetic processes.
In the samples of the Argissolo Bruno-Acinzentado Alítico/Oxyaquic Hapludults (P2T1-PBACal),
collected from a high position in a moderately drained condition, whose lithology was fine
sandstone mixed with siltstones of the Pirambóia formation, the mineralogical assembly of
the clay fraction of three horizons analyzed was relatively similar. However, unlike P1T1, the phyllosilicates of the 2:1 layer were larger than kaolinite (Figure 2b) in all the horizons analyzed. In the clay fraction of the rock (R) and the 2Bt horizon, the diffractogram pattern was very similar. In the sample saturated with Mg, the most intense peak with larger area occurred in the position around 1.6 nm, followed by peaks with very low intensity around 1.0 nm, indicative of micas, and at 0.72 nm, indicative of kaolinite. The peak at 0.72 nm is wide and has a strong asymmetry for angles 2θ lower, which may be due to interference of the second order peak of the 2:1 layer minerals, which occurs near the peak of the kaolinite, around 0.8 nm. In addition to these minerals, there were also low concentrations of quartz, identified by the peaks at 0.426 and 0.334 nm. In the sample with Mg + EG, there is displacement of the peaks of 1.59-1.60 nm to a position around 1.71 nm, confirming the presence of smectite. A peak at 0.845 nm was also formed, which proved to be the second-order peak of the glycolic smectites. This was not clearly expressed in the sample only with Mg, but contributed to the peak asymmetry around 0.72 nm, as commented before. In the treatment with K, heating the sample to 100 and 350 °C showed a peak around 1.2 nm, which may be indicative of interstratified mica-smectite. However, in the
K550 sample, this position was displaced to values around 1.0 nm, indicating the presence
of interstratified mica-smectite in association with pure smectite. In the A2 horizon, above
Figure 2. Diffractograms of the clay fraction of the horizons and layers of the soil profiles studied. Samples subjected to saturation treatment with magnesium: (a) P1T1-PVd, (b) P2T1-PBACal, (c) P3T1-PAal, (d) P1T2-PBACal, (e1) P2T2-TCk, (f) P3T2-FTd, (g) P1T3-LVe, (h) P1T4-TXp, and (i) P2T4-PVd. Samples from P2T2-TCk (e2) that were underwent saturation treatment with potassium at different
heating levels: room temperature (K25), 100 °C (K100), 350 °C (K350), and 550 °C (K550). Values in nanometers.
(a) (b)
(c) (d)
(e1) (e2)
(f) (g)
(h) (i)
°2θ Cu Kα
INTENSITY 1000 P1T1-A2 1.501 1.029 0.722 0.501 0.428 0.359 0.336
0.270 0.252 0.239 P1T1-Bt2
1.478
0.723
0.498
0.357
0.334 0.270 0.252 0.238
P1T1-Cr
0.996 0.721
0.498 0.424 0.357
0.333 0.269 0.238 500 0 1000 1500 500 0 2000 1000 0
1000 P2T1-A21.548 1.005 0.720 0.499 0.426 0.3570.334 0.245 0.238 P2T1-2Bt 1.570
0.718 0.521 0.356 0.334
P2T1-R 1.598
1.006 0.722 0.528 0.426 0.357 0.334 0.270 500 0 2000 3000 1000 0 4000 2000 0 P3T1-A2 1.470 1.006 0.716 0.496 0.424 0.356 0.333 0.245 0.238 P3T1-Btf2
1.447 1.002 0.717
0.496 0.423 0.356 0.333 0.237 P3T1-R 1.572 1.032 0.725 0.500 0.418 0.358 0.335 0.269 0.238 1000 500 0 1000 500 0 1500 1000 500 0
P2T2 Cr K25 2000 0 3000 2000 0 3000 2000 2000 1000 0 0 1000 1.238 1.001
0.6250.5290.495 0.426 0.334 0.319 0.252 P2T2 Cr K100
1.235
1.000 0.626
0.499 0.426 0.351 0.318 0.333
0.254 P2T2 Cr K350
1.237
0.999 0.628 0.501 0.425 0.334 0.319 0.254 P2T2 Cr K550
1.216
1.000 0.614 0.497 0.333 0.316
P1T3-A2 800 1000 500 0 2000 1000 0 600 400 200 0 1.418 0.987 0.711 0.493 0.423 0.354 0.332 P1T3-Bw2 1.490 1.012 0.723 0.500 0.427 0.358 0.335 P1T3-R 1.004 0.723 0.499 0.426 0.358 0.333
0.268 0.249 0.237
0.238 0.238 0.270 0.272 P2T4-A2 1000 500 0 1500 2000 500 0 1000 1.483 1.007 0.720 0.4980.4450.426 0.357 0.334 0.269 0.238 0.245 P2T4-Bt1 1.466 1.014 0.718 0.497 0.357 0.334 0.238 P2T4-R 1.621 1.001 0.722
0.5290.5000.425 0.357
0.334
0.269 0.238
10 20 30 40
P1T4-A2 1000 2000 1000 4000 2000 0
10 20 30 40
0 500 0 1.527 0.996 0.717
0.6250.497 0.424 0.355 0.333 0.228 0.245 P1T4-A2 1.570 0.996
0.724 0.627 0.499 0.425 0.354 0.334
0.245 P1T4-R
1.580
1.002 0.724 0.5240.500 0.4260.3560.356 0.334 0.269 0.238 P3T2-A2 1000 500 0 1000 500 0 500 0 1.505 1.003 0.718
0.498 0.4250.405
0.357 0.334
0.269 0.245 0.238 P3T2-2Btf2 1.550 1.012 0.728 0.500 0.419 0.357 0.335 0.269 0.238 P3T2-Cr 1.628 1.002 0.724 0.500 0.425 0.443 0.356 0.334 0.270 0.238 P2T2-A 1000 4000 3000 2000 1000 5000 0 0 0 1.451
0.722 0.496 0.426 0.3540.334 0.303
P2T2-Btx 1.569
1.005 0.527 0.499 0.426 0.353 0.334
P2T2-Cr 1.624
1.013 0.807 0.535 0.426 0.3780.3340.321 0.267
P1T2-A2 1000 500 0 1000 500 0 1.549 1.010 0.720
0.629 0.499 0.426 0.358 0.335 0.246 0.238 P1T2-Bt 1.489 1.021 0.720 0.625 0.498 0.426 0.357 0.334 0.238 P1T2-R 1.611
1.017 0.724 0.533 0.358 0.334
0.332 0.268 0.238
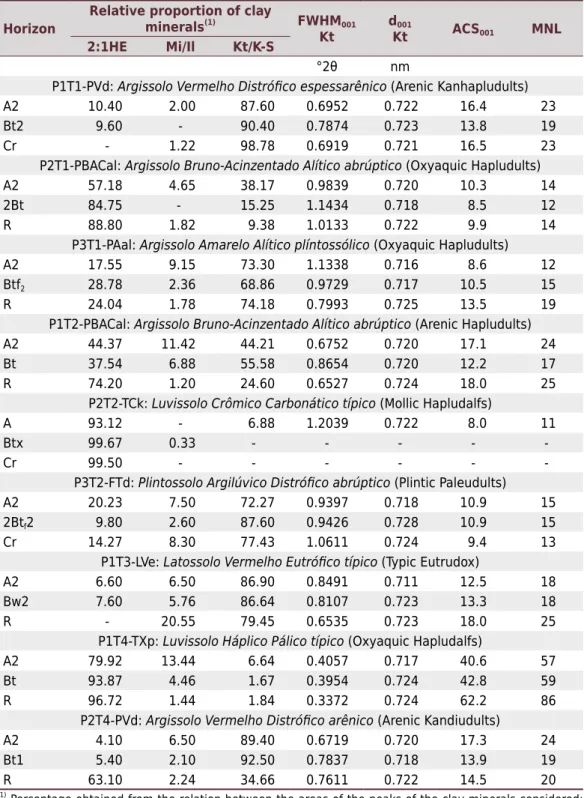
Table 2. Quantitative data of clay minerals and crystallographic parameters of soil kaolinites
Horizon
Relative proportion of clay
minerals(1) FWHM001
Kt
d001
Kt ACS001 MNL
2:1HE Mi/Il Kt/K-S
°2θ nm
P1T1-PVd: Argissolo Vermelho Distrófico espessarênico (Arenic Kanhapludults)
A2 10.40 2.00 87.60 0.6952 0.722 16.4 23
Bt2 9.60 - 90.40 0.7874 0.723 13.8 19
Cr - 1.22 98.78 0.6919 0.721 16.5 23
P2T1-PBACal: Argissolo Bruno-Acinzentado Alítico abrúptico (Oxyaquic Hapludults)
A2 57.18 4.65 38.17 0.9839 0.720 10.3 14
2Bt 84.75 - 15.25 1.1434 0.718 8.5 12
R 88.80 1.82 9.38 1.0133 0.722 9.9 14
P3T1-PAal: Argissolo Amarelo Alítico plíntossólico (Oxyaquic Hapludults)
A2 17.55 9.15 73.30 1.1338 0.716 8.6 12
Btf2 28.78 2.36 68.86 0.9729 0.717 10.5 15
R 24.04 1.78 74.18 0.7993 0.725 13.5 19
P1T2-PBACal: Argissolo Bruno-Acinzentado Alítico abrúptico (Arenic Hapludults)
A2 44.37 11.42 44.21 0.6752 0.720 17.1 24
Bt 37.54 6.88 55.58 0.8654 0.720 12.2 17
R 74.20 1.20 24.60 0.6527 0.724 18.0 25
P2T2-TCk: Luvissolo Crômico Carbonático típico (Mollic Hapludalfs)
A 93.12 - 6.88 1.2039 0.722 8.0 11
Btx 99.67 0.33 - - - -
-Cr 99.50 - - -
-P3T2-FTd: Plintossolo Argilúvico Distrófico abrúptico (Plintic Paleudults)
A2 20.23 7.50 72.27 0.9397 0.718 10.9 15
2Btf2 9.80 2.60 87.60 0.9426 0.728 10.9 15
Cr 14.27 8.30 77.43 1.0611 0.724 9.4 13
P1T3-LVe: Latossolo Vermelho Eutrófico típico (Typic Eutrudox)
A2 6.60 6.50 86.90 0.8491 0.711 12.5 18
Bw2 7.60 5.76 86.64 0.8107 0.723 13.3 18
R - 20.55 79.45 0.6535 0.723 18.0 25
P1T4-TXp: Luvissolo Háplico Pálico típico (Oxyaquic Hapludalfs)
A2 79.92 13.44 6.64 0.4057 0.717 40.6 57
Bt 93.87 4.46 1.67 0.3954 0.724 42.8 59
R 96.72 1.44 1.84 0.3372 0.724 62.2 86
P2T4-PVd: Argissolo Vermelho Distrófico arênico (Arenic Kandiudults)
A2 4.10 6.50 89.40 0.6719 0.720 17.3 24
Bt1 5.40 2.10 92.50 0.7837 0.718 13.9 19
R 63.10 2.24 34.66 0.7611 0.722 14.5 20
(1) Percentage obtained from the relation between the areas of the peaks of the clay minerals considered: 2:1HE = 2:1 (smectite or vermiculite) and/or interstratified 2:1 and/or EHE and/or VHE; Mi/Il = mica (illite); Kt/K-S = kaolinite and/or interstratified kaolinite. FWHM001 Kt = full width at half maximum of kaolinite; d001 Kt = value of the spacing between the kaolinite layer in nanometers; ACS = average crystal size of kaolinite measured on plane 001 (value in nanometers); MNL = mean number of layers of a kaolinite crystal.
were smaller, with an increase in the proportion of kaolinite, indicating a higher intensity of weathering in that horizon. There were also differences in the smectite pattern, whose peaks are more asymmetrical than in the accompanying horizons. The most dissonant
feature was the high concentration of mica/illite in this horizon. Under the hypothesis that
The semi-quantification of clay minerals in this soil revealed a predominance of 2:1 layer
phyllosilicates in all horizons, which was greater than 80 % in the 2Bt horizons and in the R layer, and 57 % in the A2 (Table 2), values that are consistent with the highest CEC at pH 7, clay fraction activity, sum of bases and base saturation (Table 1). In spite of this,
the soil had allytic characteristics in most of the first 1.00 m of the B horizon, a feature
that was attributed to contemporary processes of ferrolysis that cause destruction of part of the smectites, favored by temporary oscillation of the water table (Santos, 2015). In the samples of the Argissolo Amarelo Alítico plintossólico/Oxyaquic Hapludults (P3T1-PAal), collected at a lower topographic elevation than the P2T1 from a pediment
position with imperfect drainage and whose lithology is fine sandstone mixed with siltstones, the diffractograms of the clay fraction indicated similar mineral composition of the horizons (Figure 2c), with predominance of kaolinite (and/or K-S), followed by smectites and micas. The kaolinite was identified by peaks at the 0.72 and 0.36 nm positions, but considering that it presented a variable asymmetry for angles 2θ lower, the presence of interstratified K-S together with kaolinite was considered. Low intensity peaks around 1.0 nm indicate 2:1 micas (or illites), and a more intense peak at 1.45 nm
indicates 2:1 phyllosilicates or chlorite, in this case in larger concentrations than mica,
but smaller than kaolinite. The treatments with ethylene glycol showed displacements of the peaks from 1.45 nm to values around 1.8 nm, symmetrical for the R sample,
but more asymmetrical, forming a plateau, in the upper horizons. The heat treatments revealed incomplete contraction at values around 1.0 nm, indicating possible contribution
of hydroxyl-Al polymers in the interlayers of the smectites (EHE). Peaks indicative of quartz (0.42 and 0.33 nm) were identified in all horizons and in the R layer, but at higher
concentrations in the A2 horizon, due to the sandy texture of that horizon.
The sum of the areas of the 2:1 phyllosilicate (Micas + EHE) peaks ranged from 25 to 30 % of the total area of the clay minerals, with the remainder represented by kaolinite, with
the contribution of K-S (Table 2). The relatively high concentration of smectite in this soil could explain the CEC and higher activity of the clay fraction, but as the clay content is very low in most horizons and layers, this ends up contributing little to the CEC of the
TFSA. However, when CEC pH 7 to soil (Table 1) is converted to kg of clay, the value of
clay activity in the Btf2 horizon is 25 cmolc kg-1 of clay, which is much higher, therefore,
than the values attributed to kaolinite.
Toposequence 2: Sanga-do-Cabral
In the samples of the Argissolo Bruno Acinzentado Alítico abrúptico/Arenic Hapludults (P1T2-PBACal), collected from a high position, but with a moderate natural drainage
condition, and whose lithology is fine sandstone, the clay fraction diffractograms indicate
similar mineralogical composition among the horizons, but with variations in the quantitative.
In the rock (R), smectite predominated, identified by the intense peak around 1.6 nm in the sample saturated with Mg (Figure 2d). This was confirmed in the treatment with ethylene glycol by the displacement of this peak to values around 1.7 nm and by nearly complete shrinkage of the layers after heating of the sample saturated with K to 550 °C (data not shown). The second component of importance is kaolinite (peaks around 0.72, 0.36, and 0.23 nm), followed by mica, with low-intensity peaks around 1.0 and 0.5 nm. In the horizons above the rock (Bt and A2), the situation is inverted, and the kaolinite dominates over the smectites, which have larger peaks than in the rock. However, the Mg + EG treatments and heating of the K-saturated samples confirmed their identification as smectites, with very
low intercalation with interlayered hydroxy-Al polymers. In the Bt and A2 horizons, quartz
(peaks at 0.43 and 0.33 nm) and boehmite aluminum oxide, confirmed by peaks around 0.63 nm, were also identified. The presence of the latter in soils of the region is attributed
Smectites predominate in the R layer in this soil, totaling approximately 75 % of the clay
minerals. In the upper horizons, the smectite decreases and the quantities of kaolinite,
together with illites, increase to about 55 % (Table 2), which may be a result of the
weathering of the smectites, with neoformation of kaolinites, in the environment most
subject to leaching in the upper horizons. The activity of the clay fraction, calculated for the Bt horizon from the data in table 1, is 24 cmolc kg
-1 of clay, which is somewhat low, considering the expressive quantities of smectites still present (Table 2). However,
the values are consistent if we consider that they are expressively superior to kaolinite
CEC and that the smectites have some intercalation with hydroxyl-Al (EHE) polymers, reducing the CEC of this mineral in relation to its corresponding pure minerals.
In the samples of the typical Luvissolo Crômico Carbonático/Mollic Hapludalfs (P2T2-TCk),
collected in the upper third of the hillside and whose lithology is siltstones with limestone
cementation, the clay fraction diffractograms indicate similar mineralogical composition of the horizons, which are composed almost entirely of interstratified chlorite/smectite in the
Cr horizon and which alter to form smectites in the upper horizons (Figure 2e1). This is a
profile that was collected on a hillside with rolling topography, where vertical flows seem to
have been lower, leading to a low leaching rate and the rise of bicarbonates dissolved from
the rock, which reprecipitated in the form of secondary carbonate concretions in the Cr and Bt horizons. The interstratified chlorite/smectite is best identified in the K treatments and in
heating of samples from the Cr horizon (Figure 2e2), where it is observed that, regardless
of the heating temperature, the peaks remained in a position around 1.22 to 1.24 nm. In contrast, in the sample with natural Mg, the main peak occurred at 1.62 nm (Figure 2e1),
increasing to 1.68 nm with ethylene glycol. In the Btx horizon, the sample with Mg shows a
peak only around 1.58 nm, which shifts to 1.68 nm through use of ethylene glycol. There is no peak in the region around 1.00 nm. However, in the samples saturated with K, two peaks
are formed, one around 1.0 nm and the other around 1.25 nm. Their intensity changes as
a result of heating - at 25 °C, the peak around 1.25 nm is more intense than that around
1.0 nm, but the situation reverses with gradual heating to higher temperatures (data not
shown). At 550 °C, the peak around 1.0 nm is more intense than that around 1.25 nm. This leads to the interpretation that as weathering advanced, some of the interstratified
chlorite/smectite became smectites, indicated by practically complete contraction of part of
the expandable minerals with 2:1 layers. In the A horizon, this interpretation is confirmed, since in the 550 °C K treatment, a single peak is formed around 1.00 nm, and the peak
around 1.25 nm disappears entirely.
The mineralogical composition of the clay fraction, composed of more than 90 %
interstratified chlorite/smectite and smectites (Table 2), is therefore perfectly compatible
with the high activity values of the clay fraction, which exceed 100 cmolc kg -1
in the lower horizons (Table 1).
In the samples of the Plintossolo Argilúvico Distrófico abrúptico/Plintic Paleudults (P3T2-FTd), collected in a pediment position with moderate to imperfect drainage and whose lithology is sandstone mixed with siltites, the mineralogical composition of the
clay fraction was similar in the horizons, with a predominance of kaolinite, possibly associated with interstratified minerals of the 1:1-2:1 layer (wide and asymmetrical peaks around 0.72 nm), followed by expandable 2:1 layer phyllosilicates (peaks between 1.5 and 1.6 nm), micas and/or illites (peaks around 1.0 nm), and quartz (peaks at 0.26 and 0.33 nm) (Figure 2f). In the rock-saprolite (Cr), the mica concentration is greater than in the A2 and Btf horizons, shown by the greater intensity of the peak around 1.0 nm in that horizon. In the upper horizons, the lower intensity of the peaks of the mica does not translate into an increase in the intensity of the peaks around 1.5 nm;
on the contrary, they are less intense than in the Cr horizon, indicating that part of
the mica was destroyed by weathering, possibly forming kaolinite. The peaks around
0.72 nm and 0.56 nm are wide and asymmetrical, with the greatest asymmetry in the
with kaolinite-smectite (Sawhney, 1989; Bortoluzzi et al., 2007). The ethylene glycol
treatments, in all horizons, promoted displacement of the position from 1.50-1.60 nm to values between 1.68-1.73 nm, indicating that these were expandable phyllosilicates. However, collapse of the layers by heating was incomplete, indicating smectites with hydroxy-Al polymers between the layers (EHE) (data not shown).
The estimated concentration of minerals in the 2:1 layer (EHE + micas and/or illites) ranged from 12 to 27 % of the clay minerals present (Table 2), values that are compatible with the low activity of the clay fraction in this soil, calculated from table 1 (around 19 cmolc kg
-1
for the sub-horizons of B). Since this value is well above the CEC of pure kaolinite, this
increase is attributed to the participation of the 2:1 layer minerals and possibly also to
the participation of the interstratified K-S minerals.
Toposequence 3: Guará
This toposequence only exhibited the mineralogical data of a typical Latossolo Vermelho
Eutrófico típico/Typical Eutrudox (P1T3-LVe) of medium sandy texture, collected in a smooth
rolling area with long slopes, and its clay mineralogy was similar among the horizons,
constituted predominantly by kaolinite, micas, and/or illites, 2:1 layer phyllosilicates, and quartz. The lithology consists of fine sandstones deposited in a desert environment, with eolic, lake, and fluvial contribution, thus differing from the sandstones of the Botucatu
Formation that occur in adjacent, underlying areas, whose deposits are essentially eolic.
In the rock (R), the kaolinite peaks (0.72 and 0.36 nm) are wide, but with little asymmetry,
indicating crystallites of small size and/or with low structural order. The second component,
less expressive, is represented by micas (peaks around 1.00, 0.50, and 0.33 nm).
In the upper horizons (Bw2 and A2), however, the concentration of micas is reduced
and peaks around 1.4 nm are also identified, which indicates expandable phyllosilicates
(Figure 2g). In the samples of these two horizons, the ethylene glycol treatments
evidenced a slight displacement of the 1.4 nm peaks to angles 2θ lower, but without establishing a definite position, demonstrating a certain expansivity of the minerals.
In the K and heating treatments, contraction of the layers was incomplete, revealing the presence of hydroxy-Al polymers in the interlayer space, implying that it could be EHE or vermiculite with hydroxy-Al interlayer polymers (VHE). However, considering the
presence of micas in the source material, it is more likely VHE, formed by the gradual loss
of K and incorporation of Mg (and hydroxyl-Al polymers) in the interlayer space through
an increase in weathering in the upper horizons. The kaolinite peaks in these horizons are wider and more asymmetrical than in the rock, which may indicate the presence of 1:1-2:1 interstratified minerals in association with kaolinites.
In all horizons analyzed, the content of kaolinite (or kaolinite + interstratified constituents) was higher than 80 %. Mica concentration was 20 % in the rock, and the sum of micas
and/or illites with EHE or VHE was approximately 13 % in the A2 and Bw2 horizons (Table 2). This composition is therefore consistent with the low values of CEC found in this soil (Table 1).
Toposequence 4: Pirambóia
In the samples of Luvissolo Háplico Pálico típico/Oxyaquic Hapludalfs (P1T4-TXp), whose
lithology is siltstones with intercalations of sandstones, the clay fraction diffractograms
indicate similar mineralogical composition among the horizons, with predominance of
expandable 2:1 layer phyllosilicates (peaks at 1.53-1.58 nm), followed by low proportions of micas and/or illites (peaks around 1.0 nm), and an even smaller number of kaolinite peaks at 0.72 and 0.36 nm (Figure 2h). It is an imperfectly drained soil, with many mottles,
mainly concentrated in the middle and lower portion of the B horizon.
peak fully shifts to 1.71 nm, and the second-class (0.85 nm) and third-class (0.57 nm) peaks are more clearly manifested, confirming that they are smectites. However, they appear to contain significant amount of interlayered hydroxy-Al polymers, considering
that in the treatments of heating K-saturated samples to temperatures of 25, 100, and
350 °C, the reflexes were between 1.18 and 1.21 nm (data not shown). Only after heating at 550 °C does the reflex shift and accentuate at the position around 1.0 nm, though still
maintaining asymmetry at lower angles. This feature indicates that they are smectites with interlayered hydroxy-Al polymers (EHE).
The same feauture is observed in the upper horizons (A2 and Bt2), although the EHE peaks in these horizons are wider than in the rock, and the kaolinite reflexes are more evident (Figure 2h), probably indicating kaolinite neoformation at the expense of dissolution of part of the smectites. Unlike the rock, the upper horizons exhibit small reflexes with a spacing around 0.63 nm, interpreted as boehmites or pseudo-boehmites, whose peak
disappears in the samples saturated with K and heated to 350 and 550 °C.
Boehmite is an Al-hydroxide with a low degree of structural order (Hsu, 1989) as a result of the limited number of unit cells and the presence of water between the octahedral slides (Tettenhorst and Hofmann, 1980). Among the Al oxides reported, only gibbsite and, less frequently, boehmite are found in soils. However, Al also forms minerals of low crystallinity and high reactivity (Kämpf et al., 2009b). The occurrence of boehmite in the soil is usually associated with the presence of gibbsite (Barshad, 1964; Wefers and Misra, 1987; Santos et al., 2009). This aluminum oxide occurs in weathered soils,
reflecting progressive loss of Si along with accumulation of Al. Generally, high Al2O3 content and extremely low SiO2 content result in high concentrations of gibbsite and boehmite in the soil (Muhs and Budahn, 2009). Their presence seems to be related to conditions of temporary hydromorphism, due to oscillation in the level of the water table
above the rock, which leads to alternation of oxidation and reduction processes, favoring ferrolysis processes (Brinkman, 1970). According to Chesworth (1972), the conditions
of the chemical potential of H2O required to stabilize boehmite + H2O in relation to gibbsite + H2O or gibbsite + boehmite are unlikely to occur in the weathering zone, due to thermodynamic conditions. In most environments on the earth’s surface where water is present, gibbsite is stable in relation to boehmite. However, in arid and semi-arid
regions or in soil microenvironments where clay films effectively seal the soil structural
units from contact with water, boehmite and gibbsite can be stabilized together, i.e., the boehmite will not be stable on the soil surface, except in the presence of gibbsite and in the absence of water as a separate phase.
Both profiles have high Ca2+ and Mg2+ contents, in combination with very high levels of “exchangeable” Al, whose values exceed 6 cmolc kg
-1 (Table 1). For these
profiles, the hypothesis is that destruction of smectites (possibly beidelites) has been
occurring by ferrolysis, with probable precipitation of disordered Al compounds, such
as pseudo-boehmite. The presence of this material had already been identified in the
Argissolo Bruno-Acinzentado Alítico imperfectly drained from the 2 (P1T2) toposequence, as previously discussed.
The relative proportions of the clay minerals in the horizons of the P1T4 profile were
approximately 80 % smectites and/or EHE in the A2, 94 % in the Bt, and 97 % in the R. The micas and/or illites were 13 % in the A2, 4 % in the Bt, and 1 % in the R, whereas
kaolinites and/or K-S represented 7 % in the A2, 2 % in the Bt, and 2 % in the R (Table 2).
Considering the predominance of EHE in conjunction with illites in this soil, the mineral composition of the clay fraction is therefore compatible with the high values of clay activity calculated from the CEC values of this soil (Table 1).
In the samples of the Argissolo Vermelho Distrófico arênico/Arenic Kandiudults (P2T4-PVd), whose lithology is sandstone mixed with siltstones, the clay fraction
layer and the upper horizons. This soil is located in a high position in a well-drained
natural environment. In the rock, phyllosilicates predominate with d spacing at 1.62 nm in the Mg saturated samples, whereas in the A2 and the Bt1 horizons, peaks of 0.72 and 0.36 nm, generally attributed to kaolinite, are dominant (Figure 2i). Low-intensity peaks of micas and/or illites are also observed in all horizons and layers; well-defined peaks of the quartz (1.334 and 0.426 nm) occur only in the A2 horizon, of sandy constitution. Ethylene glycol treatment of the rock samples caused an expansion of the reflex from 1.62 to 1.72 nm, while the heating treatments resulted in a response
similar to that observed in Luvissolo samples of the same toposequence (P1T4),
confirming the predominance of EHE in the underlying rock and the similar affiliation of the two sedimentary packages of the Pirambóia Formation. In contrast, in the A2
and Bt1 horizons, the 2:1 layer phyllosilicates are not very intense and occur around 1.47-1.48 nm (Figure 2i). After impregnation with ethylene glycol, they move irregularly
to larger spacings, without a precise definition of their position. The K heating treatments cause irregular contraction of the layers, maintaining greater asymmetry of the reflex at the position of 1.00 nm compared to that of the rock after heating to 550 °C. As in most of the soils studied, the reflexes at 0.72 and 0.36 nm are wide and asymmetrical across all horizons and layers, probably indicating kaolinites of small size in association with interstratified K-S. The significant increase in these minerals, from the base to the top of the profile, indicates that in the well-drained and heavily leached environment, most of the smectites were weathered, with formation of kaolinites by neogenesis. However,
the hypothesis of contribution of sandier material of allochthonous origin in the upper horizons cannot be discarded.
Quantitatively, the proportions of the clay minerals in the A2 and Bt1 horizons and in the
R layer of the P2T4 profile were approximately 4 % in A2, 5 % in Bt1, and 63 % in the
R of 2:1 minerals (smectites and/or EHE); 7 % in the A2, 2 % in the Bt1, and 2 % in the
R of micas (illites); and 89 % in the A2, 93 % in the Bt1, and 35 % in the R of kaolinites
and K-S (Table 2).
Crystallographic parameters of “kaolinite”
Assuming that the reflexes in the positions around 0.72, 0.36, and 0.24 nm alude only to the presence of kaolinite, the semi quantification data based on the area of the peaks (Table 2) indicate that this was the predominant mineral in most of the soils studied, with the exception of P2T1-PBACal, P2T2-TCk, P1T4-TXp, and part of the P1T2-PBACal profile, which indicates, in turn, that the physical-chemical features of the soils in the region of Campanha-RS are strongly influenced by the presence
of this mineral.
Kaolinite is generally the main mineral of the clay fraction in soils developed under moist tropical and subtropical conditions, and its neogenesis is conditioned by the intense process of chemical weathering and leaching of basic cations, products of the dissolution of primary minerals and reprecipitation of Si and Al by the process of partial desilication (monosialitization), and it may also occur by partial dissolution of 2:1 clay minerals (Melo and Wypych, 2009). In the case of soils developed from sedimentary
rocks, it may also have been inherited from the source material.
The main crystallographic parameters obtained for the kaolinites from XRD data (Table 2) revealed that the basal spacing values (d) measured in the hkl 001 plane for the kaolinites ranged from 0.711 to 0.728 nm, which, in a way, reflects some
heterogeneity of the source materials in the soils studied. The mean value of this spacing is obtained by calculation, which simulates the “average” shape of the
peak at the position around 0.72 nm. Therefore, any asymmetries of the peak in this position that could be indicating overlap of the peaks of more than one mineral
A large amplitude of spacing values at this position could indicate the presence of
interstratified minerals or even the presence of structural Fe (Singh and Gilkes, 1992;
Melo et al., 2002). Hart et al. (2002), on the other hand, described the possibility that
structural Fe may promote differentiated adjustment of the octahedral and tetrahedral
layers, also promoting the widening of this space. However, in most of the clay samples
studied, the peaks related to kaolinite plane 001 are wide and asymmetrical, probably indicating the contribution of interstratified K-S type minerals, as discussed above. The values of FWHM (Table 2) in the 001-plane ranged from 0.33 to 1.2 °2θ, an unusual characteristic when these values are compared with kaolinites identified in other
environments in Brazil and the world (Melo et al., 2002; Corrêa et al., 2008). This may be due to the fact mentioned above that the FWHM measurement is performed considering
the half maximum height (H) value of the mean shape of the reflex at the position around 0.72 nm, without taking into account that the asymmetry may be due to the presence of two distinct phyllosilicates: kaolinite and K-S.
Nevertheless, according to the Sherrer formula, the higher the FWHM of the mineral, the lower the ACS value. Based on this, it was observed that the ACS001 values for most of the samples were extremely low (Table 2), which could indicate extremely thin
kaolinites, with the exception of the P1T4 profile. Moreover, since the MNL is calculated
by the ratio between the ACS001 and the mean value of the d001 spacing (0.72 nm),
it follows that most of the supposed kaolinites would have between 11 and 25 layers,
with the exception of the Luvissolo Háplico (P1T4-TXp), with 86 layers.
These considerations lead to the conclusion that the “pattern” or “morphology” of the peak at the position of the d001 spacing of the kaolinite needs to be considered more carefully when interpreting the X-ray diffractograms, taking into account that the asymmetries may be indicating the presence of interstratified constituents in combination with the kaolinite, which may be masking identification of the real crystallographic parameters of the kaolinite. Although the presence of wide and asymmetrical reflexes is frequently indicative of the contribution of interstratified K-S in association with kaolinite (Sawhney, 1989; Bortoluzzi,
2007), most of the studies performed in Brazil infrequently and merely mention this
possibility, due to the difficulties of identification and especially of semi-quantification of these interstratified constituents. Generally, the interstratified K-S show arrangement
of the 2:1 layers with random distribution (Borchardt, 1989; Sawhney, 1989), vary in the number of these layers in the crystals and, in more acidic environments, may have
interlayered hydroxy-Al polymers, making their precise identification even more difficult. Their identification and semi-quantification, however, has been attempted through the
use of software such as NEWMOD (Reynolds Jr and Reynolds III, 1996) by which the shape
of the diffractogram of the study can be “simulated” by the introduction of different
amounts of minerals, with characteristics similar to those present in the soil. In the region of Santa Maria, RS, Bortoluzzi et al. (2007) used the software Newmod and Decomprx
and identified a predominance of interstratified K-S over kaolinite in soil developed from sedimentary rocks, similar to those studied here. More recently, with use of Newmod, interstratified K-S were also identified as expressive components in Nitossolos Brunos
and Latossolos Brunos in the extreme south of Brazil by Testoni (2015).
The ACS data generally varied both between horizons and different soils, showing a differentiated pedogenic evolution, which may in part be due to the differentiated degree of weathering, as well as differences in the source material. The mean number
The P1T4-TXp profile has the lowest amount of kaolinite in the sample, but in contrast,
it has the highest degree of structural ordering (lowest FWHM), with ACS ranging from 40.6 to 42.8 nm in the A2 and Bt horizons, and 62.2 nm in the R, showing a much higher MNL than the other soils.
The P2T2-TCk profile exhibited kaolinite in the clay fraction only in the A horizon,
representing about 6.8 % of its composition, and had the highest FWHM value of the soils;
it proved to be a malformed kaolinite, with ACS = 8 nm and only 11 layers per crystal.
The Argissolos Vermelhos Distróficos (P1T1-PVd and P2T4-PVd profiles) are the soils
with the highest amount of kaolinite in their mineralogical composition, showing values
of FWHM, ACS, and MNL similar to each other in the A2 and Bt horizons, evidencing a
certain mineralogical affinity between the sediment packets, since both are developed
over the same Pirambóia Formation.
A comparison between the Argissolo Bruno-Acinzentado Alítico of the Pirambóia Formation
(P2T1-PBACal profile) and that of the Sanga-do-Cabral Formation (P1T2-PBACal profile) showed significant differences in the quantity and characteristics of the mineral material of a kaolinite nature in the A and B horizons, as well as in the underlying lithology (R). The kaolinites of the P1T2-PBACal profile had a better degree of structural ordering than
those of the P2T1-PBACal. In the A2 horizon of the latter, the FWHM was 0.983 nm, with ACS = 10.3 nm and MNL = 14, whereas the A2 of the P1T2 had FWHM = 0.675 nm, with
ACS = 17.1 nm and 24 layers. In the Bt horizon of the P2T1 profile, FWHM was higher than
of the A2 horizon (1.143 nm) with ACS = 8.5 nm and 12 layers; and the Bt of P1T2 had
FWHM = 0.885 nm, with ACS = 12 nm and about 17 layers. Within the profile, the kaolinites
of the surface horizon are generally better formed (ordered) than those of the subsurface.
A significant contribution of kaolinite in the clay fraction of the P3T1-PAal (Pirambóia), P3T2-FTd (Sanga-do-Cabral), and P1T3-LVe (Guará) profiles can be observed, but all have crystallographic parameters indicative of low structural ordering. Typically, the kaolinites
of the soils are more disordered than those of geological deposits (Hughes and Brown,
1979; Herbillon, 1980; Cases et al., 1981). In general, the kaolinites of less evolved soils have lower thickness (ACS) due to lower stacking of layers (lower average number of
layers), and regardless of pedobioclimatic conditions, they have reduced growth in the
basal direction (Melo and Wypych, 2009). According to, In tropical climates, soil kaolinite
usually has low crystallinity (Hughes and Brown, 1979), or a high degree of structural disorder (Brindley et al., 1986).
Additional information on kaolinite characteristics in Brazilian soils can be found in several
studies, such as those performed by Palmieri (1986), Ker (1995; 1997), Melo et al. (2001), and Corrêa et al. (2008).
CONCLUSIONS
With the exception of the P2T1-PBACal, P2T2-TCk, and P1T4-TXp profiles and part of the P1T2-PBACal profile, kaolinite was the predominant clay mineral, but there was a significant contribution of 2:1 clay minerals. There was a direct relation between the
chemical properties of the soils and their mineralogical constitution.
REFERENCES
Almeida JA, Maçaneiro KC, Klamt E. Mineralogia da fração argila de solos vermelhos com
horizontes superficiais brunados do Planalto de Lages (SC). Rev Bras Cienc Solo. 2000;24:815-28.
https://doi.org/10.1590/S0100-06832000000400014
Barnhisel RI, Bertsch PM. Chlorites and hydroxy-interlayered vermiculite and smectite. In: Dixon JB, Weed SB, editors. Minerals in soil environments. 2nd ed. Madison: Soil Science Society of America; 1989. p.729-88.
Barshad I. Chemistry of soil development. In: Bear FE, editor. Chemistry of the soil. 2nd ed. New
York: American Chemical Society; 1964. p.1-70.
Borchardt G. Smectites. In: Dixon JB, Weed SB, editors. Minerals in soil environments. 2nd ed. Madison: Soil Science Society of America; 1989. p.675-727.
Bortoluzzi EC, Pernes M, Tessier D. Interestratificado caulinita-esmectita em um Argissolo
desenvolvido a partir de rocha sedimentar do Sul do Brasil. Rev Bras Cienc Solo. 2007;31:1291-300. https://doi.org/10.1590/S0100-06832007000600008
Bouyoucus GJ. Hydrometer method improved for making particle size analyses of soils. Agron J.
1962;54:464-5. https://doi.org/10.2134/agronj1962.00021962005400050028x
Brindley GW, Brown G. Cristal structures of clay minerals and their X-ray identification. London:
Mineralogical Society; 1980.
Brindley GW, Kao CC, Harrison JL, Lipsicas M, Raythatha R. Relation between structural disorder
and other characteristics of kaolinites and dickites. Clays Clay Miner. 1986;34:239-49. Brinkman R. Ferrolysis, a hydromorphic soil forming process. Geoderma. 1970;3:199-206.
https://doi.org/10.1016/0016-7061(70)90019-4
Cases JM, Lietard O, Yvon J, Delom JF. Étude des propritétés cristallochimiques, morphologiques,
superficielles de kaolinites désordonnées. Bull Minéral. 1982;105:439-55.
Chesworth W. The stability of gibbsite and boehmite at the surface of the earth. Clays Clay Miner. 1972;20:369-74.
Claessen MEC, organizador. Manual de métodos de análise de solo. 2a ed. Rio de Janeiro: Centro Nacional de Pesquisa de Solos; 1997.
Coelho MR, Vidal-Torrado P. Caracterização e gênese de perfis plínticos desenvolvidos
de arenito do Grupo Bauru. II - Mineralogia. Rev Bras Cienc Solo. 2003;27:495-507. https://doi.org/10.1590/S0100-06832003000300011
Corrêa MM, Ker JC, Barrón V, Torrent J, Fontes MPF, Curi N. Propriedades cristalográficas de
caulinitas de solos do ambiente tabuleiros costeiros, Amazônia e Recôncavo Baiano. Rev Bras Cienc Solo. 2008;32:1857-72. https://doi.org/10.1590/S0100-06832008000500007
Companhia de Pesquisa de Recursos Minerais - CPRM. Mapa geológico do estado do Rio Grande do Sul. Escala 1:750.000. Porto Alegre: Serviço Geológico do Brasil; 2006.
Cunha GOM. Mineralogia e formas de alumínio em solos ácidos brasileiros [dissertação]. Lages: Universidade do Estado de Santa Catarina; 2013.
Departamento Nacional de Produção Mineral - DNPM. Mapa geológico do Estado do Rio Grande do Sul. 1989.
Douglas LA. Vermiculites. In: Dixon JB, Weed SB, editors. Minerals in soil environments. 2nd ed. Madison: Soil Science Society of America; 1989. p.635-74.
Hart RD, Gilkes RJ, Siradz S, Singh B. The nature of soil kaolins from Indonesia and western
Australia. Clays Clay Miner. 2002;50:198-207.
Herbillon AJ. Mineralogy of Oxisols and oxidic materials. In: Theng BKG, editor. Soil with variable charge. Lower Hutt: New Zealand Society of Soil Science; 1980. p.109-26.
Hughes JC, Brown G. A crystallinity index for soil kaolins and its relation to parent rock, climate
and soil maturity. J Soil Sci. 1979;30:557-63. https://doi.org/10.1111/j.1365-2389.1979.tb01009.x
Justus JO, Machado MLA, Franco MSM. Geomorfologia. In: Instituto Brasileiro de Geografia e
Estatística. Levantamento de Recursos Naturais. Vol. 33, Folha SH 22, Porto Alegre e parte das folhas SH 21 e SI 22 Lagoa Mirim. Rio de Janeiro: IBGE; 1986. p.313-404.
Kämpf N, Azevedo AC, Costa Jr MI. Estrutura básica de argilominerais 2:1 com hidróxi-Al entrecamadas em Latossolos Bruno do Rio Grande do Sul. Rev Bras Cienc Solo. 1995b;19:185-90.
Kämpf N, Curi N. Formação e evolução do solo (Pedogênese). In: Ker JC, Curi N, Schaefer CEGR, Vidal-Torrado P, editores. Pedologia - Fundamentos. Viçosa, MG: Sociedade Brasileira de Ciência do Solo; 2012a. p.207-302.
Kämpf N, Schneider P, Mello PF. Alterações mineralógicas em sequência Vertissolo-Litossolo na região da Campanha no Rio Grande do Sul. Rev Bras Cienc Solo. 1995a;19:349-57.
Kämpf N, Curi N, Marques JJ. Intemperismo e ocorrência de minerais no ambiente do solo. In: Melo VF, Alleoni LRF, editores. Química e mineralogia do solo: Parte I - Conceitos básicos. Viçosa, MG: Sociedade Brasileira de Ciência do Solo; 2009a. p.333-79.
Kämpf N, Curi N, Marques JJ. Óxidos de alumínio, silício, manganês e titânio. In: Melo VF, Alleoni LRF, editores. Química e mineralogia do solo: Parte I - Conceitos básicos. Viçosa, MG: Sociedade Brasileira de Ciência do Solo; 2009b. p.573-610.
Kämpf N, Marques JJ, Curi N. Mineralogia de solos brasileiros. In: Ker JC, Curi N, Schaefer CEGR, Vidal-Torrado P, editores. Pedologia - Fundamentos. Viçosa, MG: Sociedade Brasileira de Ciência do Solo; 2012b. p.81-146.
Ker JC. Latossolos do Brasil: uma revisão. Geonomos. 1997;5:17-40. https://doi.org/10.18285/geonomos.v5i1.187
Ker JC. Mineralogia, sorção e dessorção de fosfato, magnetização e elementos traço de Latossolos do Brasil [tese]. Viçosa: Universidade Federal de Viçosa; 1995.
Köppen W, Geiger R. Klimate der erde. Gotha: Verlag Justus Perthes. 1928. Wall-map 150 x 200 cm.
Melfi AJ, Pedro G. Estudo geoquímico dos solos e formações superficiais do Brasil. Parte 1:
Caracterização e repartição dos principais tipos de evolução pedogeoquímica. Rev Bras Geocienc. 1977;7:271-86.
Melfi AJ, Pedro G. Estudo geoquímico dos solos e formações superficiais do Brasil. Parte 2: Considerações sobre os mecanismos geoquímicos envolvidos na alteração superficial e sua
repartição no Brasil. Rev Bras Geocienc. 1978;8:11-22.
Melo VF, Schaefer CEGR, Singh B, Novais RF, Fontes MPF. Propriedades químicas e
cristalográficas da caulinita e dos óxidos de ferro em sedimentos do Grupo Barreiras
no município de Aracruz, estado do Espírito Santo. Rev Bras Cienc Solo. 2002;26:53-64. https://doi.org/10.1590/S0100-06832002000100006
Melo VF, Singh B, Schaefer CEGR, Novais RF, Fontes MPF. Chemical and mineralogical
properties of kaolinite-rich Brazilian soils. Soil Sci Soc Am J. 2001;65:1324-33.
https://doi.org/10.2136/sssaj2001.6541324x
Melo VF, Wypych F. Caulinita e haloisita. In: Melo VF, Alleoni LRF, editores. Química e
mineralogia do solo: Parte I - Conceitos básicos. Viçosa, MG: Sociedade Brasileira de Ciência do Solo; 2009. p.427-504.
Moore DM, Reynolds Jr. RC. X-ray diffraction and the identification and analysis of clay minerals.
2nd ed. Oxford: Oxford University Press; 1997.
Muhs DR, Budahn JR. Geochemical evidence for African dust and volcanic ash inputs to terra rossa soils on carbonate reef terraces, northern Jamaica, West Indies. Quat Int. 2009;196:13-35. https://doi.org/10.1016/j.quaint.2007.10.026
Palmieri F. A study of a climosequence of soils derived from volcanic rocks parent
Prefeitura Municipal de Rosário do Sul - PMRS. Perfil Geopolítico do Município. Secretaria de
Planejamento; 2005 [acesso em 08 maio 2012]. Disponível em: http://www.prefeituraderosario. com.br/planeja/planeja.htm.
Resende M, Curi N, Ker JC, Rezende SB. Mineralogia de solos brasileiros: interpretação e aplicações. Lavras: UFLA; 2005.
Reynolds Jr RC, Reynolds III RC. Newmod-for-Windows. The calculation of on-dimensional
X-ray diffraction patterns of mixed layered clay minerals. Computer programm. Hanover. New
Hampshire; 1996.
Santos HG, Jacomine PKT, Anjos LHC, Oliveira VA, Oliveira JB, Coelho MR, Lumbreras JF, Cunha TJF.
Sistema brasileiro de classificação de solos. 3a ed. Rio de Janeiro: Embrapa Solos; 2013.
Santos OS, Coelho ACV, Santos HS, Kiyohara PK. Hydrothermal synthesis of well-crystallised boehmite crystals of various shapes. Mat Res. 2009;12:437-45. https://doi.org/10.1590/S1516-14392009000400012
Santos PG. Mineralogia, gênese e relações pedo geomórficas de solos desenvolvidos de
litologias das formações Pirambóia, Sanga-do-Cabral e Guará na região sudoeste do Estado do Rio Grande do Sul [tese]. Lages: Universidade do Estado de Santa Catarina; 2015.
Santos RD, Lemos RC, Santos HG, Ker JC, Anjos LHC. Manual de descrição e coleta de solo no campo. 5a ed rev ampl. Viçosa, MG: Sociedade Brasileira de Ciência do Solo; 2005.
Sawhney BL. Interstratification in layer silicates. In: Dixon JB, Weed SB, editors. Minerals in soil
environments. 2nd ed. Madison: Soil Science Society of America; 1989. p.789-828.
Schneider P, Klamt E, Giasson E. Morfologia do solo - subsídios para caracterização e interpretação de solos a campo. Guaíba: Agrolivros; 2007.
Singh B, Gilkes RJ. Properties of soil kaolinites from south-western Australia. J Soil Sci.
1992;43:645-67. https://doi.org/10.1111/j.1365-2389.1992.tb00165.x
Soil Survey Staff. Keys to soil taxonomy. 12th ed. Washington, DC: United States Department of
Agriculture, Natural Resources Conservation Service; 2014.
Tedesco MJ, Gianello C, Bissani CA, Bohnen H, Volkweiss SJ. Análises de solo, plantas e outros
materiais. 2a ed rev ampl. Porto Alegre: Universidade Federal do Rio Grande do Sul; 1995.
Teske R, Almeida JA, Hoffer A, Lunardi Neto A. Caracterização mineralógica dos solos derivados de
rochas efusivas no Planalto Sul de Santa Catarina, Brasil. Rev Cienc Agrovet. 2013;12:187-98.
Testoni SA. Mineralogia da fração argila de Latossolos e Nitossolos Brunos com caráter retrátil [dissertação]. Lages: Universidade do Estado de Santa Catarina; 2015.
Tettenhorst R, Hofmann DA. Crystal chemistry of boehmite. Clays Clay Miner. 1980;28:373-80.
Wefers K, Misra C. Oxides and hydroxides of aluminium. Pennsylvania: Alcoa Laboratories; 1987.
Whittig LD, Allardice WR. X-ray diffraction techniches. In: Klute A, editor. Methods of soil