*Corresponding author: E-mail: jaime.almeida@udesc.br Received: October 17, 2016 Approved: March 20, 2017 How to cite: Santos PG, Almeida JA, Sequinatto L, Miquelluti DJ. Pedological heterogeneity of soils developed from lithologies of the Pirambóia, Sanga-do-Cabral, and Guará geological formations in southern Brazil. Rev Bras Cienc Solo. 2017;41:e0160476.
https://doi.org/10.1590/18069657rbcs20160476
Copyright: This is an open-access article distributed under the terms of the Creative Commons Attribution License, which permits unrestricted use, distribution, and reproduction in any medium, provided that the original author and source are credited.
Division - Soil in Space and Time | Commission - Soil Survey and Classification
Pedological Heterogeneity of Soils
Developed from Lithologies of the
Pirambóia, Sanga-do-Cabral, and
Guará Geological Formations in
Southern Brazil
Pablo Grahl dos Santos(1), Jaime Antonio de Almeida(2)*, Letícia Sequinatto(2) and David José Miquelluti(2)
(1)
Universidade do Estado de Santa Catarina, Centro de Educação Superior do Alto Vale do Itajaí, Departamento de Engenharia Sanitária, Ibirama, Santa Catarina, Brasil.
(2)
Universidade do Estado de Santa Catarina, Centro de Ciências Agroveterinárias, Departamento de Solos e Recursos Naturais, Lages, Santa Catarina, Brasil.
ABSTRACT: The source material is one of the factors that most influence soil genesis and the mainly responsible for the nature, composition, and behavior of the soil. Given the geological complexity of the Santa Maria River basin, the objective of this study was to investigate whether the new lithologies described recently may be responsible for a greater variation in soil properties, as well as in the soil taxonomy itself. The study area is located in the municipality of Rosário do Sul, RS, Brazil at 30° 15’ 28” S and 54° 54’ 50” W, with average altitude of 132 m and climate type Cfa. This study was supported by a cartographic base composed of topographic charts, geological maps, satellite images, digital elevation models, and maps of geomorphometric variables, with the support of GPS receivers and GIS.
Topolithosequences were defined from soils developed from the Pirambóia, Sanga-do-Cabral, and Guará Formations, and soil profiles were chosen based on types of source materials,
variations in relief, and altitude. A classical model of slope compartmentalization was applied
for correlation of the geomorphic surfaces with pedogenesis. Soil profiles were described
in a general and morphological manner, and soil samples were collected for analysis. The physical and chemical properties determined were particle size, active and potential acidity, organic C content, Ca2+, Mg2+, K+, and Al3+
. The sum of bases, CEC, flocculation activity and degree of flocculation of the clay fraction, and base (V), aluminum (m), and sodium saturation
were calculated. Soil properties were evaluated through factor analysis and grouping,
which allowed profiles to be grouped based on their variables and identification of which
variables were preponderant in distinguishing them. Furthermore, multivariate analysis
allowed statistical differentiation of the profiles in the same lithostratigraphic unit and in different relief positions, and also differentiation of soils developed from different source
materials and occupying similar positions in the pedo-landscape, through the formation of
homogeneous groups of profiles linked by their degree of similarity.
INTRODUCTION
In geological mapping, the Guará Formation had been interpreted as the Botucatu Formation. Formations that are now individualized as Sanga-do-Cabral and Pirambóia
had been interpreted as being composed of sedimentary rocks of the Rosário do Sul
Formation, which has recently been elevated to the category of the Rosário do Sul Group by the Geological Survey of Brazil (CPRM, 2006). This new and more complex geological interpretation of the region raises new questions about the supposed uniformity of its soil classes, and it is necessary to investigate whether the lithologies now described are responsible for greater variation in soil properties, both in terms of morphology, the soil physical, chemical, and mineralogical properties, and of the taxonomy itself, according
to the Brazilian Soil Classification System (Santos et al., 2013).
Multivariate analysis of the properties of soil profiles in different environments provides
important information that can be used to identify and quantify soil variation associated
with different pedogenetic processes. This can deepen knowledge regarding the
pedogeomorphological relationships of these soils (Carvalho Junior et al., 2008) and
taxonomic interpretation of them by means of numerical classification (Pedron et al., 2012).
Multivariate statistical methods can potentially be applied in pedological surveys and in the
study of soil properties (Webster and Oliver, 1990; Kravchenko et al., 2002), which would make it possible to predict the occurrence of similar pedons and to delimit the mapping
units (Demattê and Garcia, 1999; Demattê and Nanni, 2003; Santos et al., 2015a).
The soils under study developed from the same geological formation are assumed to have
different morphological, physical, and chemical properties, due to lithological variations
in the source material. Thus, the aim of this study was to compare pedons and group similar ones using multivariate statistical techniques, factor analysis, and cluster analysis, based on physical and chemical properties, and identify which properties determine soil
discrimination. An additional aim was to detect differences between profiles of the same geological formation in regard to variations in the sedimentary package, and similarities between the profiles of different formations because of morphogenetic processes that were affected by soil position on slopes and variations in hydrological conditions.
MATERIALS AND METHODS
The study area is located in the physiographic region called the Campanha Gaúcha, in the Central Depression geomorphological province and geomorphological unit called
the Ibicuí River-Black River Depression (Justus et al., 1986), which extends from Rosário
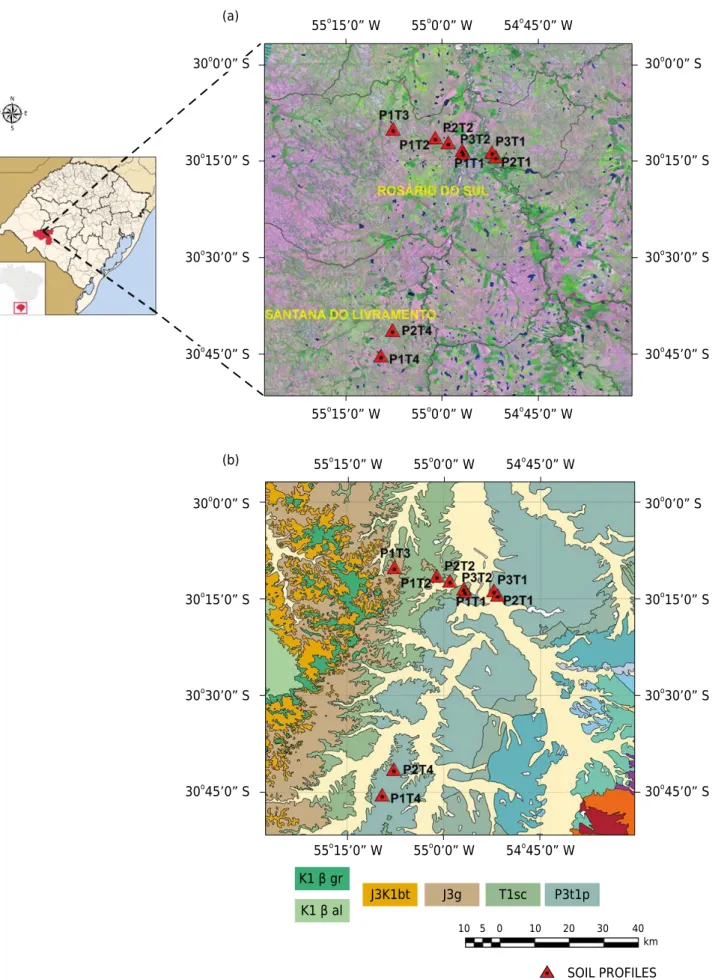
do Sul to Santana do Livramento, RS, Brazil (Figure 1a). The municipality of Rosário do Sul is at 30° 15’ 28” S and 54° 54’ 50” W, with an average altitude of 132 m. According
to the Köppen classification system (Köppen and Geiger, 1928), the climate is humid
subtropical, with hot summers and cold winters (Cfa) and mean annual rainfall between 1,300 and 1,600 mm (PMRS, 2005).
This study was supported by a cartographic base composed of planialtimetric and hydrographic charts in scales of 1:100,000 and 1:50,000 from IBGE; a geological map of the state of Rio Grande do Sul in the scale 1:750,000 (CPRM, 2006); multispectral optical images of the satellites Landsat 5 - Thematic Mapper (5R4G3B) and Rapideye (3R2G1B); digital elevation model (DEM) derived from SRTM (Shuttle Radar Topographic Mission) data; and the database of geomorphometric variables of the TOPODATA project (slope, vertical and horizontal curvature, and slope orientation); with support from the global satellite positioning system and geographic information systems (SIGs), SPRING 5.1.8 and ARCGIS 9.3.
The choice of representative profiles of the predominant soil classes in the study area took into account the different types of source materials, variations in elevation and altitude, rock
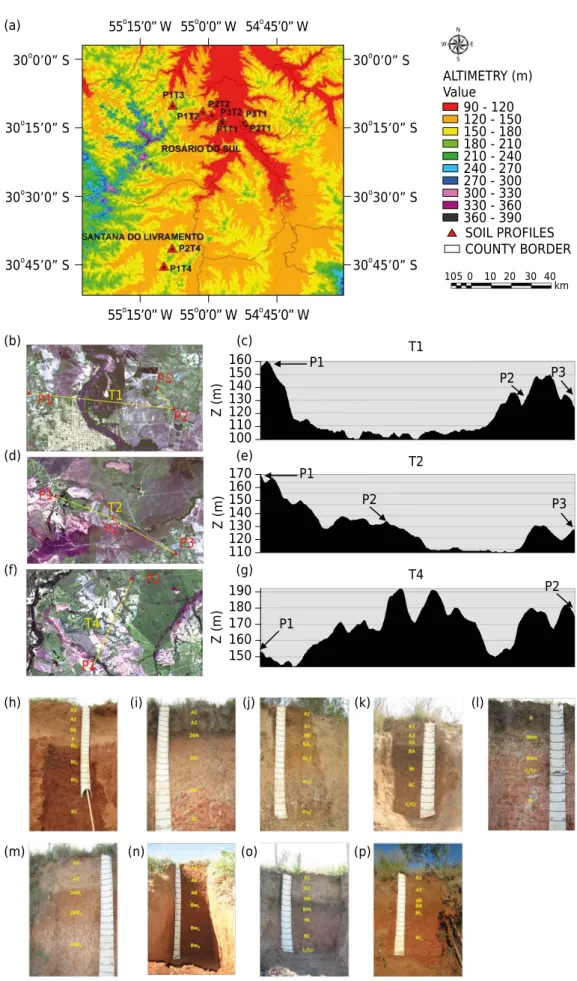
Figure 1. (a) Image chart with the geographical location of the study area and soil profiles - Municipality of Rosário do Sul and Santana do Livramento, RS (Image Landsat 5 Thematic Mapper - Composition 5R4G3B / Datum SAD69 - Scale indicated). (b) Simplified geological map of part of the southwest region of the state of Rio Grande do Sul. Main Formations - P3T1p: Pirambóia Formation; T1sc: Sanga-do-Cabral Formation; J3g: Guará Formation; J3K1bt: Botucatu Formation; K1β: Serra Geral Formation (Scale indicated).
10 5 0 10 20 30 40
km
N
S E W
(a)
55o15’0” W 55o0’0” W 54o45’0” W
55o15’0” W 55o0’0” W 54o45’0” W
30o0’0” S
30o15’0” S
30o30’0” S
30o45’0” S
30o0’0” S
30o15’0” S
30o30’0” S
30o45’0” S
(b) 55o
15’0” W 55o0’0” W 54o45’0” W
55o15’0” W 55o0’0” W 54o45’0” W
30o0’0” S
30o15’0” S
30o30’0” S
30o45’0” S 30o0’0” S
30o15’0” S
30o30’0” S
30o45’0” S
SOIL PROFILES COUNTY BORDER K1 β gr
K1 β al
by real-time spatial positioning in a SIG environment over the cartographic base with a GPS navigation receiver. Therefore, a traditional toposequence was not characterized.
Rather, we examined the different types of soils formed from distinct lithologies in several segments of the landscape (topolithosequence). The profiles P1T1, P2T1, P3T1, P1T4, and P2T4 belong to the Pirambóia Formation; the profiles P1T2, P2T2, and P3T2, to the Sanga-do-Cabral Formation; and profile P1T3, to the Guará Formation (Figure 1b). The Pirambóia Formation consists of medium to fine sandstone with well-developed lenticular
geometry, deposited in an eolic, continental environment with river intercalations. Siltite layers may also occur, interspersed with the sandstones. The Sanga-do-Cabral Formation belongs to the Rosário do Sul Group and is characterized by subarcosic and arcosic sandstones, tabular or elongated lenticular bodies (consisting of breccia and
intraformational conglomerate), siltite, and rare argillite, deposited in continental, fluvial
interlaced environments that contain fragments of fossilized vertebrates. The Guará
Formation is composed of sandstone, fine to conglomeratic, with whitish to reddish
colors, occasionally interspersed with centimetric levels of pellets containing dinosaur
footprints deposited in a continental desert environment with fluvial, Eolic, and lacustrine
deposits (CPRM, 2006).
A general and morphological description of the selected profiles was carried out
according to the method described in Schneider et al. (2007) and Santos et al. (2015b).
In each subhorizon of the profiles, a soil sample was collected for chemical and physical
characterization. The soil samples were air dried, crushed, milled, and sieved in a 2 mm
mesh, separating the coarse fractions and the air-dried fine earth (ADFE). Soil particle
size distribution and basic chemical analyzes were performed on the ADFE according to methods described in Tedesco et al. (1995) and Claessen (1997). Active acidity (pH in H2O at a ratio of 1:1 v/v) was determined by potentiometry using a pH-meter. Organic carbon (OC) was determined by the Walkley-Black method through its oxidation with
the dichromate anion in acid medium and redox titration with ferrous sulfate solution in the presence of ferroin indicator. The exchangeable K and Na contents were determined
using the double-acid extraction method (Mehlich-1) with flame photometer readings.
Exchangeable Ca and Mg were extracted with 1 mol L-1 KCl and determined in an atomic absorption spectrophotometer. Exchangeable Al was obtained by neutralization titration with 0.0125 mol L-1 NaOH after extraction with 1 mol L-1 KCl. Potential acidity (H+Al) was obtained with 0.5 mol L-1 calcium acetate extractor buffered to pH 7 and titrated with 0.02 mol L-1 NaOH. Sum of bases (SB), cation exchange capacity at pH 7 (T), base saturation (V), Al saturation (m), Na saturation (Na%), and activity of the clay fraction (TCLAY) were calculated according to the following expressions: SB = Ca2+ + Mg2+ + K+ + Na+; CEC pH7 (T) = SB + (H+Al); V = (SB/T) × 100; m = [Al/(Al + SB)] × 100; Na% = (Na/T) × 100; and TCLAY = (T soil/% clay in the B subhorizon) × 100, respectively. The Fe2O3 contents were determined according to the method of sulfuric acid attack of fine earth (SAFE) proposed by Embrapa (1979). The clay fraction was determined using the simplified densimeter
method (Bouyoucus, 1962) after dispersion of the soil samples in H2O - water dispersible clay (WDC) - and with 1 mol L-1 NaOH solution or Calgon (sodium hexametaphosphate and anhydrous sodium carbonate) - total clay (CT). The sand fraction was gravimetrically quantified (weighing) after mechanical sieving and oven drying. Silt was determined by the difference between the mass of total sample and the mass of clay + sand fractions.
The silt/clay ratio was calculated by the simple ratio between the values of the two
fractions, and the degree of clay flocculation (DF) was determined by the following
equation: DF = 100 × (CT-WDC)/CT.
The profiles were taxonomically classified up to the 4th categorical level (subgroups) according to the SiBCS (Santos et al., 2013) and the Soil Taxonomy (Soil Survey Staff,
2014) systems.
Using digital mapping tools from the DEM, hypsometric maps of topographic and
relationships. For correlation of the geomorphic surfaces with pedogenesis, the method proposed by Troeh (1965) was applied.
The physical and chemical properties of the soil profiles were determined by multivariate
statistical analysis through use of factor analysis (FA) and cluster analysis (CA) techniques.
The data were standardized (mean zero and unit variance) to avoid influence of the units
of measurement on the analyses. In cluster analysis, Euclidean distance was used to measure similarity, and the agglomerative method of Ward was adopted for formation of groups. The Statistica 8 program (Statsoft, 2007) was used for analyses.
RESULTS AND DISCUSSION
Pedological characterization and taxonomic classification
The morphological data of the profiles and the analytical results for characterization are
shown in tables 1, 2, and 3. A general description of these soils can be found in Santos (2015).
In the P1T1-PVd profile (Argissolo Vermelho Distrófico espessarênico abrúptico/Arenic
Kanhapludults) in the surface horizon, the OC ranged from 4.2 g kg-1
in the A1 to 1.7 g kg-1 in the A2. The depth of the solum was 2.88 m, and the thickness of the A horizon was 0.90/0.95 m. The structure exhibited a massive appearance that broke apart into weakly developed blocks.
It had a sandy texture to a depth of more than 1.00 m, low CF, and V <65 %. The subsurface
horizon was B texture type, presenting soil reaction phase with negative ΔpH. The soil texture
in the Bt1, Bt3, and BC horizons was medium and clayey in Bt2, with high CF (100 %) in the Bt3 and BC horizons, indicating high stability of microaggregates. The texture ratio was quite high (TR = 4.8). In addition, the soil exhibited abrupt textural change (ATC) in the transition between the E and Bt1, with low activity clay (Tl) in the Bt and a silt/clay ratio <0.6. The
structure of the B horizon ranged from medium moderate and small sub-angular blocks to medium strong sub-angular and angular blocks. There was the presence of clay films at a quantity/degree of low/weak expression in the Bt1 and abundant/strong in the Bt2 and Bt3,
represented by depositions similar to argilans + humans or argilans + ferrans. The B horizon exhibited V lower than 50 % and content of Al3+ <4 cmol
c kg
-1. The Fe content of the SAFE was only 38.3 g kg-1 of Fe
2O3 (hypoferric). The dominant color in the B was dark red.
The P2T1-PBACal profile (Argissolo Bruno-Acinzentado Alítico abrúptico endorredóxico/Oxyaquic
Hapludults) had a type A moderate surface horizon, with OC content of approximately 7 g kg-1. The thickness of the A horizon was 0.42 m with solum depth of 1.75 m. The structure was small/weak granular and in simple grains in the A1, with massive appearance that fell apart in weak medium sub-angular and angular blocks in the A2. The average clay content in the A was 140 g kg-1, and V was lower than 65 %. It had colors ranging from very dark grayish brown in the A1 to very dark brown in the A2. Lithological discontinuity was identified based on irregular distribution of the sand fractions between the horizons, difference in the value of uniformity, variation in the Zr/Ti ratio, and mineralogical analysis, as well as field
observation of a gravel line at the top of the 2BA (Santos, 2015). In subsurface horizons, the texture was clayey in 2BA and medium in 2Bt and 2BC, with high activity clay (Th) in all subhorizons, but with low V (dystrophic) in most of the B horizon (2BA + 2Bt) and 2BC.
The TR was 2.1, with an increase in clay for identification of textural B horizon, and the
occurrence of ATC. The silt/clay ratio was very low, 0.38 on average. The structure varied
in type, size, and degree between subhorizons. The predominant color was dark-brown at
the top of the B horizon and brown in 2Bt and 2BC, typical of the suborders of Argissolos Bruno-Acinzentados. An allytic character was identified, with high contents of Mg2+ and medium contents of Ca2+, despite its dystrophic nature. The Fe
2O3 content was 21 g kg -1
(hypoferric) on average.
The profile P3T1-PAal (Argissolo Amarelo Alítico plintossólico/Oxyaquic Hapludults) had an A
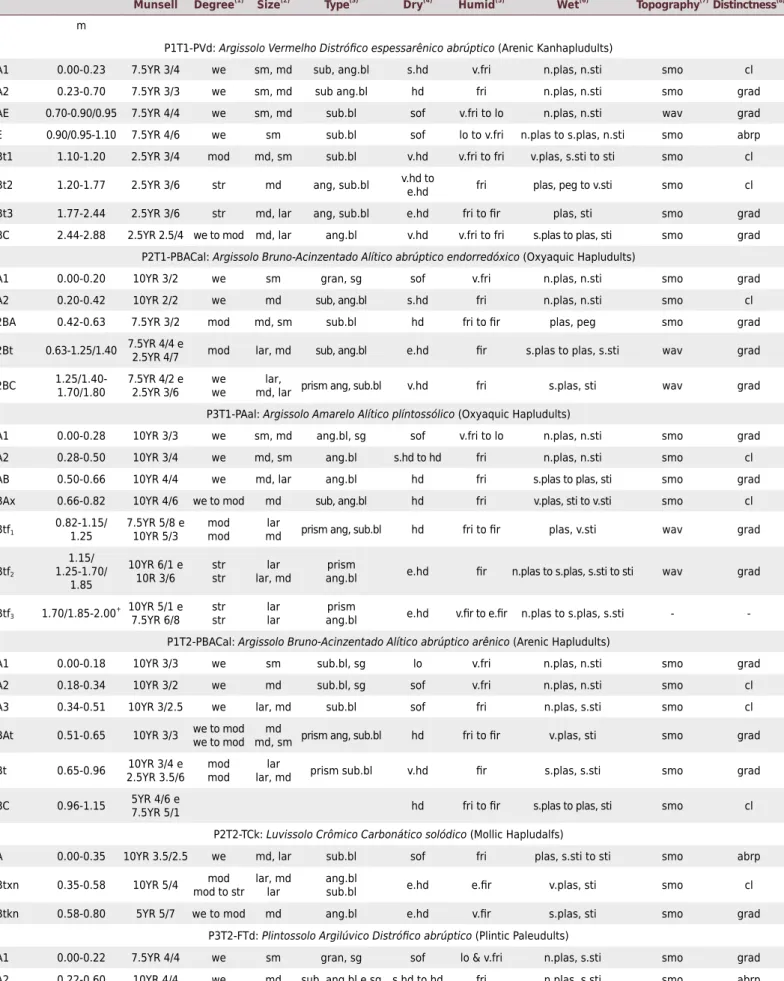
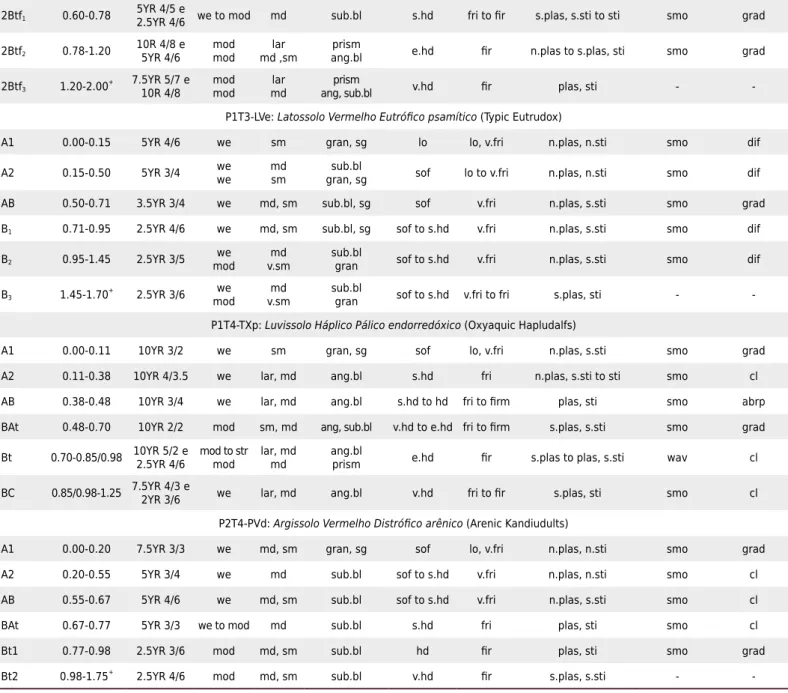
Table 1. Morphological characterization of the soil in horizons A and B of the studied profiles
Horizon Depth Color (wet) Structure Consistency Transition
Munsell Degree(1) Size(2) Type(3) Dry(4) Humid(5) Wet(6) Topography(7) Distinctness(8) m
P1T1-PVd: Argissolo Vermelho Distrófico espessarênico abrúptico (Arenic Kanhapludults)
A1 0.00-0.23 7.5YR 3/4 we sm, md sub, ang.bl s.hd v.fri n.plas, n.sti smo cl
A2 0.23-0.70 7.5YR 3/3 we sm, md sub ang.bl hd fri n.plas, n.sti smo grad
AE 0.70-0.90/0.95 7.5YR 4/4 we sm, md sub.bl sof v.fri to lo n.plas, n.sti wav grad
E 0.90/0.95-1.10 7.5YR 4/6 we sm sub.bl sof lo to v.fri n.plas to s.plas, n.sti smo abrp
Bt1 1.10-1.20 2.5YR 3/4 mod md, sm sub.bl v.hd v.fri to fri v.plas, s.sti to sti smo cl
Bt2 1.20-1.77 2.5YR 3/6 str md ang, sub.bl v.hd to
e.hd fri plas, peg to v.sti smo cl
Bt3 1.77-2.44 2.5YR 3/6 str md, lar ang, sub.bl e.hd fri to fir plas, sti smo grad
BC 2.44-2.88 2.5YR 2.5/4 we to mod md, lar ang.bl v.hd v.fri to fri s.plas to plas, sti smo grad P2T1-PBACal: Argissolo Bruno-Acinzentado Alítico abrúptico endorredóxico (Oxyaquic Hapludults)
A1 0.00-0.20 10YR 3/2 we sm gran, sg sof v.fri n.plas, n.sti smo grad
A2 0.20-0.42 10YR 2/2 we md sub, ang.bl s.hd fri n.plas, n.sti smo cl
2BA 0.42-0.63 7.5YR 3/2 mod md, sm sub.bl hd fri to fir plas, peg smo grad
2Bt 0.63-1.25/1.40 7.5YR 4/4 e 2.5YR 4/7 mod lar, md sub, ang.bl e.hd fir s.plas to plas, s.sti wav grad
2BC 1.25/1.40-1.70/1.80
7.5YR 4/2 e 2.5YR 3/6
we we
lar,
md, lar prism ang, sub.bl v.hd fri s.plas, sti wav grad
P3T1-PAal: Argissolo Amarelo Alítico plíntossólico (Oxyaquic Hapludults)
A1 0.00-0.28 10YR 3/3 we sm, md ang.bl, sg sof v.fri to lo n.plas, n.sti smo grad
A2 0.28-0.50 10YR 3/4 we md, sm ang.bl s.hd to hd fri n.plas, n.sti smo cl
AB 0.50-0.66 10YR 4/4 we md, lar ang.bl hd fri s.plas to plas, sti smo grad
BAx 0.66-0.82 10YR 4/6 we to mod md sub, ang.bl hd fri v.plas, sti to v.sti smo cl
Btf1
0.82-1.15/ 1.25
7.5YR 5/8 e 10YR 5/3
mod mod
lar
md prism ang, sub.bl hd fri to fir plas, v.sti wav grad
Btf2
1.15/ 1.25-1.70/
1.85
10YR 6/1 e 10R 3/6 str str lar lar, md prism
ang.bl e.hd fir n.plas to s.plas, s.sti to sti wav grad
Btf3 1.70/1.85-2.00
+ 10YR 5/1 e 7.5YR 6/8 str str lar lar prism
ang.bl e.hd v.fir to e.fir n.plas to s.plas, s.sti - -P1T2-PBACal: Argissolo Bruno-Acinzentado Alítico abrúptico arênico (Arenic Hapludults)
A1 0.00-0.18 10YR 3/3 we sm sub.bl, sg lo v.fri n.plas, n.sti smo grad
A2 0.18-0.34 10YR 3/2 we md sub.bl, sg sof v.fri n.plas, n.sti smo cl
A3 0.34-0.51 10YR 3/2.5 we lar, md sub.bl sof fri n.plas, s.sti smo cl
BAt 0.51-0.65 10YR 3/3 we to mod we to mod
md
md, sm prism ang, sub.bl hd fri to fir v.plas, sti smo grad
Bt 0.65-0.96 10YR 3/4 e 2.5YR 3.5/6
mod mod
lar
lar, md prism sub.bl v.hd fir s.plas, s.sti smo grad
BC 0.96-1.15 5YR 4/6 e
7.5YR 5/1 hd fri to fir s.plas to plas, sti smo cl
P2T2-TCk: Luvissolo Crômico Carbonático solódico (Mollic Hapludalfs)
A 0.00-0.35 10YR 3.5/2.5 we md, lar sub.bl sof fri plas, s.sti to sti smo abrp
Btxn 0.35-0.58 10YR 5/4 mod to strmod lar, mdlar ang.blsub.bl e.hd e.fir v.plas, sti smo cl
Btkn 0.58-0.80 5YR 5/7 we to mod md ang.bl e.hd v.fir s.plas, sti smo grad
P3T2-FTd: Plintossolo Argilúvico Distrófico abrúptico (Plintic Paleudults)
A1 0.00-0.22 7.5YR 4/4 we sm gran, sg sof lo & v.fri n.plas, s.sti smo grad
A2 0.22-0.60 10YR 4/4 we md sub, ang.bl e sg s.hd to hd fri n.plas, s.sti smo abrp
wet color with value and chroma >3, dry color with value ≤5 (brown in the A1 and yellowish-brown in the A2 and AB), OC content of 6 g kg-1 in the A1 and 4 g kg-1 in the A2 and AB, V <65 %, a structure that appeared to be massive but that broke down into angular blocks and simple grains, and clay contents that increased from 110 g kg-1 in the A1 to 200 g kg-1
in the AB. The subsurface horizon was characterized as textural B, with TR
of 2.2. However, the clay content, in the transition from the AB to BAx was not significant
to the point of characterizing ATC. It had low activity clay (Tl), but >20 cmolc kg
-1, and a
silt/clay ratio <0.6. The BAx and Btf2 horizons were of medium texture, while the Btf1 was clayey and the Btf3 was medium to clayey, with CF >50 % throughout the B. It had an acid reaction phase and a dystrophic character in most of the B, except in the Btf3. Because the Al3+ was higher than 4 cmol
c kg
-1, together with clay activity higher than 20 cmol c kg
-1 and the high m, an allytic character was identified in most of the B horizon. The dominant Table 1. Morphological characterization of the soil in horizons A and B of the studied profiles
2Btf1 0.60-0.78
5YR 4/5 e
2.5YR 4/6 we to mod md sub.bl s.hd fri to fir s.plas, s.sti to sti smo grad
2Btf2 0.78-1.20
10R 4/8 e 5YR 4/6
mod mod
lar md ,sm
prism
ang.bl e.hd fir n.plas to s.plas, sti smo grad
2Btf3 1.20-2.00+
7.5YR 5/7 e 10R 4/8
mod mod
lar md
prism
ang, sub.bl v.hd fir plas, sti -
-P1T3-LVe: Latossolo Vermelho Eutrófico psamítico (Typic Eutrudox)
A1 0.00-0.15 5YR 4/6 we sm gran, sg lo lo, v.fri n.plas, n.sti smo dif
A2 0.15-0.50 5YR 3/4 wewe mdsm gran, sgsub.bl sof lo to v.fri n.plas, n.sti smo dif
AB 0.50-0.71 3.5YR 3/4 we md, sm sub.bl, sg sof v.fri n.plas, s.sti smo grad
B1 0.71-0.95 2.5YR 4/6 we md, sm sub.bl, sg sof to s.hd v.fri n.plas, s.sti smo dif
B2 0.95-1.45 2.5YR 3/5 we mod
md v.sm
sub.bl
gran sof to s.hd v.fri n.plas, s.sti smo dif
B3 1.45-1.70 +
2.5YR 3/6 modwe v.smmd sub.blgran sof to s.hd v.fri to fri s.plas, sti -
-P1T4-TXp: Luvissolo Háplico Pálico endorredóxico (Oxyaquic Hapludalfs)
A1 0.00-0.11 10YR 3/2 we sm gran, sg sof lo, v.fri n.plas, s.sti smo grad
A2 0.11-0.38 10YR 4/3.5 we lar, md ang.bl s.hd fri n.plas, s.sti to sti smo cl
AB 0.38-0.48 10YR 3/4 we lar, md ang.bl s.hd to hd fri to firm plas, sti smo abrp
BAt 0.48-0.70 10YR 2/2 mod sm, md ang, sub.bl v.hd to e.hd fri to firm s.plas, s.sti smo grad
Bt 0.70-0.85/0.98 10YR 5/2 e 2.5YR 4/6 mod to strmod lar, mdmd ang.blprism e.hd fir s.plas to plas, s.sti wav cl
BC 0.85/0.98-1.25 7.5YR 4/3 e
2YR 3/6 we lar, md ang.bl v.hd fri to fir s.plas, sti smo cl
P2T4-PVd: Argissolo Vermelho Distrófico arênico (Arenic Kandiudults)
A1 0.00-0.20 7.5YR 3/3 we md, sm gran, sg sof lo, v.fri n.plas, n.sti smo grad
A2 0.20-0.55 5YR 3/4 we md sub.bl sof to s.hd v.fri n.plas, n.sti smo cl
AB 0.55-0.67 5YR 4/6 we md, sm sub.bl sof to s.hd v.fri n.plas, s.sti smo cl
BAt 0.67-0.77 5YR 3/3 we to mod md sub.bl s.hd fri plas, sti smo cl
Bt1 0.77-0.98 2.5YR 3/6 mod md, sm sub.bl hd fir plas, sti smo grad
Bt2 0.98-1.75+ 2.5YR 4/6 mod md, sm sub.bl v.hd fir s.plas, s.sti -
-(1) we = weak; mod = moderate; str = strong. (2)
v. sm = very small; sm = small; md = medium; lar = large. (3) gran = granular; sub.bl = subangular blocks;
ang.bl = angular blocks; prism = prismatic; m = massive; sg = simple grain. (4)
lo = loose; sof = soft; s. hd = slightly hard; hd = hard; v. hd = very hard; e. hd = extremely hard. (5) lo = loose; v. fri = very friable; fri = friable; fir = firm; v. fir = very firm; e. fir = extremely firm. (6)
n. plas = non-plastic;
s. plas = slightly plastic; plas = plastic; v. plas = very plastic; n. sti = non-sticky; s. sti = slightly sticky; sti = sticky; v. sti = very sticky. (7)
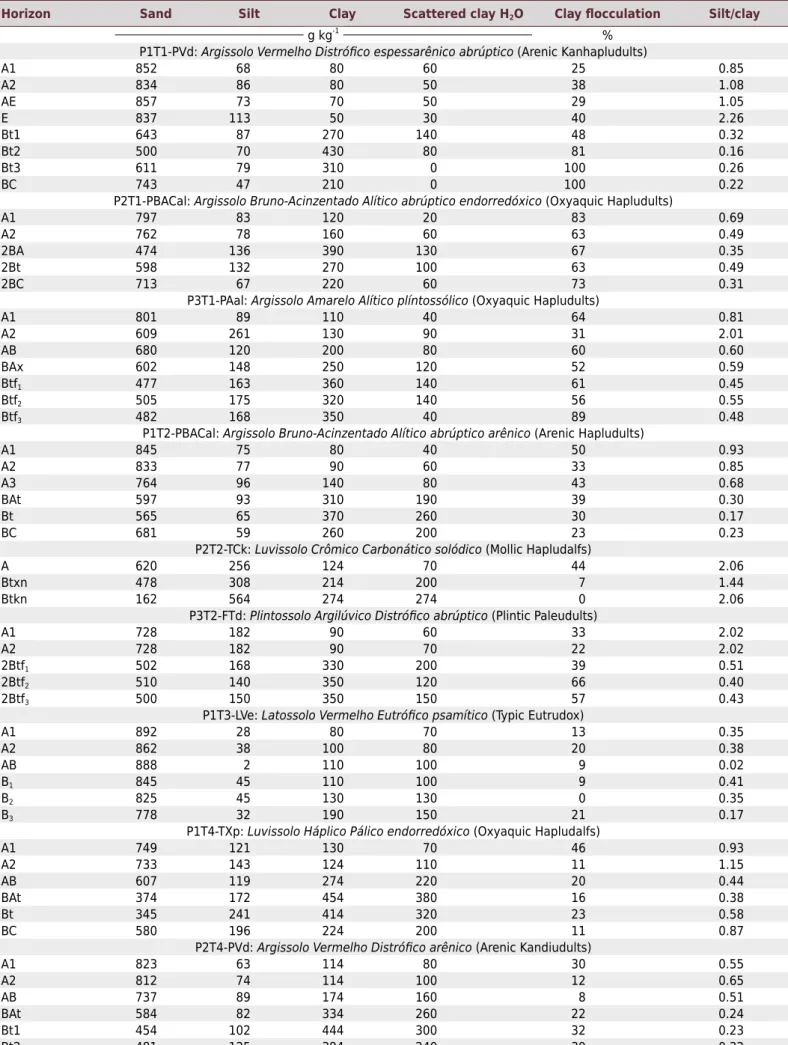
Table 2. Physical properties of the soil in the A and B horizons of the studied profiles
Horizon Sand Silt Clay Scattered clay H2O Clay flocculation Silt/clay
g kg-1
% P1T1-PVd: Argissolo Vermelho Distrófico espessarênico abrúptico (Arenic Kanhapludults)
A1 852 68 80 60 25 0.85
A2 834 86 80 50 38 1.08
AE 857 73 70 50 29 1.05
E 837 113 50 30 40 2.26
Bt1 643 87 270 140 48 0.32
Bt2 500 70 430 80 81 0.16
Bt3 611 79 310 0 100 0.26
BC 743 47 210 0 100 0.22
P2T1-PBACal: Argissolo Bruno-Acinzentado Alítico abrúptico endorredóxico (Oxyaquic Hapludults)
A1 797 83 120 20 83 0.69
A2 762 78 160 60 63 0.49
2BA 474 136 390 130 67 0.35
2Bt 598 132 270 100 63 0.49
2BC 713 67 220 60 73 0.31
P3T1-PAal: Argissolo Amarelo Alítico plíntossólico (Oxyaquic Hapludults)
A1 801 89 110 40 64 0.81
A2 609 261 130 90 31 2.01
AB 680 120 200 80 60 0.60
BAx 602 148 250 120 52 0.59
Btf1 477 163 360 140 61 0.45
Btf2 505 175 320 140 56 0.55
Btf3 482 168 350 40 89 0.48
P1T2-PBACal: Argissolo Bruno-Acinzentado Alítico abrúptico arênico (Arenic Hapludults)
A1 845 75 80 40 50 0.93
A2 833 77 90 60 33 0.85
A3 764 96 140 80 43 0.68
BAt 597 93 310 190 39 0.30
Bt 565 65 370 260 30 0.17
BC 681 59 260 200 23 0.23
P2T2-TCk: Luvissolo Crômico Carbonático solódico (Mollic Hapludalfs)
A 620 256 124 70 44 2.06
Btxn 478 308 214 200 7 1.44
Btkn 162 564 274 274 0 2.06
P3T2-FTd: Plintossolo Argilúvico Distrófico abrúptico (Plintic Paleudults)
A1 728 182 90 60 33 2.02
A2 728 182 90 70 22 2.02
2Btf1 502 168 330 200 39 0.51
2Btf2 510 140 350 120 66 0.40
2Btf3 500 150 350 150 57 0.43
P1T3-LVe: Latossolo Vermelho Eutrófico psamítico (Typic Eutrudox)
A1 892 28 80 70 13 0.35
A2 862 38 100 80 20 0.38
AB 888 2 110 100 9 0.02
B1 845 45 110 100 9 0.41
B2 825 45 130 130 0 0.35
B3 778 32 190 150 21 0.17
P1T4-TXp: Luvissolo Háplico Pálico endorredóxico (Oxyaquic Hapludalfs)
A1 749 121 130 70 46 0.93
A2 733 143 124 110 11 1.15
AB 607 119 274 220 20 0.44
BAt 374 172 454 380 16 0.38
Bt 345 241 414 320 23 0.58
BC 580 196 224 200 11 0.87
P2T4-PVd: Argissolo Vermelho Distrófico arênico (Arenic Kandiudults)
A1 823 63 114 80 30 0.55
A2 812 74 114 100 12 0.65
AB 737 89 174 160 8 0.51
BAt 584 82 334 260 22 0.24
Bt1 454 102 444 300 32 0.23
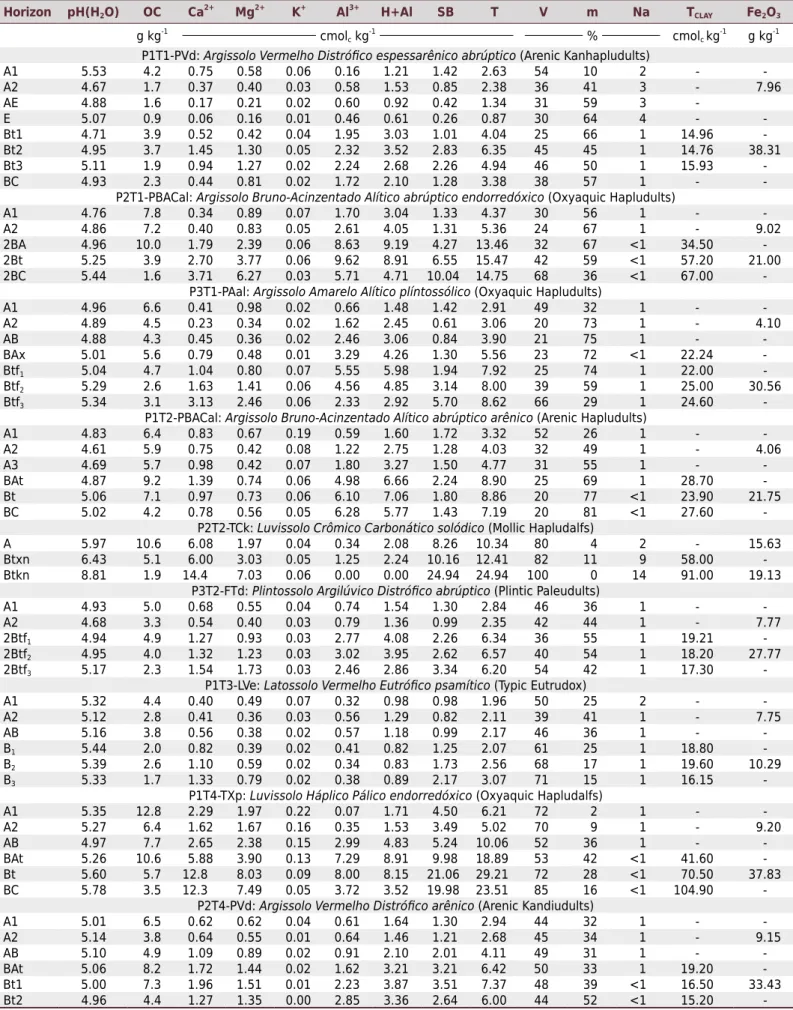
Table 3. Soil chemical properties in the A and B horizons of the studied profiles
Horizon pH(H2O) OC Ca2+ Mg2+ K+ Al3+ H+Al SB T V m Na TCLAY Fe2O3
g kg-1
cmolc kg -1
% cmolc kg
-1
g kg-1
P1T1-PVd: Argissolo Vermelho Distrófico espessarênico abrúptico (Arenic Kanhapludults)
A1 5.53 4.2 0.75 0.58 0.06 0.16 1.21 1.42 2.63 54 10 2 -
-A2 4.67 1.7 0.37 0.40 0.03 0.58 1.53 0.85 2.38 36 41 3 - 7.96
AE 4.88 1.6 0.17 0.21 0.02 0.60 0.92 0.42 1.34 31 59 3
-E 5.07 0.9 0.06 0.16 0.01 0.46 0.61 0.26 0.87 30 64 4 -
-Bt1 4.71 3.9 0.52 0.42 0.04 1.95 3.03 1.01 4.04 25 66 1 14.96
-Bt2 4.95 3.7 1.45 1.30 0.05 2.32 3.52 2.83 6.35 45 45 1 14.76 38.31
Bt3 5.11 1.9 0.94 1.27 0.02 2.24 2.68 2.26 4.94 46 50 1 15.93
-BC 4.93 2.3 0.44 0.81 0.02 1.72 2.10 1.28 3.38 38 57 1 -
-P2T1-PBACal: Argissolo Bruno-Acinzentado Alítico abrúptico endorredóxico (Oxyaquic Hapludults)
A1 4.76 7.8 0.34 0.89 0.07 1.70 3.04 1.33 4.37 30 56 1 -
-A2 4.86 7.2 0.40 0.83 0.05 2.61 4.05 1.31 5.36 24 67 1 - 9.02
2BA 4.96 10.0 1.79 2.39 0.06 8.63 9.19 4.27 13.46 32 67 <1 34.50
-2Bt 5.25 3.9 2.70 3.77 0.06 9.62 8.91 6.55 15.47 42 59 <1 57.20 21.00
2BC 5.44 1.6 3.71 6.27 0.03 5.71 4.71 10.04 14.75 68 36 <1 67.00
-P3T1-PAal: Argissolo Amarelo Alítico plíntossólico (Oxyaquic Hapludults)
A1 4.96 6.6 0.41 0.98 0.02 0.66 1.48 1.42 2.91 49 32 1 -
-A2 4.89 4.5 0.23 0.34 0.02 1.62 2.45 0.61 3.06 20 73 1 - 4.10
AB 4.88 4.3 0.45 0.36 0.02 2.46 3.06 0.84 3.90 21 75 1 -
-BAx 5.01 5.6 0.79 0.48 0.01 3.29 4.26 1.30 5.56 23 72 <1 22.24
-Btf1 5.04 4.7 1.04 0.80 0.07 5.55 5.98 1.94 7.92 25 74 1 22.00
-Btf2 5.29 2.6 1.63 1.41 0.06 4.56 4.85 3.14 8.00 39 59 1 25.00 30.56
Btf3 5.34 3.1 3.13 2.46 0.06 2.33 2.92 5.70 8.62 66 29 1 24.60
-P1T2-PBACal: Argissolo Bruno-Acinzentado Alítico abrúptico arênico (Arenic Hapludults)
A1 4.83 6.4 0.83 0.67 0.19 0.59 1.60 1.72 3.32 52 26 1 -
-A2 4.61 5.9 0.75 0.42 0.08 1.22 2.75 1.28 4.03 32 49 1 - 4.06
A3 4.69 5.7 0.98 0.42 0.07 1.80 3.27 1.50 4.77 31 55 1 -
-BAt 4.87 9.2 1.39 0.74 0.06 4.98 6.66 2.24 8.90 25 69 1 28.70
-Bt 5.06 7.1 0.97 0.73 0.06 6.10 7.06 1.80 8.86 20 77 <1 23.90 21.75
BC 5.02 4.2 0.78 0.56 0.05 6.28 5.77 1.43 7.19 20 81 <1 27.60
-P2T2-TCk: Luvissolo Crômico Carbonático solódico (Mollic Hapludalfs)
A 5.97 10.6 6.08 1.97 0.04 0.34 2.08 8.26 10.34 80 4 2 - 15.63
Btxn 6.43 5.1 6.00 3.03 0.05 1.25 2.24 10.16 12.41 82 11 9 58.00
-Btkn 8.81 1.9 14.4 7.03 0.06 0.00 0.00 24.94 24.94 100 0 14 91.00 19.13
P3T2-FTd: Plintossolo Argilúvico Distrófico abrúptico (Plintic Paleudults)
A1 4.93 5.0 0.68 0.55 0.04 0.74 1.54 1.30 2.84 46 36 1 -
-A2 4.68 3.3 0.54 0.40 0.03 0.79 1.36 0.99 2.35 42 44 1 - 7.77
2Btf1 4.94 4.9 1.27 0.93 0.03 2.77 4.08 2.26 6.34 36 55 1 19.21
-2Btf2 4.95 4.0 1.32 1.23 0.03 3.02 3.95 2.62 6.57 40 54 1 18.20 27.77
2Btf3 5.17 2.3 1.54 1.73 0.03 2.46 2.86 3.34 6.20 54 42 1 17.30
-P1T3-LVe: Latossolo Vermelho Eutrófico psamítico (Typic Eutrudox)
A1 5.32 4.4 0.40 0.49 0.07 0.32 0.98 0.98 1.96 50 25 2 -
-A2 5.12 2.8 0.41 0.36 0.03 0.56 1.29 0.82 2.11 39 41 1 - 7.75
AB 5.16 3.8 0.56 0.38 0.02 0.57 1.18 0.99 2.17 46 36 1 -
-B1 5.44 2.0 0.82 0.39 0.02 0.41 0.82 1.25 2.07 61 25 1 18.80
-B2 5.39 2.6 1.10 0.59 0.02 0.34 0.83 1.73 2.56 68 17 1 19.60 10.29
B3 5.33 1.7 1.33 0.79 0.02 0.38 0.89 2.17 3.07 71 15 1 16.15
-P1T4-TXp: Luvissolo Háplico Pálico endorredóxico (Oxyaquic Hapludalfs)
A1 5.35 12.8 2.29 1.97 0.22 0.07 1.71 4.50 6.21 72 2 1 -
-A2 5.27 6.4 1.62 1.67 0.16 0.35 1.53 3.49 5.02 70 9 1 - 9.20
AB 4.97 7.7 2.65 2.38 0.15 2.99 4.83 5.24 10.06 52 36 1 -
-BAt 5.26 10.6 5.88 3.90 0.13 7.29 8.91 9.98 18.89 53 42 <1 41.60
-Bt 5.60 5.7 12.8 8.03 0.09 8.00 8.15 21.06 29.21 72 28 <1 70.50 37.83
BC 5.78 3.5 12.3 7.49 0.05 3.72 3.52 19.98 23.51 85 16 <1 104.90
-P2T4-PVd: Argissolo Vermelho Distrófico arênico (Arenic Kandiudults)
A1 5.01 6.5 0.62 0.62 0.04 0.61 1.64 1.30 2.94 44 32 1 -
-A2 5.14 3.8 0.64 0.55 0.01 0.64 1.46 1.21 2.68 45 34 1 - 9.15
AB 5.10 4.9 1.09 0.89 0.02 0.91 2.10 2.01 4.11 49 31 1 -
-BAt 5.06 8.2 1.72 1.44 0.02 1.62 3.21 3.21 6.42 50 33 1 19.20
-Bt1 5.00 7.3 1.96 1.51 0.01 2.23 3.87 3.51 7.37 48 39 <1 16.50 33.43
Bt2 4.96 4.4 1.27 1.35 0.00 2.85 3.36 2.64 6.00 44 52 <1 15.20
-pH in water at a ratio of 1:1 v/v; OC: organic carbon (Walkley-Black method); K+
and Na+
(Mehlich-1 solution); Ca2+ , Mg2+
and Al3+
(1 mol L-1
color/hue was 7.5YR or yellower in most of the first 1.00 m of the B horizon, with Fe2O3 content around 30 g kg-1
(hypoferric). The structure in the upper portion was weak to moderate and of medium size, with sub-angular and angular blocks and fragipan type
apparent cementation (BAx). In the underlying horizons (Btf), there was a predominance of large size and a strong degree of prismatic structure. There was an intense amount of prominent and distinct mottles and/or plinthite in the Btf2 and Btf3 horizons, and reddish color interspersed by glazed gray spots, characterizing the plinthic character in this soil.
In the profile P1T2-PBACal (Argissolo Bruno -Acinzentado Alítico abrúptico arênico/Arenic
Hapludults), the solum depth was 1.15 m, with a total thickness of 0.51 m in the A horizon. The average OC content in the surface horizon was 6 g kg-1 and the V was lower than 65 %. The soil had a dry color with value ≤5, and a wet color with value/chroma ≤3 in
all subhorizons of the A horizon. Due to the average sand and clay content, this soil had a sandy texture from the surface to at least 0.50 m deep (arenic). The structure
had a weak degree of development, with sub-angular blocks and simple grain type. The
dry consistency ranged from loose to soft, and the wet consistency from very friable to friable. The subsurface horizon had high activity clay (Th) in the BAt and BC, and low activity clay (Tl) in the Bt, but had low V in all subhorizons. The TR was 3.2, depicting a high textural gradient, meeting the criterion for textural B. In addition, there was a considerable increase in clay content from the A3 to BAt, indicating ATC. The textural class was medium in the BAt and BC, and clayey in the Bt. All of them had low CF and
a silt/clay ratio ≤0.3. It had an acidic reaction phase with high amounts of Al3+ and high m, with low Ca2+ and Mg2+ contents that expressed an allytic character.
In the profile P2T2-TCk (Luvissolo Crômico Carbonático solódico/Mollic Hapludalfs) the
solum depth was greater than 0.75 m, with the A horizon >0.25 m thick. The OC content
was >0.6 %, and the V >65 %. However, the wet color had a value >3; therefore, it was
insufficient to characterize the A horizon as chernozemic. The A horizon also had a subangular block type structure of weak degree and medium and large size, soft and friable consistency, and sandy texture, with 124 g kg-1 of clay. The Btxn subhorizon had a slightly acidic reaction phase, whereas, in the underlying horizon (Btkn), the pH value was very high (alkaline), but with negative ΔpH. The average clay content in the B was 244 g kg-1, with very low CF, possibly influenced by the high pH and Na content/saturation in the CEC, causing dispersion of the clays. The TR was 1.9, with an increase for textural B;
however, in this profile there was no ATC. The B horizon showed high activity clay (Th),
and V was higher than 50 % (eutrophic), which is characteristic of soils of this order.
The silt/clay ratio in the profile, as a whole, was high, which indicated a low degree of
weathering. This can be seen by very high values for Ca2+ and Mg2+, due to low base leaching. Although no analysis of the carbonate content was carried out, the soil had a
significant presence of calcium carbonate concretions disseminated in the Btkn and Cr horizons, which showed strong effervescence in field tests with 20 % HCl, indicating a
probable carbonate character. It showed a solodic character in the B horizon. The wet
color of the Btxn horizon was yellowish brown, and in the Btkn it was yellowish red and
had a chromic character.
The profile P3T2-FTd (Plintossolo Argilúvico Distrófico abrúptico/Plintic Paleudults) had a solum depth>2.00 m and a moderately drained profile. Properties and morphological features indicated lithological discontinuity (Santos, 2015). In the upper horizon, this soil
had an average of only 4 g kg-1 of OC. The thickness of the A horizon was 0.60 m, with a clay content of 90 g kg-1 and a low CF. The structure ranged from simple grains and granular in the A1 to subangular and angular blocks in the A2, but both were of weak
degree. The wet soil color in the A horizon had a chrome/value of 4/4 and dry color of 5/4 in the A1 and 6/4 in the A2. The TR was 3.8, indicating an expressive depth gradient, characterized by an ATC in which the clay content at the transition between the diagnostic
silt/clay ratio ≤0.5, indicating a material with an advanced degree of weathering. The B
horizon showed low activity clay, with V lower than 50 % (dystrophic), except for 2Btf3 and Cr. Despite the low pH, the Al3+ content was relatively low in this soil and did not have an aluminic or allytic character. Plinthite was disseminated throughout the 2Btf2 and 2Btf3 in the form of red aggregates, interspersed with gray and whitish spots.
The profile P1T3-LVe (Latossolo Vermelho Eutrófico psamítico/Typic Eutrudox) was a
very deep profile (solum thickness>2.00 m). The surface horizon was moderate type A,
not classified as weak A only because of its color. It had an average OC content of only 3.6 g kg-1
, was relatively thick, and had a sandy texture with low V. The structure had a massive appearance, crumbling into single grains and sub-angular blocks with a weak degree of development and loose, very friable, non-plastic, and non-sticky consistency. The silt/clay ratio was very low, throughout the profile, showing a high degree of evolution
of this material, compatible with soils of this order. The TR was 1.48, with a gradual clay
increase at depth and an absence of clay films on ped surfaces. The transition between the horizons was diffuse in most of the profile. Regarding color, the dominant hue in the
B was 2.5YR, and the Fe2O3 content was low (hypoferric). The textural subcluster was of medium sandy texture with very low silt values and, in this case, with low CF. Although the clay activity was slightly greater than 18 cmolc kg
-1 in the first two subhorizons of B,
it was less than 17 in the underlying ones. The exchangeable base contents, mainly of Ca2+ and Mg2+, were low, possibly due to the chemical poverty of the source material and the intense leaching. Despite that, the soil had a eutrophic character in the subsurface horizons. The amount of OC and Al3+ was perceived to be low.
The profile P1T4-TXp (Luvissolo Háplico Pálico endorredóxico/Oxyaquic Hapludalfs) had a solum depth of 1.25 m and was from moderately to imperfectly drained. The A horizon
had an average OC content of only 9 g kg-1. The thickness of the A horizon was 0.48 m. The V was very high, around 70 % in the A1 and A2, and 52 % in the AB. The clay content
in the A1 and A2 was close to 130 g kg-1
, increasing to 274 g kg-1 in the AB. It had colors ranging from very dark grayish brown in the A1 to brown to dark yellowish brown in the
A2 and AB, where, despite the high V in the A, the wet and dry color value and chrome characterized a diagnostic A moderate horizon. The subsurface horizon showed clayey texture in the BAt and Bt and medium in the BC, with high activity clay in all subhorizons.
The TR was 2.4, with a significant increase in clay for characterization of the textural B horizon, but there was no occurrence of ATC in the profile. The silt/clay ratio was 0.87
in the BC, and 0.38 and 0.58 in the BAt and Bt respectively, with a very high content of clay dispersed in H2O. However, in spite of a low CF, it generally had a structure with good development. The predominant color at the top of the B (BAt) was very dark brown,
and brown-gray in the Bt, with intense presence of mottles and iron depletion spots in the Bt and BC horizons. This feature was, therefore, very similar to the suborder of the
Argissolo Bruno-Acinzentado. However, the profile had a eutrophic characteristic, which
excluded it from that suborder. It had high contents of Ca2+ and Mg2+, but simultaneously high contents of Al3+ (7.29 and 8 cmolc kg
-1
in the BAt and Bt, respectively), but without showing an aluminum or allytic character. The total Fe2O3 content of SAFE was 37.8 g kg
-1 (hypoferric). The presence of plinthite was registered but was not sufficient for diagnosis
of the plinthic B horizon, but rather of a plinthic character. In addition, it showed properties indicative of a planic or redoximorphic character.
The profile P2T4-PVd (Argissolo Vermelho Distrófico arênico/Arenic Kandiudults) had an
average of only 5 g kg-1 of OC in the A horizon and thickness of 0.67 m, with dark-brown (wet) colors in the A1, dark reddish-brown in the A2, and yellowish red in the AB. It had low V, and CF between 8-30 %, which reflects a structure with a weak degree of development. It had sandy texture in the first 0.50 m, and medium texture in the AB. The TR was high (2.9), occurring a significant clay increment; in spite of that, the soil did not exhibit
ATC at the transition between the AB and the BAt, where the clay contents were 174
and medium in the BAt, all with low CF. Presented CEC of clay lower than 20 cmolc kg-1 and an extremely low silt/clay ratio. Clay films were present in quantity and degree of
expression abundant and moderate in the Bt1, and common and moderate in the Bt2. The B horizon had pH in H2O close to 5 and V slightly lower than 50 %. Despite that, there was little increase in S at depth. It did not have an Al character, because the Al3+ content was inferior to 4 cmolc kg
-1 in all the subhorizons. It was a hypoferric soil, having a dominant hue in the B of 2.5YR, with dark-red and red colors.
Pedogeomorphic relationships
The elevation map with the distribution of the altitude classes (hypsometric levels)
in equidistant vertical intervals, the tracing, and the topographic profile maps of the topolithosequences are shown in figure 2. The data of the geomorphometric variables
divided into classes are shown in table 4.
The slope is defined as the angle of inclination (zenithal) of the terrain surface relative to the horizontal, i.e., it is the ratio of the difference in elevation or elevation change
(vertical distance) to the horizontal distance between two points of an alignment in the same orientation of the local slope. The plane of curvature (horizontal curvature) and
the profile of curvature (vertical curvature) represent the shapes of the relief and are
important properties in distinguishing geomorphological units. The horizontal curvature refers to the shape of the slope, in a plane, which can be convergent, divergent, or planar,
and the vertical curvature refers to the shape of the slope, analyzed in profile, which can be convex, concave, or rectilinear. The slope orientation is defined as the azimuth angle
corresponding to the highest slope of the terrain in the downward direction, characterizing the direction of terrain exposure.
According to the altimetric map (Figure 2a) generated from the DEM, the elevation of the region in this segment ranges from approximately 90 to 390 m. The Campanha Gaúcha region has an average altitude of around 100 m. In this region where basalt
predominates (western portion), the relief is flat to gently rolling. In the areas of sandstone
of the Botucatu Formation, the relief reaches altitudes of 200 to 300 m (Santana do Livramento and near Rosario do Sul) and is rolling. In the southwestern part, in the areas of Gondwanian sediments, the relief is gently rolling (Brasil, 1973).
As for slope (Table 4), in general, the predominant relief in the soil profiles was gently rolling, and was rolling only in the area of profiles P2T1-PBACal and P2T4-PVd, with slopes
ranging from 8 to 20 % in much of the territorial extension of the study region. Slope is one of the most important topographic properties that control pedogenetic processes,
directly affecting the speed of the surface and subsurface water flow and, consequently,
water content in the soil and the erosion/deposition potential, among other important processes in soil formation (Gallant and Wilson, 2000).
The horizontal curvature (Table 4) expresses the shape of the slope when observed in horizontal projection, and it can be described as the variation of slope orientation
over a given distance, which is reflected in the divergence or convergence character of the flow lines. The horizontal curvature is related to the intensity of the processes of
migration and accumulation of water, minerals and organic matter accumulation in the
soil, through the concentration of surface runoff. The profiles P1T2-PBACal, P2T2-TCk,
P3T2-FTd, and P1T3-LVe exhibited very divergent and divergent horizontal curvature
in the profiles P1T1-PVd and P3T1-PAal. The profiles P2T1-PBACal and P2T4-PVd had convergent curvature, and the profile P1T4-TXp had planar. The convergent areas represent the valleys and the divergent areas the interflows, where, according to Sirtoli (2008)
Figure 2. (a) Altimetric map of the region (Datum SAD69 - Scale indicated); T1 (Profiles P1-PVd, P2-PBACal, and P3-PAal), T2 (profiles P1-PBACal, P2-TCk, and P3-FTd), and T4 (profiles P1-TXp and P2-PVd) (RapidEye Image Composition 3R2G1B - without scale); (c), (e), and (g): Topographic profile map of T1, T2, and T4 topolith sequences, constructed from the DEM (without scale); Photographs of soil profiles: (h) P1T1-PVd, (i) P2T1-PBACal, (j) P3T1-PAal, (k) P1T2-PBACal, (l) P2T2-TCk, (m) P3T2-FTd, (n) P1T3-LVe, (o) P1T4-TXp, and (p) P2T4-PVd.
(a)
(b)
(d)
(f)
(h) (i) (j) (k) (l)
(m) (n) (o) (p)
(c) (e) (g) P1 T1 160 150 140 130 120 110 100 170 Z (m) Z (m) Z (m) 190 180 170 160 150 160 150 140 130 120 110 T2 T4 P2 P3 T1 P1 P2 P3 T2 P1 P2 P3 T4 P1 P2
30o0’0” S
55o15’0” W 55o0’0” W 54o45’0” W
55o15’0” W 55o0’0” W 54o45’0” W 30o15’0” S
30o30’0” S
30o45’0” S
30o0’0” S
30o15’0” S
30o30’0” S
30o45’0” S
105 0 10 20 30 40
km
N
S E W
90 - 120 ALTIMETRY (m) Value
120 - 150
SOIL PROFILES COUNTY BORDER 150 - 180 180 - 210 210 - 240 240 - 270 270 - 300 300 - 330 330 - 360 360 - 390
P1
P2 P3
P1
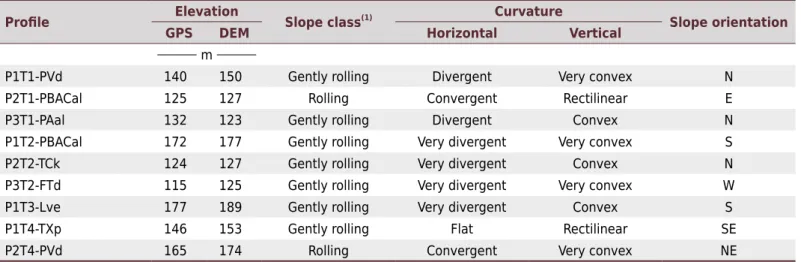
Table 4. Altimetric variables and geomorphometric derivations
Profile Elevation Slope class(1) Curvature Slope orientation
GPS DEM Horizontal Vertical
m
P1T1-PVd 140 150 Gently rolling Divergent Very convex N
P2T1-PBACal 125 127 Rolling Convergent Rectilinear E
P3T1-PAal 132 123 Gently rolling Divergent Convex N
P1T2-PBACal 172 177 Gently rolling Very divergent Very convex S
P2T2-TCk 124 127 Gently rolling Very divergent Convex N
P3T2-FTd 115 125 Gently rolling Very divergent Very convex W
P1T3-Lve 177 189 Gently rolling Very divergent Convex S
P1T4-TXp 146 153 Gently rolling Flat Rectilinear SE
P2T4-PVd 165 174 Rolling Convergent Very convex NE
(1) According to relief defined in Embrapa (1999).
the greater convergent flow of water in these areas, a reason that favors morphogenesis,
causing these soils to be constantly rejuvenated by erosion.
The vertical curvature (Table 4) expresses the shape of the slope when observed in
profile, referring to the convex/concave character, and is expressed in angle difference
divided by horizontal distance. Due to its strong relationship with substrate type and relief formation processes, topography compartmentalization studies point to vertical curvature as a variable of high power for identifying homogeneous units, mainly for pedological and geological mapping. This variable is related to the processes of migration and accumulation of matter across the surface, acting indirectly in equilibrium between
the processes of pedogenesis/morphogenesis, and it influences local distribution of the
water regime and, consequently, the thermal regime (Valeriano, 2008).
The profiles P1T1-PVd, P1T2-PBACal, P3T2-FTd, P1T3-LVe, and P2T4-PVd showed very convex vertical curvature, whereas the profiles P3T1-PAal and P2T2-TCk had convex curvature. The profiles P2T1-PBACal and P1T4-TXp, in contrast, had a rectilinear curvature, not being observed in the slope of the soil profiles sampled, the concave and very concave
shape, but only in the adjacent areas.
Convergent water flow is conditioned by the concave pedoform, whereas the linear pedoform is characterized by surface runoff processes (Troeh, 1965). According to
Resende et al. (1997), the concave pedoform has greater instability in the higher parts (of removal) and greater stability in the lower areas (of accumulation); that is, soil erosion increases from concave to convex pedoforms, passing through the linear pedoform, which has greater stability. Thus, the concave shape favors concentration of water in the system, while the convex shape favors dispersion and loss of water from the system (Resende et al., 2007). Greater spatial variability of the chemical properties is favored due to the pedogeomorphic conditions in the concave pedoform (Zebarth et al., 2002;
Montanari et al., 2005). The differences in the spatial distribution of soil properties in the different pedoforms are associated with variations in soil relief (water flow), and greater
variability of erosion is observed in the concave pedoform than in linear areas (Souza et al., 2003). Extreme cases of combinations of curvature of the terrain are represented by the
concave-convergent form (maximum concentration and accumulation of runoff) and by the convex-divergent form (maximum dispersion of runoff).
The orientation of the slopes (Table 4) can aid in description of the surface hydrological
structure through determination of the flow lines (drainage channels and water dividers),
evapotranspiration, insolation, and soil water content and, consequently, to soil properties
(Moore et al., 1993). The results show that the profiles that have N-oriented slopes in the region are P1T1-PVd, P3T1-PAal, and P2T2-TCk; and that P2T4-PVd is NE-oriented. The S-oriented profiles are P1T2-PBACal and P1T3-LVe, and P1T4-TXp is SE-oriented. The profile P2T1-PBACal, for its part, had an E-oriented slope, and P3T2-FTd is W-oriented.
According to Sirtoli (2008), the highest values of solar radiation are generally found on the
flat portions of the terrain, facing N/NE, and where there is no significant shading of the
relief, and the regions with lower solar radiation are found on slopes with high declivities and facing the S and SW. Solar radiation is a primary source of energy for physical and biological processes and, depending mainly on the exposure (north or south), there is
large variation in the energy received, affecting the pedoclimate and, consequently, the
soil properties (Resende, 1986).
Statistical analysis
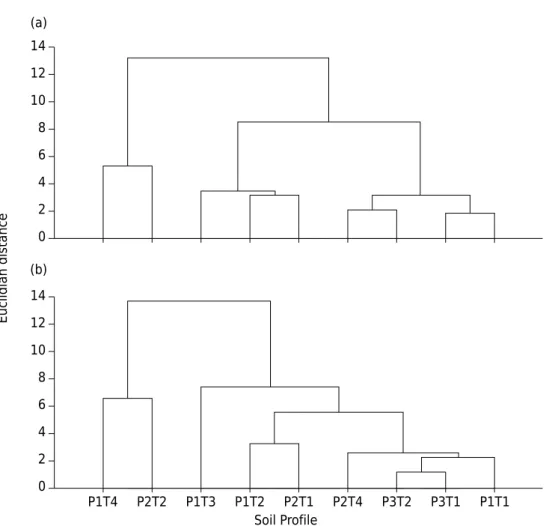
The affinity arrangement of the A and B horizons of the soils (Figure 3) was represented by the dendrogram based on Euclidean distance (coefficients of measurement of similarity),
determined by calculations from the correlation matrix between the variables studied,
where the formation of distinct groups can be identified.
Analyzing the factorial loads (Table 5), we can see which of the chemical and physical
properties of the soil determine differentiation of the horizons between the profiles. The objective was to know which soil properties among those that are important for its characterization are associated (correlated) and that influence the establishment of groupings of similar profiles. Factors 1, 2, and 3 that explained the variability of the basic data of the profiles and the correlation between the variables of the soils studied
were described by means of factorial analysis. From the results of analysis of soil factors
in horizons A and B (Table 5), it can be verified that the proportion of total soil variation explained by the first three factors for the chemical and physical variables were 91.9 %
for horizon A and 89.5 % for horizon B.
In the dendrogram, from the properties of the A horizon (Figure 3a), three distinct groups
were formed, taking into account a Euclidean distance of 6.0 between the profiles. Group 1 gathered the profiles P1T4-TXp and P2T2-TCk, with a distance of 5.5. Group 2 was formed by the profiles P1T2-PBACal, P3T1-PAal, and P2T1-PBACal, with a distance of 3.8. And group 3 consisted of the profiles P2T4-PVd, P3T2-FTd, P1T3-LVe, and P1T1-PVd,
with distance of 3.2. For the A horizon (Table 5), the variability of factor 1 (51.7 %) is due to active acidity [pH(H2O)], the organic C, Ca
2+, and Mg2+ contents, SB, CEC pH7, base
and Al saturation, and soil sand fraction, while 26.9 % of the total variation attributed to factor 2 is due to the contents of Al3+, potential acidity (H+Al), and degree of clay flocculation (CF). In contrast, factor 3 explains only 13.3 % of the variation, which was
caused by K+ concentrations in the soil.
In the dendrogram, from the properties of the B horizon (Figure 3b), four different groups were formed. Group 1 was formed by P1T4-TXp and P2T2-TCk, with distance of 6.8. Group
2 consisted only of P1T3-LVe, with a distance of 7.2. Group 3 was represented by
P1T2-PBACal and P2T1-P1T2-PBACal, with a distance of 3.2. Finally, group 4 was formed by profiles
P2T4-PVd, P3T2-FTd, P3T1-PAal, and P1T1-PVd, with a distance of 2.8. Within group 4,
the profiles that most resemble each other are P3T2-FTd and P3T1-PAal, with Euclidean
distance close to 1.2. For the B horizon (Table 5), we can see that 50.7 % of the total soil variation, caused by chemical and physical properties, is represented by factor 1, mainly by active acidity [pH(H2O)], exchangeable bases (Ca
2+, Mg2+, and K+), SB, CEC pH7,
base saturation, clay activity, and sand and silt/clay ratio. Factor 2 accounts for 24.2
Euclidian distanc
e
Soil Profile (a)
(b) 14
12
10
8
6
4
2
0
14
12
10
8
6
4
2
0
P1T4 P2T2 P1T3 P1T2 P2T1 P2T4 P3T2 P3T1 P1T1
Figure 3. Agglomerative hierarchical grouping between the horizons of the soil profiles by the method of dissimilarity by Euclidean distance: (a) dendrogram by the properties of the A horizon; (b) dendrogram by the properties of the B horizon.
Table 5. Factorial loads of chemical and physical variables in the first three axes in horizons A and B of the soil studied profiles
Variable Horizon A Horizon B
Factor 1 Factor 2 Factor 3 Factor 1 Factor 2 Factor 3
pH(H2O) 0.903 -0.272 -0.135 0.768 -0.547 -0.199
OC 0.822 0.444 0.336 - -
-Ca2+
0.989 -0.041 -0.039 0.977 -0.115 0.051
Mg2+
0.866 0.131 0.440 0.947 0.170 0.074
K+
0.153 0.100 0.929 0.764 0.482 0.043
Al3+
-0.340 0.907 0.226 0.207 0.952 0.120
H+Al 0.117 0.896 0.392 0.162 0.949 0.220
SB 0.991 0.005 0.100 0.990 -0.079 0.046
T 0.936 0.262 0.204 0.957 0.252 0.117
V 0.900 -0.377 0.205 0.739 -0.512 -0.285
m -0.789 0.553 -0.247 -0.575 0.631 0.326
Na% - - - 0.619 -0.654 -0.119
Tclay - - - 0.982 0.116 -0.078
Fe2O3 (SAFE) - - - 0.012 0.173 0.901
Sand -0.768 -0.365 -0.003 -0.722 0.202 -0.590
Total clay 0.318 0.508 0.578 0.038 0.341 0.886
Degree of flocculation 0.059 0.930 -0.203 -0.518 0.325 0.457
Silt/clay ratio - - - 0.780 -0.529 -0.039
Horizon thickness -0.627 -0.581 -0.271 - -
-Total variance (%) 51.7 26.9 13.3 50.7 24.2 14.6
The statistical classification by cluster analysis (Figure 3b) at first did not differ much from the taxonomic classification, at least at the first categorical level of the SiBCS
(orders), even because not all were analyzed or only physical, chemical and morphological
properties taken as diagnostic criteria that are considered within the soil classification keys. Thus, group 1 was formed by Luvissolos, characterized by higher pH, high Ca2+ and Mg2+ contents, eutrophic character, and high activity clay (Th) these soils were less weathered and shallower, where there was no ATC. The Latossolo formed a single group (group 2) because it was a soil that did not exhibit a textural gradient; it was more weathered/leached and deep, with lower clay and silt content, SB, and CEC of the low clay (Tl) compared to others, but it had low content of Al3+ and was eutrophic. Group 3 was formed by the Argissolos Bruno-Acinzentados, which stood out with high Al3+ content, high T
Clay, and low V (allytic character); in addition, ATC occurred in these profiles (abruptical). Group 4 was the most heterogeneous, but, even so, the
Plintossolo Argilúvico was closer to the Argissolo Amarelo Plíntico (smaller Euclidean distance) and, therefore, more similar to it than to the Argissolos Vermelhos. In this group, the lower Al3+ contents draw attention, together with the Tl that was generally lower than 20 cmolc kg-1 and low V, which exhibits a dystrophic character (except for P3T1, which is allytic).
CONCLUSIONS
Taxonomically, the soils of the southwestern region of RS (Campanha Gaúcha) varied
at both the subgroup and order levels because they had different chemical, physical, and morphological properties, influenced mainly by the type of source material (rock). Soils developed from the same geological formation have different physical and
chemical composition, which can be attributed to variations in the source material
due to changes in the depositional environment of the sedimentary package, or to
lithologic discontinuity.
Excluding the formation factors, organisms and time, the groupings of soils of different formations, indicate that, their differences are also due to the strong interaction of
this source material with the type and intensity of the morphogenetic processes,
influenced by the position they occupy in the landscape, conditioned by the relief and flow of water in the profile, since they supposedly were evolved under the same past
climate conditions.
Multivariate statistical analysis of factors allowed identification of the soil properties that were determinant in differentiation of the profiles.
Multivariate analysis made it possible to statistically differentiate the profiles within the same lithostratigraphic unit and at different relief positions, as well as differentiate the soils developed from different source materials that occupy similar positions in the pedo-landscape, through formation of homogeneous groups of profiles linked by their
degree of similarity.
REFERENCES
Bouyoucus GJ. Hydrometer method improved for making particle size analyses of soils. Agron J.
1962;54:464-5. https://doi.org/10.2134/agronj1962.00021962005400050028x
Brasil. Ministério da Agricultura - Departamento Nacional de Pesquisa Agropecuária - Divisão de Pesquisa Pedológica. Levantamento de Reconhecimento dos solos do Estado do Rio Grande do Sul. Recife: 1973. (Boletim técnico, 30)
Chagas CS. Mapeamento digital de solos por correlação ambiental e redes neurais em uma bacia
hidrográfica no domínio de Mar de Morros [tese]. Viçosa: Universidade Federal de Viçosa MG; 2006.
Claessen MEC, organizador. Manual de métodos de análise de solo. 2a ed. Rio de Janeiro: Centro Nacional de Pesquisa de Solos; 1997.
Companhia de Pesquisa de Recursos Minerais - CPRM. Mapa geológico do estado do Rio Grande do Sul. Escala 1:750.000. Porto Alegre: Serviço Geológico do Brasil; 2006.
Demattê JAM, Garcia GJ. Alteration of soil properties through a weathering
sequence as evaluated by spectral reflectance. Soil Sci Soc Am J. 1999;63:327-42.
https://doi.org/10.2136/sssaj1999.03615995006300020010x
Demattê JAM, Nanni MR. Weathering sequence of soils developed from basalt as evaluated by laboratory (IRIS), airborne (AVIRIS) and orbital (TM) sensors. Int J Rem Sens. 2003;24:4715-38. https://doi.org/10.1080/0143116031000075116
Empresa Brasileira de Pesquisa Agropecuária - Embrapa. Centro Nacional de Pesquisas de Solos. Manual de métodos de análise de solo. Rio de Janeiro: Embrapa Solos; 1979.
Empresa Brasileira de Pesquisa Agropecuária - Embrapa. Centro Nacional de Pesquisas de
Solos. Sistema brasileiro de classificação de solos. Rio de Janeiro: Embrapa Solos; 1999.
Gallant JC, Wilson JP. Primary topographic attributes. In: Wilson JP, Gallant JC, editors. Terrain
analysis: principles and applications. New York: John Wiley; 2000. p.51-85.
Justus JO, Machado MLA, Franco MSM. Geomorfologia. In: Instituto Brasileiro de Geografia e
Estatística. Levantamento de Recursos Naturais. V. 33: Folha SH.22 Porto Alegre e parte das folhas SH.21 Uruguaiana e SI.22 Lagoa Mirim. Rio de Janeiro; 1986. p.313-404.
Köppen W, Geiger R. Klimate der Erde. Gotha: Verlag Justus Perthes; 1928. Wall-map 150 cm × 200 cm.
Kravchenko AN, Bollero GA, Omonode RA, Bullock DG. Quantitative mapping of soil
drainage classes using topographical data and soil electrical conductivity. Soil Sci Soc Am J. 2002;66:235-43. https://doi.org/10.2136/sssaj2002.2350
Montanari R, Marques Júnior J, Pereira GT, Souza ZM. Forma da paisagem como critério para
otimização amostral de Latossolos sob cultivo de cana-de-açúcar. Pesq Agropec Bras. 2005;40:69-77.
Moore ID, Gessler PE, Nielsen GA, Peterson GA. Soil attribute prediction using terrain analysis. Soil Sci Soc Am J. 1993;57:443-52. https://doi.org/10.2136/sssaj1993.03615995005700020026x
Pedron FA, Samuel-Rosa A, Dalmolin RSD. Variação das características pedológicas e
classificação taxonômica de Argissolos derivados de rochas sedimentares. Rev Bras Cienc Solo.
2012;36:1-9. https://doi.org/10.1590/S0100-06832012000100001
Prefeitura Municipal de Rosário do Sul - PMRS. Perfil geopolítico do
município. Secretaria de Planejamento; 2005 [aceso em 8 de maio de 2012]. Disponível em: http://www.prefeituraderosario.com.br/planeja/planeja.htm.
Resende M, Curi N, Resende SB, Corrêa GF. Pedologia: base para distinção de ambientes. 2a ed. Viçosa: Núcleo de Estudo de Planejamento e Uso da Terra; 1997.
Resende M, Curi N, Resende SB, Corrêa GF. Pedologia: base para distinção de ambientes. 5a ed. Lavras: UFLA; 2007.
Resende M. Clima do solo e suas relações com o ambiente agrícola. Inf Agropec. 1986;138:43-59.
Santos PG. Mineralogia, gênese e relações pedogeomórficas de solos desenvolvidos de
litologias das formações Pirambóia, Sanga-do-Cabral e Guará na região sudoeste do Estado do Rio Grande do Sul [tese]. Lages: Universidade do Estado de Santa Catarina; 2015.
Santos PG, Bertol I, Miquelluti DJ, Almeida JA, Mafra AL. Agrupamento de pedons de Cambissolos Húmicos com base em atributos físicos e químicos utilizando a estatística multivariada.
Rev Bras Cienc Solo. 2015a;39:350-60. https://doi.org/10.1590/01000683rbcs20130415
Santos RD, Santos HG, Ker JC, Anjos LHC, Shimizu SH. Manual de descrição e coleta de solo no campo. 7a ed. Viçosa, MG: Sociedade Brasileira de Ciência do Solo; 2015b.
Santos HG, Jacomine PKT, Anjos LHC, Oliveira VA, Oliveira JB, Coelho MR, Lumbreras JF, Cunha TJF.
Schneider P, Giasson E, Klamt E. Morfologia do solo. Guaíba: Agrolivros; 2007.
Sirtoli AE. Mapeamento de solos com auxílio da Geologia, atributos do terreno e índices espectrais
integrados por redes neurais artificiais [tese]. Curitiba: Universidade Federal do Paraná; 2008. Soil Survey Staff. Keys to soil taxonomy. 12th ed. Washington, DC: United States Department of
Agriculture, Natural Resources Conservation Service; 2014.
Souza CK, Marques Júnior J, Martins Filho MV, Pereira GT. Influência do relevo na variação
anisotrópica dos atributos químicos e granulométricos de um Latossolo em Jaboticabal, SP. Eng Agríc. 2003;23:486-95.
Statsoft Inc. Statistica - Data analysis software system. Version 8.0 [internet]; 2007 [accessed on Mar 21, 2010]. Available at: http://www.statsoft.com.
Tedesco MJ, Gianello C, Bissani CA, Bohnen H, Volkweiss SJ. Análises de solo, plantas e outros
materiais. 2a ed rev e ampl. Porto Alegre: Universidade Federal do Rio Grande do Sul; 1995.
Troeh FR. Landform equations fitted to contour maps. Am J Sci. 1965;263:616-27.
https://doi.org/10.2475/ajs.263.7.616
Valeriano MM. Topodata: guia para utilização de dados geomorfológicos locais. São José dos Campos: INPE; 2008.
Webster R, Oliver MA. Statistical methods in soil and land resource survey. Oxford: University Press; 1990.
Zebarth BJ, Rees H, Walsh J, Chow L, Pennock DJ. Soil variation within a hummocky