* Corresponding author: E-mail: jaime.almeida@udesc.br Received: March 17, 2017 Approved: September 21, 2017 How to cite: Almeida JA, Corrêa J, Schmitt C. Clay mineralogy of Basaltic Hillsides soils in the western state of Santa Catarina. Rev Bras Cienc Solo. 2018;42:e0170086.
https://doi.org/10.1590/18069657rbcs20170086
Copyright: This is an open-access article distributed under the terms of the Creative Commons Attribution License, which permits unrestricted use, distribution, and reproduction in any medium, provided that the original author and source are credited.
Clay Mineralogy of Basaltic Hillsides
Soils in the Western State of
Santa Catarina
Jaime Antonio de Almeida(1)*
, Janaina Corrêa(2)
and Catiline Schmitt(2)
(1)
Universidade do Estado de Santa Catarina, Departamento de Solos, Lages, Santa Catarina, Brasil.
(2)
Universidade do Estado de Santa Catarina, Departamento de Solos, Programa de Pós-Graduação em Ciência do Solo, Lages, Santa Catarina, Brasil.
ABSTRACT: A commonly accepted concept holds that highly fertile, shallow soils are predominant in the Basaltic Hillsides of Santa Catarina State, in southern Brazil, but their agricultural use is restricted, either by excessive stoniness, low effective depth or steep slopes. Information about soil properties and distribution along the slopes in this region is, however, scarce, especially regarding genesis and clay fraction mineralogy. The objective of this study was to evaluate soil properties of 12 profiles distributed in three toposequences (T) of the Basaltic Hillsides in the State of Santa Catarina, two located in the valley of the Peixe River (Luzerna - T1 and Ipira - T2) and one in Descanso, in the far West of the state (T3). The main focus was the mineralogical composition of the clay fraction, identified by X-ray diffractometry (XRD), and its relations with the soil chemical properties. The morphological, chemical, and mineralogical properties of the soils of the toposequences differed from each other. In most soils, the position of the most intense XRD reflections indicated predominance of kaolinite (K) however, for being broad and asymmetric, a participation of interstratified kaolinite-smectite (K-S) was assumed. Soils of T2 and T3, located in regions with higher temperatures, lower water surplus, and lower altitude than those of T1, were more fertile, mostly redder, and contained higher proportions of smectites (S) and interstratified K-S mineral, accounting for a higher activity of the clay fraction of most soils. The T1 soils were generally less fertile, with lower clay activity and, aside from kaolinite, contained smectites with interlayered hydroxy-Al polymers (HIS). The low estimated smectite contents of the most fertile soils of all toposequences disagree with the high values of cation exchange capacity (CEC) and clay activity related to pure kaolinite soils. The broad and asymmetric reflections of most of the supposed kaolinites identified as dominant minerals indicate the presence of K-S interlayers, most likely contributing to raise the CEC of the soils.
INTRODUCTION
The area known as Basaltic Hillsides corresponds to little more than a quarter of the territory of Santa Catarina and consists of minor municipalities with small and medium-sized rural properties, whose main economic activities are agriculture and animal husbandry (Epagri, 2014). According to a generalized widespread concept, the soils on the Basaltic Hillsides are predominantly shallow to not very deep and highly fertile, whereas their agricultural use is restricted by excessive stoniness, low effective depth or limitations due to steep slopes (Potter et al., 1998).
The geology of the region is determined by the Serra Geral mountain range, recently reclassified in the category Serra Geral Group (Santa Catarina, 2014), and composed of basic and intermediate lava flows that occurred approximately 120-135 million years ago in the Paraná Basin (Castro, 1994; Santa Catarina, 2014). During and after the lava flows, the pedogenesis on the basaltic hillsides was strongly influenced by climatic variations in the late Pleistocene and throughout the Holocene, e.g., the occurrence of glacial and interglacial eras (Nakata and Coelho, 1986; Ledru, 1993), forming the geomorphological unit of the Dissected Plateau of the Rivers Iguaçu/Uruguai (Santa Catarina, 2014). The area has a predominantly rugged multilevel topography, delineated by the succession of lava spills, forming relatively young, narrow valleys with intense dissection, and dynamic relief (Bigarella et al., 1965; Leinz and Amaral, 1969). Currently, these valleys have peculiar characteristics of specific microclimates (Sacco, 2010), resulting in a great variety of combinations of different relief phases, which may cause differences in soil properties within small distances.
Mainly soils with fine texture were derived from the effusive rocks of the Serra Geral Mountain Range, with highly varied depth and colors, according to the other relief and climate conditions. The predominantly reported classes are Latossolos and Nitossolos (Oxisols) at sites with a flatter relief and Neossolos and Cambissolos (Inceptisols and Entisols) where the relief is more rugged (Embrapa, 2004). The commonly observed mineralogy in the soils developing from these rocks is predominantly kaolinitic. However, some soils have a mineralogical composition in which 2:1 minerals and oxyhydroxides (mainly hematite and goethite) predominate (Kämpf et al., 1995; Paisani and Geremia, 2010; Pedron et al., 2012; Teske et al., 2013).
Another relevant and common occurrence in the mineralogy of these soils are kaolinites with diffraction patterns different from the kaolinites generally found in other Brazilian soils. These kaolinites are characterized by broad and asymmetric reflections in the hkl 001 and 002 atomic planes, resulting in d001 values equal to or greater than 0.72 nm, which may indicate
interstratified minerals, mainly of the kaolinite-smectite type (Bortoluzzi et al., 2007; Teske et al., 2013). In addition to the interstratified minerals, the description of 2:1 clay minerals with interlayered hydroxy-Al polymers, as those studied by Kämpf et al. (1995), is very frequent.
Based on the assumptions of a relatively young age of the landscape, the mineralogical components of the originating rock, and the relatively high activity values of the clay fraction of most of these soils, the hypothesis of a considerable content of expandable clay minerals with high CEC in the clay fraction mineralogy was established. The objective of this study was to describe and characterize 12 soil profiles distributed in three toposequences of the Basaltic Hillsides of the State of Santa Catarina, with emphasis on an analysis of the mineralogical composition of the clay fraction, identified by X-ray diffractometry (XRD), and its relation to the soil chemical properties.
MATERIALS AND METHODS
basalts and phenobasalts from the Serra Geral Group (Santa Catarina, 2014). From the geomorphological point of view, the region corresponds to the Dissected Plateau of the Iguaçu and Uruguay Rivers, cut by deep valleys with levelled slopes (Embrapa, 2004; Santa Catarina, 2014).
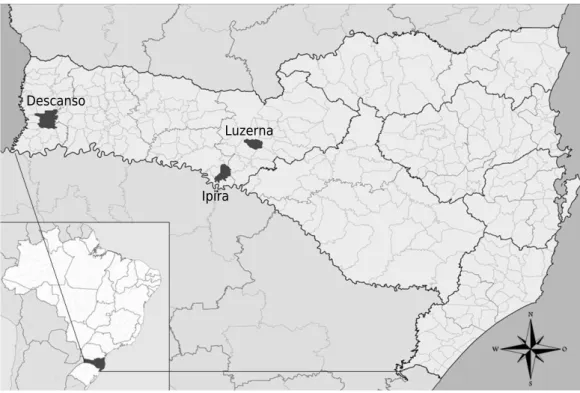
Three toposequences, with different microclimates, of the western region of the state of Santa Catarina were selected. Four soil profiles representing different segments of the landscape were described for each (Table 1). The first two toposequences were determined in the Peixe River valley (toposequence I, in the municipality of Luzerna, with Cfb climate and toposequence II, between the municipalities of Ipira and Peritiba, with Cfa climate); toposequence III was described in the Antas River valley, in the far west of the state, in the municipality of Descanso (Figure 1), also under Cfa climate, but with a lower soil water surplus, since the average temperatures are higher, favoring evapotranspiration. The soil morphology of each profile was described as proposed by Santos et al. (2005). After sampling, the material was air-dried, crumbled and ground, and the fraction <2 mm was separated by sieving to obtain the air-dried fine earth (ADFE) fraction.
Physical analyses
The particle-size distribution was determined after sample dispersion of the ADFE fraction with water and dispersant (NaOH 1 mol L-1). The gravel, pebbles, and sand fraction was
separated by wet screen sieving. The clay fraction was determined by the densimeter method and silt calculated by subtraction (Claessen, 1997).
Chemical analyses
Chemical analyses included pH(H2O) which was determined by potentiometry; total
organic carbon was determined by the Walkley-Black method (adapted) by oxidation of the organic compounds and quantification by the colorimetric method, according to Tedesco et al. (1995). Contents of Ca2+ and Mg2+ were determined by plasma spectrometry
Figure 1. Image of the study area with the location of the municipalities where the three toposequences evaluated were described. Toposequence 1: Luzerna; Toposequence 2:
Ipira-Piratuba; and toposequence 3: Descanso. Source: Raphael Lorenzeto de Abreu - Wikipedia, accessed 11/17/2015 (Modified image).
after extraction with KCl 1.0 mol L-1; K+ and Na+ were extracted with 1.0 mol L-1 ammonium
acetate and quantified by flame photometry; Al3+ was extracted with 1.0 mol L-1 KCl
solution and quantified by titration with 0.025 mol L-1 NaOH; and potential acidity (H+Al)
was determined after extraction with calcium acetate buffered at pH 7.0 and quantified by titration with NaOH (0.0606 mol L-1). Based on the contents of these elements, the
following parameters were calculated: sum of bases (S), effective CEC, CEC at pH 7.0, base saturation (V). All these analyses were performed according to Claessen (1997).
The SiO2, Fe2O3, and Al2O3 contents were determined by plasma spectrometry after
digestion by the sulfuric attack method, according to Claessen (1997). From these contents, the Ki index [(SiO2 × 1.70)/Al2O3] was calculated.
Mineralogical analyses
The clay fraction of the sub-horizons of the main diagnostic horizons of each profile was analyzed by specific identification treatments of the component minerals. The preparation consisted of saturation of part of the samples with K (KCl) and with Mg (MgCl2)
solutions, removal of excess salts, and later oriented clay slides were prepared and air-dried. The dried slides of K-treated samples were subsequently heated to 100, 350, and 550 °C in a muffle oven, and readings performed after each heat treatment. After drying, the Mg-treated slides were placed in an ethylene-glycol-saturated atmosphere at 65 °C. The K- and Mg saturated and air-dried samples were analyzed in the angular range from 3 to 30 °2θ. The K-saturated and heat-treated, as well as the Mg-treated and ethylene-glycol-solvated samples of toposequences 1 and 2 were analyzed in an angular range from 3 to 15 °2θ, and those of the last toposequence from 3 to 40 °2θ. This procedure was adopted since in the first two, the objective was to investigate only possible changes in the position of the reflections of the 2:1-layer minerals that occur at the lower angles and, in the latter, possible changes that could occur at larger angles.
For the identification of the mineral phases, a Philips X-ray diffractometer (XRD) was used, with vertical goniometer and θ/2θ geometry, in the step-by-step scanning mode (0.02 °2θ), using the Cu tube and Kα radiation.
The results were interpreted based on the mineral-specific interplanar spacings, as proposed by Brown and Brindley (1980) and Whittig and Allardice (1986). In order to compare the kaolinite reflection pattern of the studied soils with that of more crystalline kaolinites, a fine clay fraction sample of a sandstone-derived Oxisol was used as reference, with small width at half height (WHH). For the sample analysis, a cobalt tube was used. The minerals in the clay fraction were semi-quantified based on the relative area of the main reflection of each mineral, in relation to the total area of minerals present, using the “fit profile” option of software X’Pert Highscore Plus, version 2.2b (Panalytical B. V. Netherlands, 2006).
RESULTS AND DISCUSSION
Toposequence 1
[Humic Rhodic Eutrudox (Soil Survey Staff, 2014)], was sampled in a middle-third slope position, at a lower altitude, also with high sum of bases and CEC at pH 7. However, the excessive amount of stones, both in the soil mass and on the surface, hampers soil use and management. In this toposequence, the soils are not only situated at higher altitudes (between 800 and 575 m from P1 to P4), but the shape of the valleys is also more open than in Toposequence II. The climate is colder, favoring a greater accumulation of organic matter, with more brown/yellowish-brown colors (hues 7.5YR and 5.0YR) prevailing in the first three profiles (Table 2).
The mineralogical composition of the clay fraction was similar in most of the B horizon samples, with reflections at prevailing d-values around 0.720 and 0.360 nm, usually attributed to kaolinite, followed by less intense reflections (d value around 1,400 nm), indicating the presence of clay minerals of the 2:1 layer type, in some cases with interlayered hydroxy-Al polymers (2:1 HE) at higher or lower proportions (Figure 2). There were also weak reflections indicating aluminum oxide (gibbsite) (d =0.480 nm) and some related to the main reflection of iron oxyhydroxide goethite (d =0.410 nm). In all samples, reflections with a mean d-value around 0.720 nm showed asymmetry at lower 2θ angles and a width at half height (WHH) ranging from 0.890 to 1.080 nm (Table 4). This suggests a kaolinite pattern different from that of other Brazilian environments, as described by Melo et al. (2002) in soils derived from sedimentary rocks of the Barreiras Group (ES), with WHH between 0.29 and 0.39. This asymmetry pattern along with high WHH values was observed in all soil profiles analyzed in this study, with varying degrees of intensity. These characteristics indicate the presence of interstratified minerals, possibly kaolinite-smectite (K-S) type, associated or not with kaolinites, according to Środoń (2006) and Ryan and Huertas (2009). However, ethylene glycol impregnation, and/or heat treatments generally used to identify their presence (Ryan and Huertas, 2009) induced no modification in the reflection patterns at this position, indicating that the interlayer space of the expandable portion of the interstratification may be blocked with hydroxy-Al polymers (Delvaux et al., 1990; Bühmann and Grubb, 1991). Thus, with the XRD tools alone, the type and proportion at which these interstratified minerals occur in the soil samples could not be identified.
Table 1. Soil classification according to Soil Taxonomy (Soil Survey Staff, 2014) and Brazilian Soil Classification System
(Santos et al., 2013), altitude above sea level, position in the landscape, and declivity of the studied soil profiles Profile Classification SystemSoil Taxonomy SiBCS Classification Altitude Position in the
landscape Declivity
m %
Toposequence I
P1 Humic Hapludox Nitossolo Bruno Distroférrico húmico 785 Interfluve 15 P2 Humic Hapludox Nitossolo Háplico Distroférrico húmico 710 Upper slope 12 P3 Typic Dystrudept Cambissolo Háplico Ta Eutrófico típico 670 3rd level pediment 20 P4 Humic Rhodic Eutrudox Nitossolo Vermelho Eutroférrico típico 575 Middle thrird of slope 25
Toposequence II
P5 Humic Rhodic Eutrudox Nitossolo Vermelho Eutroférrico
chernossólico 690 Interfluve 10
P6 Typic Argiudoll Chernossolo Argilúvico Órtico típico 585 Lower third of slope 25 P7 Typic Argiudoll Argissolo Vermelho-Amarelo Eutrófico típico 550 Lower third of slope 12 P8 Lithic Udorthents Neossolo Litólico Chernossólico fragmentário 485 Lower third of slope 35
Toposequence III
Table 2. Morphological properties, particle size, organic matter content, and pH of soil profiles developed on basaltic rocks of the
western region of Santa Catarina State
Profile Hz Depth Wet color G+P Sand Clay OM pH(H2O)
m % g kg-1
% Toposequence I
P1
A1 0.00 - 0.21 10YR 3/2 0.34 90 580 7.33 4.40
A2 0.21 - 0.45 10YR 3/3 0.39 80 680 5.28 4.40
A3 0.45 - 0.67 7.5YR 3/3 0.57 80 720 3.05 4.50
AB 0.67 - 0.86 7.5YR 3/3 1.38 60 760 2.84 4.60
BA 0.86 - 1.19 7.5YR 3/4 0.83 60 770 1.64 4.80
B1 1.19 - 1.55 7.5YR 4/4 0.33 60 780 1.74 5.00
B2 1.55- 2.00 7.5YR 4/4 0.21 40 800 0.47 5.13
B3 2.00 - 2.70+ 7.5YR 4/4 0.32 50 750 0.28 5.20
P2
A 0.00 - 0.28 5YR 4/4 1.07 70 670 4.65 4.73
BA 0.28 - 0.50 5YR 4/4 0.28 50 680 2.45 4.60
Bt1 0.50 - 1.00 4YR 3/4 0.00 50 620 1.78 4.60
Bt2 1.00 - 1.55 4YR 4/6 0.80 40 680 0.86 4.72
Bt3 1.55 - 1.90 4YR 4/6 1.20 50 620 0.48 4.88
BC 1.90 - 2.50 4YR 4/6 1.37 40 520 0.22 4.90
P3 A 0.00 - 0.34 7.5YR 3/3 6.64 330 480 3.43 4.90
Bi 0.34 - 0.70/1.00 7.5YR 3/4 35.53 380 400 1.62 5.20
P4
A 0.00 - 0.30 3.5YR 3/4 6.71 210 420 2.79 5.40
AB 0.30 - 0.78 2.5YR3/6 23.19 190 450 1.55 5.50
Bt 0.78 - 1.60 2.5YR4/6 3.77 80 520 0.59 5.38
BC 1.60 - 1.95 2.5YR3/6 5.52 100 430 0.28 5.52
Toposequence II
P5
A 0.00 - 0.30 7.5YR 3/3 4.90 170 370 5.14 5.90
BA 0.30 - 0.43 5YR 3/3 10.18 110 570 2.14 5.80
Bt1 0.43 - 0.75 2.5YR 2.5/4 0.21 30 550 1.48 5.80
Bt2 0.75 - 1.50 2.5YR 2.5/4 0.05 30 570 0.79 5.40
BC 1.50 - 1.90 2.5YR 2.5/3 0.0 30 470 0.52 5.40
P6
A 0.00 - 0.28 5YR 3/3 20.36 330 230 3.15 6.00
BA 0.28 - 0.50 2.5YR 2.5/4 40.71 240 360 0.85 6.10
2Bt1 0.50 - 0.80 3.5YR3/6 16.36 70 530 1.17 6.10
2Bt2 0.80 - 1.50 3.5YR3/6 12.67 70 500 0.46 5.40
P7
A 0.00 - 0.25/0.30 7.5YR 3/3 17.40 250 330 5.59 6.30
2BA 0.25/0.30 - 0.50/0.60 5YR 3/3 41.57 310 630 1.67 6.50
3Bt 0.50/0.60 - 1.12+
2.5YR 2.5/4 19.86 90 580 0.69 6.60
P8 A 0.00 - 0.25 7.5YR 3/3 8.50 140 280 3.28 5.50
Toposequence III
P9
A1 0.00 - 0.25 5YR 3/4 3.58 270 500 4.07 4.98
A2 0.25 - 0.42 5YR 3/4 3.57 240 520 2.55 4.99
AB 0.42 - 0.60 5YR 4/4 13.32 220 570 2.22 4.90
BA 0.60 - 0.72 5YR 4/4 32.43 200 600 1.84 5.32
Bi 0.72 - 0.92/0.97 5YR 4/4 17.69 200 580 1.45 4.88
P10
A1 0.00 - 0.12 5YR 3/3 6.19 220 420 2.99 5.64
A2 0.12 - 0.32 5YR 3/3 8.19 210 400 2.74 5.66
AB 0.32 - 0.42 5YR 3/3 46.66 240 370 1.37 5.82
BA 0.42 - 0.53/0.60 5YR 3/4 27.40 250 400 0.97 5.81
Bt 0.53/0.60 - 0.84/0.90 2.5YR 2.5/4 12.41 180 470 0.88 5.63
P11
A 0.00 - 0.34 5YR 3/4 50.83 320 310 5.36 6.04
AB 0.34 - 0.70 5YR 3/4 59.96 330 320 2.45 6.32
Bi 0.70 - 1.00+
5 YR 4/6 68.85 300 370 1.45 6.24
P12
A1 0.00 - 0.21 7.5YR 3/3 1.22 180 550 4.51 5.71
A2 0.21 - 0.35 5YR 3/3 0.06 150 570 3.35 5.83
BA 0.35 - 0.50 2.5YR 2.5/4 0.01 110 690 2.12 5.65
Bt1 0.50 - 0.84 5YR 3/4 0.04 90 750 1.60 5.04
Bt2 0.84 - 1.50 5YR 4/4 4.09 70 780 1.38 5.00
Bt3 1.50 - 2.00+
5YR 3/4 3.19 60 730 0.84 5.07
In the B horizon of profile 1 (Nitossolo Bruno - Humic Hapludox), there was a small shift of the 1.40 nm reflections to higher d values after ethylene glycol solvation and a reduction in the intensity of the reflections in relation to the Mg treatment. This indicates a slight expansion of some of the minerals, confirming the presence of an expansive mineral, probably smectite (Figure 2). The K saturation- and heat) treatments to a 350 °C caused dilution of the reflections between 1.40 and 1.00 nm, indicating an irregular shrinkage of the layers, probably resulting from their differentiated occupation with hydroxy-Al polymers in the interlayers. Heating to 550 °C resulted in the definition of a broad reflection at a mean position around 1.050 nm, indicating smectites with interlayered hydroxyl-Al polymers (SIHP). A similar conclusion was drawn by Ryan and Huertas (2009) for soils with smectites in Costa Rica. The semi-quantification of the minerals suggested that SIHP correspond to approximately 15 % and the reflection in the position of plane 001 of “kaolinite” to 85 % of the clay minerals (determined from the relation between areas of the minerals shown in table 4). This large amount of low-load minerals conditioned the low values of the clay fraction activity in the B horizon (5.3-8.9 cmolc kg
-1)
(Table 3). These values are therefore compatible with those generally attributed to kaolinite, suggesting that the presence of hydroxyl-Al polymers, both in SIHP and in the 2:1 layers of interstratified K-S, possibly present in association with kaolinite, lead to drastically lower CEC values in these minerals than their pure counterparts, consequently contributing very little to an increase in soil CEC.
Figure 2. Diffractograms of the clay fraction of the B horizons of profiles from toposequence 1. K 25 °C, K 350 °C, and K 550 °C
indicate, respectively, K-saturated samples heated to the indicated temperatures; Mg and Mg+Et Glycol indicate, respectively, Mg-saturated samples followed by glycolation. Reflection values in nm (nanometers).
600 1.403 0.716
0.716 0.716 0.483 0.483 0.414 0.414 0.355 0.355 0.716 1.406 1.403 1.052
K 550o
K 350o
K 25o
Mg Mg+Et Glicol 400 200 500 0 00 500 2000 1000 1000 0 0 400 300 200 0 600 400 400 300 200 200 0 0 200 300 800 600 400 400 0 0 400 200 0 5 10 1.005 1.005 1.328 1.365 1.403 0.716
0.716 0.413 0.3570.335
0.357 0.335
Mg
K 25o
K 350o
K 550o
Mg+Et Glicol
0.413 0.716
0.716
15 20 25 30
600 1.413
P2 Hz Bt2 Counts
P1 Hz B2 Counts
P4 Hz Bt Counts
P3 Hz Bi Counts 0.716 0.716 0.716 0.414 0.414 0.355 0.355 0.716 1.403 1.400 1.010
K 550o
K 350o
K 25o
Mg Mg+Et Glicol 400 200 600 400 200 600 400 200 0 0 1500 1000 500 0 1000 500 0 o 2θ (Cuκα) 1000 500 800 600 400 200 0 0 200 400 1500 1000 500 600 0 0 200 100 0 5 10 1.005 0.723
0.723 0.414 0.3540.335
0.354 0.335
Mg
K 25o
K 350o
K 550o
Mg+Et Glicol
0.414 0.723
0.723
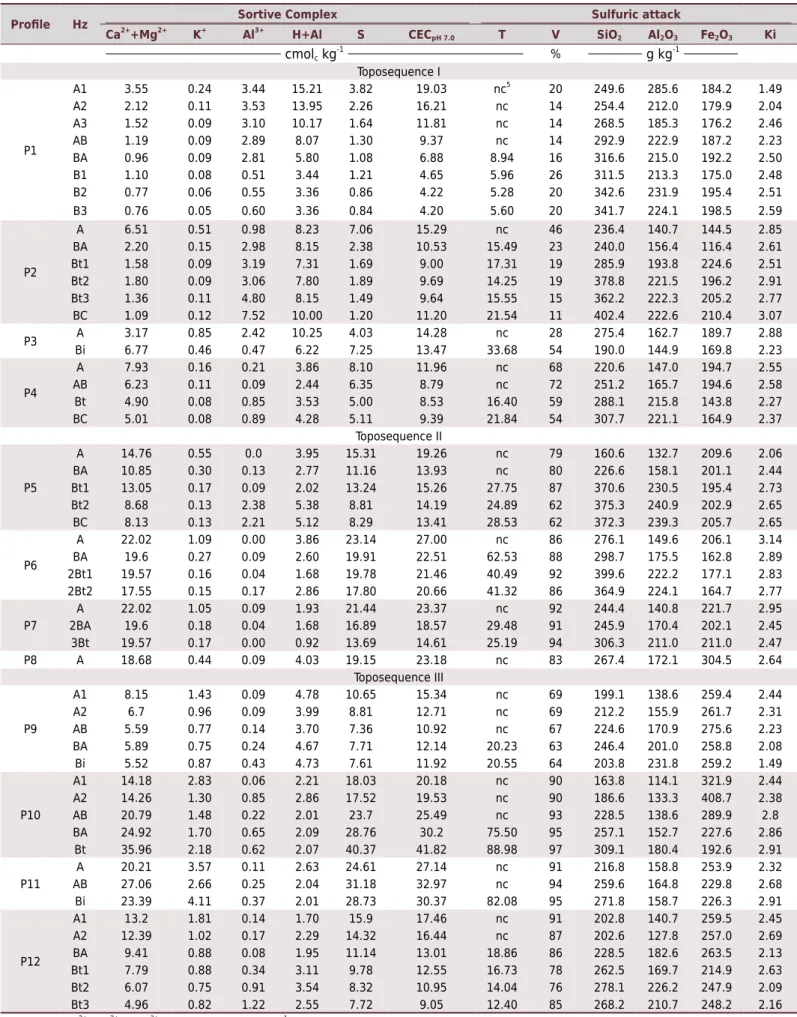
Table 3. Chemical properties, contents of the elements obtained by sulfuric attack (expressed as oxides), and Ki ratio of soil profiles
developed on rocks of the basaltic slopes of Santa Catarina
Profile Hz Sortive Complex Sulfuric attack
Ca2+ +Mg2+
K+
Al3+
H+Al S CECpH 7.0 T V SiO2 Al2O3 Fe2O3 Ki
cmolc kg-1 % g kg-1
Toposequence I
P1
A1 3.55 0.24 3.44 15.21 3.82 19.03 nc5
20 249.6 285.6 184.2 1.49
A2 2.12 0.11 3.53 13.95 2.26 16.21 nc 14 254.4 212.0 179.9 2.04
A3 1.52 0.09 3.10 10.17 1.64 11.81 nc 14 268.5 185.3 176.2 2.46
AB 1.19 0.09 2.89 8.07 1.30 9.37 nc 14 292.9 222.9 187.2 2.23
BA 0.96 0.09 2.81 5.80 1.08 6.88 8.94 16 316.6 215.0 192.2 2.50
B1 1.10 0.08 0.51 3.44 1.21 4.65 5.96 26 311.5 213.3 175.0 2.48
B2 0.77 0.06 0.55 3.36 0.86 4.22 5.28 20 342.6 231.9 195.4 2.51
B3 0.76 0.05 0.60 3.36 0.84 4.20 5.60 20 341.7 224.1 198.5 2.59
P2
A 6.51 0.51 0.98 8.23 7.06 15.29 nc 46 236.4 140.7 144.5 2.85
BA 2.20 0.15 2.98 8.15 2.38 10.53 15.49 23 240.0 156.4 116.4 2.61
Bt1 1.58 0.09 3.19 7.31 1.69 9.00 17.31 19 285.9 193.8 224.6 2.51
Bt2 1.80 0.09 3.06 7.80 1.89 9.69 14.25 19 378.8 221.5 196.2 2.91
Bt3 1.36 0.11 4.80 8.15 1.49 9.64 15.55 15 362.2 222.3 205.2 2.77
BC 1.09 0.12 7.52 10.00 1.20 11.20 21.54 11 402.4 222.6 210.4 3.07
P3 A 3.17 0.85 2.42 10.25 4.03 14.28 nc 28 275.4 162.7 189.7 2.88
Bi 6.77 0.46 0.47 6.22 7.25 13.47 33.68 54 190.0 144.9 169.8 2.23
P4
A 7.93 0.16 0.21 3.86 8.10 11.96 nc 68 220.6 147.0 194.7 2.55
AB 6.23 0.11 0.09 2.44 6.35 8.79 nc 72 251.2 165.7 194.6 2.58
Bt 4.90 0.08 0.85 3.53 5.00 8.53 16.40 59 288.1 215.8 143.8 2.27
BC 5.01 0.08 0.89 4.28 5.11 9.39 21.84 54 307.7 221.1 164.9 2.37
Toposequence II
P5
A 14.76 0.55 0.0 3.95 15.31 19.26 nc 79 160.6 132.7 209.6 2.06
BA 10.85 0.30 0.13 2.77 11.16 13.93 nc 80 226.6 158.1 201.1 2.44
Bt1 13.05 0.17 0.09 2.02 13.24 15.26 27.75 87 370.6 230.5 195.4 2.73
Bt2 8.68 0.13 2.38 5.38 8.81 14.19 24.89 62 375.3 240.9 202.9 2.65
BC 8.13 0.13 2.21 5.12 8.29 13.41 28.53 62 372.3 239.3 205.7 2.65
P6
A 22.02 1.09 0.00 3.86 23.14 27.00 nc 86 276.1 149.6 206.1 3.14
BA 19.6 0.27 0.09 2.60 19.91 22.51 62.53 88 298.7 175.5 162.8 2.89
2Bt1 19.57 0.16 0.04 1.68 19.78 21.46 40.49 92 399.6 222.2 177.1 2.83
2Bt2 17.55 0.15 0.17 2.86 17.80 20.66 41.32 86 364.9 224.1 164.7 2.77
P7
A 22.02 1.05 0.09 1.93 21.44 23.37 nc 92 244.4 140.8 221.7 2.95
2BA 19.6 0.18 0.04 1.68 16.89 18.57 29.48 91 245.9 170.4 202.1 2.45
3Bt 19.57 0.17 0.00 0.92 13.69 14.61 25.19 94 306.3 211.0 211.0 2.47
P8 A 18.68 0.44 0.09 4.03 19.15 23.18 nc 83 267.4 172.1 304.5 2.64
Toposequence III
P9
A1 8.15 1.43 0.09 4.78 10.65 15.34 nc 69 199.1 138.6 259.4 2.44
A2 6.7 0.96 0.09 3.99 8.81 12.71 nc 69 212.2 155.9 261.7 2.31
AB 5.59 0.77 0.14 3.70 7.36 10.92 nc 67 224.6 170.9 275.6 2.23
BA 5.89 0.75 0.24 4.67 7.71 12.14 20.23 63 246.4 201.0 258.8 2.08
Bi 5.52 0.87 0.43 4.73 7.61 11.92 20.55 64 203.8 231.8 259.2 1.49
P10
A1 14.18 2.83 0.06 2.21 18.03 20.18 nc 90 163.8 114.1 321.9 2.44
A2 14.26 1.30 0.85 2.86 17.52 19.53 nc 90 186.6 133.3 408.7 2.38
AB 20.79 1.48 0.22 2.01 23.7 25.49 nc 93 228.5 138.6 289.9 2.8
BA 24.92 1.70 0.65 2.09 28.76 30.2 75.50 95 257.1 152.7 227.6 2.86
Bt 35.96 2.18 0.62 2.07 40.37 41.82 88.98 97 309.1 180.4 192.6 2.91
P11
A 20.21 3.57 0.11 2.63 24.61 27.14 nc 91 216.8 158.8 253.9 2.32
AB 27.06 2.66 0.25 2.04 31.18 32.97 nc 94 259.6 164.8 229.8 2.68
Bi 23.39 4.11 0.37 2.01 28.73 30.37 82.08 95 271.8 158.7 226.3 2.91
P12
A1 13.2 1.81 0.14 1.70 15.9 17.46 nc 91 202.8 140.7 259.5 2.45
A2 12.39 1.02 0.17 2.29 14.32 16.44 nc 87 202.6 127.8 257.0 2.69
BA 9.41 0.88 0.08 1.95 11.14 13.01 18.86 86 228.5 182.6 263.5 2.13
Bt1 7.79 0.88 0.34 3.11 9.78 12.55 16.73 78 262.5 169.7 214.9 2.63
Bt2 6.07 0.75 0.91 3.54 8.32 10.95 14.04 76 278.1 226.2 247.9 2.09
Bt3 4.96 0.82 1.22 2.55 7.72 9.05 12.40 85 268.2 210.7 248.2 2.16
Hz = horizon; Ca2+
+Mg2+
and Al3+ extracted with KCl 1 mol L-1; H+Al extracted with calcium acetate pH 7 buffered and determined by titulometry; CEC pH 7 = S + (H+Al);
In the B horizon of profiles 2 (Nitossolo Háplico - Humic Hapludox) and 3 (Cambissolo Háplico - Typic Dystrudept), the diffractogram pattern is similar to that of profile 1, differing only by the lower expression of the main gibbsite reflection and lower intensity of the reflections around 1.400 nm in P3 (Figure 2). The complete dilution of the reflections between 1.00 and 1.40 nm in the K-treated samples heated to 350 °C in P2, combined with the incomplete shrinkage of the layers by heating to 550 °C, both in P2 and in P3, indicates that the expandable 2:1-layer phyllosilicates have interlayered hydroxy-Al polymers (Barnhisel and Bertsch, 1989), which means that they are probably SIHP, as interpreted based on studies of Ryan & Huertas (2009). However, the amount of Al polymers in the P3 sample appears to be smaller, since the reflection is better defined and has a mean value at a position closer to 1.005 nm.
In the B horizon of profile 4 (Nitossolo Vermelho - Humic Rhodic Eutrudox), intense reflections, corresponding to diffraction in the hkl planes 001 and 002 of kaolinite (0.723 and 0.355 nm), together with the absence of reflections in the interval between 1.00 and 1.40 nm in the Mg samples, glycolation, K- and heat (25 to 350 °C) treatments, apparently indicate that kaolinite is the only clay mineral present. However, heating of the potassium sample to 550 °C, apart from resulting in the disappearance of the reflection
Table 4. Parameters d (interlayer distance), WHH (width at half height) and reflection area of
kaolinite and 2:1 minerals (smectites/vermiculites) of horizons A or B of the studied soil profiles, based on diffractograms of the clay fraction saturated with magnesium
Profile Mineral d WHH Area
nm °2θ
Toposequence I
Profile 1 2:1 1.41 0.98 117.32
Kaolinite 0.73 0.89 658.88
Profile 2 2:1 1.36 1.00 52.73
Kaolinite 0.73 0.99 575.15
Profile 3 2:1 1.38 0.75 25.40
Kaolinite 0.73 1.06 217.97
Profile 4 2:1 - -
-Kaolinite 0.73 0.96 721.33
Toposequence II
Profile 5 Kaolinite2:1 - -
-0.74 1.08 330.85
Profile 6 2:1 - -
-Kaolinite 0.74 1.20 470.91
Profile 7 Kaolinite2:1 - -
-0.74 1.18 470.50
Profile 8 2:1 - -
-Kaolinite 0.74 1.24 250.64
Toposequence III
Profile 9 2:1 1.57 1.15 135.49
Kaolinite 0.76 1.04 1037.13
Profile 10 2:1 1.59 1.38 1964.43
Kaolinite 0.73 0.81 439.23
Profile 11 2:1 - -
-Kaolinite 0.73 0.95 439.23
Profile 12 Kaolinite2:1 1.44 0.93 444.57
0.73 0.86 1570.09
of kaolinite (at 0.723 nm), generated a broad and asymmetric reflection with an average position around 1.005 nm, indicating that 2:1 expandable minerals, with hydroxy-Al polymers, are also present. An explanation for the lack of definition of the reflections around 1.40 nm in the Mg-saturated sample read at room temperature is that the filling of the interlayer spaces with polymers by these phyllosilicates is most likely irregular, behaving as an interstratified mineral of the mica-smectite or mica-chlorite type. On the other hand, in almost all samples of these profiles, the reflections of the assumed kaolinite are broad and strongly asymmetrical; this pattern may indicate the presence of interstratified minerals, possibly of the kaolinite-smectite type, in association with kaolinite. The presence of interstratified kaolinite-smectite in basalt-derived Nitossolos and Latossolos in southern Brazil was recently confirmed based on the analysis of crystallographic parameters and identification techniques of interstratified minerals using software Newmod (Testoni et al., 2017).
The mineralogical composition of the samples of profiles of this toposequence is therefore little compatible with the activity values of the calculated clay fraction (Table 3). This may be due to the following main reasons: the profiles with highest clay activity in the B horizon, in descending order, are P3 (33 cmolc kg
-1
), P4 (16.4 cmolc kg -1
), P2 (14.3 cmolc kg
-1), and P1 (5.28 cmol c kg
-1). In P3, the presence of 2:1 layer clay
minerals was not clearly evident, except after the heat treatment at 550 °C; in P1, with the lowest activity, the amount of these minerals was highest, although they are 2:1 minerals with a high amount of hydroxyl-Al, which may reduce the CEC drastically in relation to their pure counterparts. Thus, the hypothesis is plausible that the CEC of most of these soils is, in some way, due to the participation of 1:1-2:1 interstratified minerals in association with kaolinite.
Toposequence 2
Toposequence 2 is located at altitudes slightly lower than toposequence 1 (Table 1), with higher temperatures and higher evapotranspiration. The valley in which the profiles were collected is more closed, forming narrow ledges, which favors intense colluvial deposition, described mainly in profiles 6 and 7 (Chernossolo and Argissolo, respectively, Typic Argiudoll). All profiles have a reddish-brown color, reflecting the comparatively warmer climate than of toposequence 1 (Table 2). The values of sum and base saturation, clay fraction activity, and pH were higher than in toposequence 1, in addition to the absence or low quantity of exchangeable Al, resulting in the formation of chemically more fertile soils, even in profile 5 (Nitossolo Vermelho - Humic Rhodic Eutrudox) located in the interfluve position (Tables 2 and 3). The soil corresponding to profile 8 (Neossolo Litólico - Lithic Udorthents), located at lower altitude than the other soil profiles of this toposequence, and in the lower third of a steep slope (d =35 %), although containing a contribution of colluvial material, is very prone to losses by water erosion, forming constantly renewed soil. In this sense, the limiting factors for an intensive exploitation of the soils of this toposequence are physical, consisting both of the presence of rocks, and the high slope degree, and in the case of profile 8, of the small thickness of the soil profile.
In profile 5 (horizon A), the reflections with larger area and expression occur at d values around 0.72 and 0.36 nm (Figure 3), but they are broad and asymmetrical, possibly indicating kaolinite in association with interstratified kaolinite-smectite, as evidenced by several authors analyzing younger basalt-derived soils (Bühmann and Grubb, 1991; Vingiani et al., 2004; Teske et al., 2013). The presence of goethite is indicated by the reflection at 0.417 nm. A small background rise in the region around 1.405 nm, coupled with dilution of this reflection towards lower 2θ angles after glycolation, indicates a low smectite content in the sample. The confirmation of the expansive character of this mineral is clearest in K-saturated samples heated to higher temperatures, where a reflection around 1.0 nm is very evident. However, after heating to 550 °C with the disappearance of kaolinite reflections, the formation of a plateau in the left portion of the 1.00 nm reflection was observed, attributed to the contribution of interstratified kaolinite-smectite (Wilson and Cradwick, 1972).
The sum of the kaolinite and interstratified kaolinite-smectite, plus the small relative amount of 2:1 minerals observed help to explain why this soil has a clay fraction activity exceeding 20 cmolc kg
-1, but not higher than 27 cmol c kg
-1 (Table 3). If the
reflections at 0.72 nm were interpreted as due only to kaolinite, the small portion of identified 2:1 minerals would not be sufficient to explain why the clay fraction activity is so high, for being much higher than the reference standard for most kaolinites (Singh and Gilkes, 1992).
The mineralogical pattern of profiles 6 and 7 was similar (Figure 3). There is greater asymmetry of the reflection of 0.720 nm in relation to P5, both of the K and Mg treatments. In the Mg-saturated samples, although the reflections of 2:1-layer minerals are not
Figure 3. Diffractograms of the clay fraction of the A or B horizons of profiles of toposequence 2. K 25 °C, K 350 °C, and K 550 °C
indicate, respectively, K-saturated samples heated to the indicated temperatures; Mg and Mg+Et Glycol indicate, respectively, Mg-saturated samples followed by glycolation. Reflection values in nm (nanometers).
400 400 200 200 0 0 200 500 0 400 0 600 400 200 0 0.999 1.005 1.005 1.405 1.405 0.720 0.720 0.417 0.358 0.334 0.358 0.334 Mg
K 25o
K 350o
K 550o
Mg+Et Glicol 0.417 0.486 0.486 0.720 0.720 P5 Hz A
Counts 400 600 200 500 0 0 200 500 1000 0 400 600 0 600 400 200 0 5 10 1.005 1.005 1.422 1.761 0.723 0.723 0.415 0.357 0.357 Mg
K 25o
K 350o
K 550o
Mg+Et Glicol
0.415 0.723
0.723
15 20 25 30
P7 Hz 3Bt Counts 600 600 400 200 200 400 0 0 200 500 1000 0 600 400 0 400 200 0 1.004 0.998 1.343 1.343 1.419 0.719 0.719 0.413 0.358 0.335 0.358 0.335 Mg
K 25o
K 350o
K 550o
Mg+Et Glicol
0.413 0.720
0.720 P6 Hz Bt
Counts 400 200 500 0 0 400 500 0 800 0 400 200 0 5 10 0.989 0.991 0.991 0.990 0.991 1.40 1.725 0.723 0.723
0.416 0.357 0.335 Mg
K 25o
K 350o
K 550o
Mg+Et Glicol
0.723
0.723
15 20 25 30
P8 Hz A Counts
clearly expressed in the diffractograms, there is a slight elevation of the background in the region between 1.30 and 1.40 nm, indicating their presence in small quantities.
In the P6 sample, this elevation dilutes towards the lower 2θ angles after glycolation and in P7, a weak reflection is formed at d ≈1.761 nm, confirming the expansive character of these minerals and the presence of smectites. In K-saturated samples heated to 350 °C, symmetrical reflection occurs around 1.00 nm, indicating minerals with little or no Al in the interlayers. When heated to 550 °C, aside from the disappearance of the kaolinite reflection, a reflection at around 1.00 nm was observed, resulting from polymer dehydroxylation, but maintaining a “plateau” or shoulder toward the lower 2θ angles, indicating non-regular interstratified K-S (kaolinite-smectite) (Wilson and Cradwick, 1972). In the first three profiles of toposequence 2, the mineralogical composition of the clay fraction is therefore similar, with predominance of kaolinite, in association with interstratified K-S. Although smectite could be present, its semi-quantification was not possible, considering the absence of definition of reflections of this mineral (d≈ 1.40 nm) in the Mg samples. In the B horizon of the Chernossolo profile (P6 - Typic Argiudoll), clay activity was high (2Bt2 >40 cmolc kg
-1), while in the subhorizons B of profiles 5 and
7, these values were less than 30 cmolc kg -1
, but still high (Table 3). Therefore, these relatively high CEC values are not compatible with soils with no or very low amounts of 2:1-layer minerals, but are consistent when taking the presence of interstratified K-S in association with kaolinites into account.
In the diffractograms of profile 8 (Neossolo Litólico - Lithic Udorthents) (Figure 3) the broadest and most asymmetric reflections of all studied soils were observed in the kaolinite position (Table 4), indicating a more significant participation of interstratified kaolinite-smectite. In the Mg sample, a weak reflection at d≈ 0.991 nm was also observed, indicating micas or illites, as well as another more intense reflection at d values between 1.30 and 1.40 nm, increasing to d values ≈ 1.725 nm in the treatment with ethylene glycol, confirming the expansive character of this mineral. When smectite peaks do not follow a rational series (absence of reflection 003, at d=5.00 nm, for example), and when the glycolation treatment promotes shifting of the reflections to values above 1.70 nm, as observed, this indicates the presence of interstratified K-S (Bühmann and Grubb, 1991; Righi et al., 1999). This higher content of smectite and interstratified kaolinite-smectite explains, therefore, the high CEC and clay activity values of this soil (Table 3).
Toposequence 3
The soils of toposequence 3 are located at lower altitudes, developing under warmer microclimate conditions and with lower water surplus than those of the previous toposequences (Table 1). The valleys in this region are more open, with medium-sized slopes, but with steep declivity (between 10 and 30 %). In this toposequence, the sequence of descriptions was initiated with the profile of the valley bottom (P9 - Cambissolo Háplico - Dystric Eutrudept), followed by two protruding profiles of the footslope and the middle third of the slope (P10 - Chernossolo Argilúvico and P11 - Cambissolo Háplico - Typic Argiudoll and Dystric Eutrudept, respectively) and finally the interfluve profile (P12 - Nitossolo Vermelho - Humic Eutrudox). All toposequence soils had high values of pH, sum and base saturation, being eutrophic, but with physical restrictions to intensive agricultural use, due to the accentuated slopes, as well as the large volume of stones in the soil mass, particularly in profiles 10 and 11.
after glycolation, suggesting smectites. However, a high level was maintained as of this value, a feature which, as already mentioned, indicates the participation of interstratified K-S. Heat treatments at the highest temperatures shifted the reflections from d ≈ 1.50 to 1.00 nm, confirming the expansive property and absence or low number of hydroxyl-Al polymers in the interlayers of the smectite mineral, although their content is very low in these soils. As clay activity was high in both soils (T >40 cmolc kg
-1) (Table 3) and since
a very low quantity of smectite was identified, the high CEC of these soils is possibly due to the expressive participation of interstratified K-S.
In the B horizon of the soil of profile 10 (Chernossolo Argilúvico - Typic Argiudoll), the most intense reflection occurred at d ≈ 1.583 nm in the Mg sample, which shifted to 1.779 nm at the point of greatest sharpness, maintaining a “shoulder” in the direction of the smaller angles. This pattern indicates smectites, the dominant mineral in the clay fraction of this soil, with a probable contribution of interstratified K-S. The presence of this latter mineral is confirmed by the wide and asymmetric reflection at d ≈ 0.719 nm, probably in association with the small amount of kaolinite. The CEC was highest in this soil, resulting in a very high clay activity, compatible, therefore, with the observed mineralogy.
The most intense reflections in the Mg-saturated sample of profile 12 (Nitossolo Vermelho - Humic Eutrudox) occurred at d ≈ 0.722 and 0.358 nm, followed by a less intense reflection around 1.376 nm (Figure 4) that may indicate, respectively, kaolinite and 2:1-layer minerals. There was no change in the position of the 1.40 nm reflections of the Mg-treated compared to the ethylene glycol-solvated samples, so they may
Figure 4. Diffractograms of the clay fraction of the B horizons of profiles of toposequence 3. K 25 °C, K 350 °C, and K 550 °C indicate,
respectively, K-saturated samples heated to the indicated temperatures; Mg and Mg+Et Glycol indicate, respectively, Mg-saturated samples followed by glycolation. Reflection values in nm (nanometers).
1500 1000 500 1000 0 0 1000 1000 20000 2000 0 1000 0 1.005 1.373 1.436 1.637 0.726 0.726 0.416 0.416 0.365 0.365 0.365 0.365 0.334 0.334 Mg
K 25o
K 350o
K 550o
Mg+Et Glicol
0.414
0.410 0.725
0.729 P9 Hz Bi
Counts 1000 1500 500 500 1000 0 0 500 1000 0 1000 2000 0 2000 1000 0 5 10 9.980 1.038 1.534 1.352 1.756 0.728 0.718 0.421 0.357 0.356 0.358 0.362 0.336 0.334 0.333 Mg K25o K350o K550o Mg+Et Glicol 0.726 0.728
15 20 25 30
P11 Hz Bi Counts 4000 3000 2000 1000 2000 1000 3000 0 0 1000 1000 2000 0 3000 2000 0 1500 1000 500 0 0.998 1.327 1.583 1.779 0.719 0.719 0.356 0.356 0.356 0.333 0.356 0.33 Mg
K 25o
K 350o
K 550o
Mg+Et Glicol
0.719
0.719 P10 Hz Bt
Counts 2000 1000 1000 2000 0 0 400 1000 20000 800 600 0 1000 500 0 5 10 1.008 1.412 1.376 1.356 1.443 0.727 0.722 0.416 0.481 0.416 0.417 0.358 0.358 0.335 0.355 0.334 0.356 Mg
K 25o
K 350o
K 550o
Mg+Et Glicol
0.712
0.712
15 20 25 30
P12 Hz Bt2 Counts
o
indicate either smectites or vermiculites with interlayered hydroxy-Al polymers. After the gradual heating of the K-saturated samples, a reflection formation around 1.356 nm at 350 °C was observed and a great dilution of the reflections between 1.00 and 1.40 nm, forming a plateau with an elevated background, which refer to SIHP, and higher-order peaks of non-regular interstratified K-S-type minerals, as previously discussed. The reflections at d ≈ 0.722 nm have a strong asymmetry at lower 2θ angles, albeit to a lesser degree than in the previous profiles. Since there was no change in the position of the reflections in this region due to heating or glycolation treatments, this behavior indicates that the interstratified K-S have hydroxyl-Al polymers in the interlayer spaces, as described by Bühmann and Grubb (1991). Considering these results, the presence of SIHP, together with K-S interstratified with hydroxyl-Al polymers, although occurring in significant quantities, probably contribute little to the increase of CEC in this soil (clay fraction activity in the B2 horizon 14.04 cmolc kg
-1), i.e., compatible with the observed
mineralogy. This Nitossolo Vermelho (Humic Eutrudox) is located in a top elevation position, where vertical water flows are more intense, which probably favors a higher soil weathering degree, and therefore a clay mineralogy differentiated from the other soils. The greater evapotranspiration of the region, conditioning a water balance with a lower volume of surplus water, however, seems to have been favorable for the preservation of a sufficient quantity of bases to maintain the eutrophic character of the soil.
Supposedly, the strong asymmetry in the kaolinite reflections, discussed extensively above and shown in detail in the two soil profiles (Figure 5), indicates the presence of interstratified kaolinite-smectite. Comparing the different diffractograms, particularly the region of kaolinite reflections (between 10 and 14 °2θ), great variation in the width at half height (WHH) of the kaolinites of the different soils was observed. For the kaolinites with higher crystallinity of sandstone-derived Latossolo Vermelho (Figure 5a) used for comparison, the reflection in plane 001 is symmetric, (WHH = 0.38 °2θ). However, for the case of the two studied soils, less or more accentuated asymmetries were observed (Figure 5b and 5c, respectively), with far higher WHH values when calculated from the “medium” reflection shape. In the samples with more asymmetrical reflections, the WHH values were 0.96 and 1.24 °2θ, respectively, for Nitossolo Vermelho and Neossolo Litólico. These values are much higher than those generally cited for kaolinites in the literature and in comparison to the sample used as a reference (Figure 5). When the three diffractograms are insertedsimultaneously for comparison (Figure 5d), the differences in the reflection pattern of the supposed kaolinite appear with greater clarity. This pattern, although already mentioned as indicating the presence of interstratified K-S in many environments, in particular in basalt-derived soils (Bühmann and Grubb, 1991; Vingiani et al., 2004), is often ignored during interpretation, and will require more attention in the future.
The evolution degree of the soils of the third toposequence is the lowest of the three, possibly due to the lower water surplus in this region, favored by the higher temperatures in the far west of Santa Catarina, increasing potential evapotranspiration. The active elements of the climate, notably precipitation, evapotranspiration, and temperature, which influence the leaching flows, have a marked influence on the mineralogical composition and consequently on the chemical fertility of the soils. These conditions are responsible for the formation and persistence of larger amounts of smectite and interstratified K-S, as well as greater preservation of bases in the soils of this toposequence.
between the mineralogical composition and soil fertility of toposequences 1 and 2, both situated in the Peixe River valley, within a distance of a little over 45 m in a straight line. Fifty percent of the soils of the former are dystrophic (P1 and P2), while the latter are all eutrophic, with higher values of sum (S) and base saturation (V) (Table 3). The soils of the second toposequence are situated closer to the Uruguay river channel, where average temperatures are higher, thus favoring a lower amount of surplus water in the soils.
The relief, on the other hand, is also a conditioning factor of the water flows. Long, soft slopes generally favor internal vertical water flows; on the other hand, steep slopes stimulate horizontal flows, mainly those on the surface, favoring erosive processes that lead to the formation of shallower soils, such as the Neossolo Litólico (Lithic Udorthents) of toposequence 2 and Cambissolos (Inceptisols) of the other toposequences.
CONCLUSIONS
In all studied soils of the three toposequences, the mineralogical composition in the clay fraction was similar, with predominance of minerals with main reflections in the kaolinite position, followed by varying proportions of smectites with or without interlayered hydroxy-Al polymers, goethite and/or hematite and very little or no gibbsite.
The reflections in the kaolinite position are broad and asymmetrical in most samples, indicating that the dominant minerals are composed of a mixture of kaolinite-smectite (K-S) and kaolinite.
The soils situated in toposequences 2 (Ipira) and 3 (Descanso) are more fertile and have a higher clay fraction activity than those of toposequence 1 (Luzerna), incompatible with
Figure 5. Diffractograms of clay fraction samples saturated with Mg showing the differences
between reflections of different “kaolinites”. LVd = Latossolo Vermelho distrófico derived from
sandstone, used as well-ordered kaolinite sample (a); NVe = Nitossolo Vermelho Eutroférrico,
horizon 2Bt (profile 4) (b); RLm = Neossolo Litólico Chernossólico, horizon A, (profile 8) (c);
superimposition of the three samples (d); LMA = width at half height (values expressed in °2θ). Counts
1500
1000
500
o
2θ (Cuκα) Counts
(a)
(c) RLm P8 A
LMA = 1.24 LMA = 0.38
LVd
400
200
5 10 15
Counts
1000
500
Counts (b)
(d)
LMA = 0.38 LVd
LMA = 0.96 NVe
LMA = 1.24 RLm LMA = 0.96 NVe P4 2Bt
1000
0 2000
10 15
15 10
the small amounts of 2:1-layer phyllosilicates identified by XRD and have been interpreted as being due to the contribution of interstratified K-S in association with kaolinites. The clay fraction mineralogy and the chemical fertility of the soils was shown to be related to the climatic variations between the sites of the different toposequences, where the smaller water surpluses in toposequences 2 and 3 were less favorable for leaching and weathering.
REFERENCES
Barnhisel RI, Bertsch PM. Chlorites and hydroxy-interlayered vermiculite and smectite. In: Dixon JB, Weed SB, editors. Minerals in soil environments. 2nd ed. Madison: Soil Science Society of America; 1989. p. 729-88.
Bigarella JJ, Mousinho MK, Silva JZ. Considerações a respeito da evolução das vertentes. Curitiba: Universidade do Paraná; 1965. (Boletim Paranaense de Geografia).
Bortoluzzi EC, Pernes M, Tessier D. Interestratificado caulinita-esmectita em um Argissolo desenvolvido a partir de rocha sedimentar do Sul do Brasil. Rev Bras Cienc Solo. 2007;31:1291-300. https://doi.org/10.1590/S0100-06832007000600008
Brown G, Brindley GW. X-ray diffraction procedures for clay mineral identification. In: Brindley GW, Brown G, editors. Crystal structures of clay minerals and their X-ray identification. London: Mineralogical Society; 1980. p. 305-60.
Bühmann C, Grubb PLC. A kaolin-smectite interstratification sequence from a red and black complex. Clay Miner. 1991;26:343-58. https://doi.org/10.1180/claymin.1991.026.3.04
Castro JC. Coluna white: estratigrafia da Bacia do Paraná no Sul do Estado de Santa Catarina - Brasil. Florianópolis: Secretaria de Estado da Tecnologia, Energia e Meio Ambiente; 1994. (Série textos básicos de geologia e recursos minerais de Santa Catarina).
Claessen MEC, organizador. Manual de métodos de análise de solo. 2. ed. Rio de Janeiro: Embrapa Solos; 1997.
Delvaux B, Herbillon AJ, Vielvoye L, Mestdagh MM. Surface properties and clay mineralogy of hydrated halloysitic soil clays. II: evidence for the presence of halloysite/smectite (H/Sm) mixed-layer clays. Clay Miner. 1990;25:141-60. https://doi.org/10.1180/claymin.1990.025.2.02
Empresa Brasileira de Pesquisa Agropecuária - Embrapa. Solos do Estado de Santa Catarina. Rio de Janeiro: Embrapa Solos; 2004. (Boletim de pesquisa e desenvolvimento, 46).
Empresa de Pesquisa Agropecuária e Extensão Rural de Santa Catarina - Epagri. Síntese anual da agricultura de Santa Catarina 2013-2014 [internet]. Florianópolis, SC: Epagri/Cepa, 2014. [acesso em 28 Jun 2016]. Disponível em: http://docweb.epagri.sc.gov.br/website_cepa/ publicacoes/Sintese_2014.pdf.
Kämpf N, Azevedo AC, Costa Junior MI. Estrutura básica de argilominerais 2:1 com hidróxi-Al entrecamadas em Latossolos Bruno do Rio Grande do Sul. Rev Bras Cienc Solo. 1995;19:185-90. Kämpf N, Curi N. Formação e evolução do solo (Pedogênese). In: Ker JC, Curi N, Schaefer CEGR, Vidal-Torrado P, editores. Pedologia - Fundamentos. Viçosa, MG: Sociedade Brasileira de Ciência do Solo; 2012. p. 207-302.
Ledru M-P. Late quaternary environmental and climatic changes in Central Brazil. Quaternary Res. 1993;39:90-8. https://doi.org/10.1006/qres.1993.1011
Leinz V, Amaral SE. Geologia geral. 4. ed. São Paulo: Nacional; 1969.
Melo VF, Schaefer CEGR, Singh B, Novais RF, Fontes MPF. Propriedades químicas e cristalográficas da caulinita e dos óxidos de ferro em sedimentos do Grupo Barreiras no município de Aracruz, estado do Espírito Santo. Rev Bras Cienc Solo. 2002;26:53-64. https://doi.org/10.1590/S0100-06832002000100006
Nakata H, Coelho MA. Geografia geral. 2a ed. São Paulo: Moderna; 1986.
Pedron FA, Azevedo AC, Dalmolin RSD. Alteração mineralógica de Neossolos em uma climo-litossequência no Planalto do Rio Grande do Sul. Cienc Rural. 2012;42:451-8. https://doi.org/10.1590/S0103-84782012000300011
Potter RO, Carvalho AP, Flores CA, Bognola I. Levantamento de reconhecimento de solos do estado de Santa Catarina. Rio de Janeiro: EMBRAPA; 1998. (EMBRAPA-CNPS. Boletim de Pesquisa; n. 6).
Righi D, Terribile F, Petit S. Pedogenic formation of kaolinite-smectite mixed layers in a soil toposequence developed from basaltic parent material in Sardinia (Italy). Clay Clay Miner. 1999;47:505-14. https://doi.org/10.1346/CCMN.1999.0470413
Ryan PC, Huertas FJ. The temporal evolution of Fe-smectite to Fe-kaolin via interstratified kaolin-smectite in a moist tropical soil chronosequence. Geoderma. 2009;151:1-15. https://doi.org/10.1016/j.geoderma.2009.03.010
Sacco FG. Configurações atmosféricas em eventos de estiagem de 2001 a 2006 na mesorregião Oeste Catarinense [dissertação]. Florianópolis: Universidade Federal de Santa Catarina; 2010. Santa Catarina. Secretaria de Estado do Planejamento. Diretoria de Estatística e Cartografia. Atlas geográfico de Santa Catarina: diversidade da natureza. Florianópolis: Editora da Udesc; 2014. Fascículo 2.
Santos HG, Jacomine PKT, Anjos LHC, Oliveira VA, Oliveira JB, Coelho MR, Lumbreras JF, Cunha TJF. Sistema brasileiro de classificação de solos. 3. ed. rev. ampl. Rio de Janeiro: Embrapa Solos; 2013. Santos RD, Lemos RC, Santos HG, Ker JC, Anjos LHC. Manual de descrição e coleta de solo no campo. 5. ed rev ampl. Viçosa, MG: Sociedade Brasileira de Ciência do Solo; 2005.
Singh B, Gilkes RJ. Properties and distribution of iron oxides and their association with minor elements in the soils of south-western Australia. J Soil Sci. 1992;43:77-98. https://doi.org/10.1111/j.1365-2389.1992.tb00121.x
Soil Survey Staff. Keys to soil taxonomy. 12th ed. Washington, DC: United States Department of Agriculture, Natural Resources Conservation Service; 2014.
Środoń J. Identification and quantitative analysis of clay minerals. In: Bergaya F, Theng BKG, Lagaly G, editors. Handbook of clay science. Amsterdam: Elsevier; 2006. v1. p. 765-87. Tedesco MJ, Gianello C, Bissani CA, Bohnen H, Volkweiss SJ. Análises de solo, plantas e outros materiais. 2. ed. Porto Alegre: Universidade Federal do Rio Grande do Sul; 1995. (Boletim técnico, 5). Teske R, Almeida JA, Hoffer A, Lunardi Neto A. Caracterização mineralógica dos solos derivados de rochas efusivas no Planalto Sul de Santa Catarina, Brasil. Rev Cienc Agrovet. 2013;12:187-98.
Testoni SA, Almeida JA, Silva L, Andrade GRP. Clay mineralogy of Brazilian Oxisols with shrinkage properties. Rev Bras Cienc Solo. 2017;41:e0160487. https://doi.org/10.1590/18069657rbcs20160487
Vingiani S, Righi O, Petit S, Terribile F. Mixed-layer kaolinite-smectite minerals in a red-black soil sequence from basalt in Sardinia (Italy). Clay Clay Miner. 2004;52:473-83. https://doi.org/10.1346/CCMN.2004.0520408
Whittig LD, Allardice WR. X-ray diffraction techniques. In: Klute A, editor. Methods of soil analysis. Physical and mineralogical methods. 2nd ed. Madison: American Society of Agronomy; 1986. Pt 1. p. 331-62.