ABSTRACT
RESUMO
Uniformidade de distribuição de calda no dossel do feijoeiro,
utilizando análise espectrofotométrica
A ocorrência de doenças é um fator de influência na produtividade do feijoeiro. O mofo-branco está entre as principais doenças promovidas por patógenos de solo. O objetivo deste trabalho foi quantificar a distribuição de líquido pulverizado no dossel da planta do feijoeiro, a partir de análise espectrofotométrica, usando-se um pulverizador de barra, com e sem assistência de ar. Foi montado um experimento em esquema fatorial 2 x 2 x 2 (dois tipos de pontas, duas taxas de aplicação e assistência de ar ligada e desligada), em delineamento de blocos ao acaso, com quatro repetições. A assistência de ar na barra interferiu na deposição da calda no feijoeiro e houve aumento significativo na produtividade, quando se aumentou a taxa de aplicação e quando a assistência de ar na barra porta-bicos estava ligada.
Palavras-chave: Qualidade de aplicação e pulverização, produtos fitossanitários
Recebido para publicação em agosto de 2008 e aprovado em março de 2011
1 Part of the doctoral thesis submitted by first author to UFV. Work funded by the National Council for Scientific and Technological Development (CNPq).
2 Agronomist, Doctor. Departamento de Engenharia, Universidade Federal Rural do Rio de Janeiro, BR 465, km7, s/n, 23890-000, Seropédica, Rio de Janeiro, Brazil.. baesso@ufrrj.br
Corresponding author.
3 Agronomist, Doctor. Departamento de Engenharia Agrícola, Universidade Federal Viçosa, Av. Peter Henry Rolfs, s/n, 36570-000, Viçosa, Minas Gerais, Brazil.mauri@ufv.br 4 Agronomist, Doctor. Empresa de Pesquisa Agropecuária de Minas Gerais, Av. Peter Henry Rolfs, s/n, 36570-000, Viçosa, Minas Gerais, Brazil. rfvieira@epamig.br,
trazilbo@epamig.br
5 Agronomist, Doctor. Departamento de Informática, Universidade Federal Viçosa, Av. Peter Henry Rolfs, s/n, 36570-000, Viçosa, Minas Gerais, Brazil. cecon@dpi.ufv.br Murilo Mesquita Baesso*2; Mauri Martins Teixeira3; Rogério Faria Vieira4; Trazilbo José de Paula Junior4;
Paulo Roberto Cecon5
Fungal diseases are important factors limiting common bean yield. White mold is one of the main diseases caused by soil pathogens. The objective of this study was to quantify the distribution of a fungicide solution sprayed into the canopy of bean plants by spectrophotometry, using a boom sprayer with and without air assistance. The experiment was arranged in a 2 x 2 x 2 factorial (two types of nozzles, two application rates, and air assistance on and off) randomized block design with four replications. Air assistance influenced the deposition of solution on the bean plant and yield increased significantly with the increased rate of application and air assistance in the boom sprayer.
Key words: Quality of application and spraying, pesticides,
INTRODUCTION
Some years ago, the common bean (Phaseolus vulgaris
L.) was considered to be a subsistence crop, but because of the advancements in technology and crop research, it is now grown as a cash crop by large scale commercial farmers, (Rinaldi, 2008).
White mold is one of the most destructive diseases of common bean in the world, especially when cultivated in areas of mild temperatures and high soil and air moisture. In fields with history of white mold, some measures must be taken for an integrated management of pests and diseases. This strategy aims to obtain quality products, reducing and even eliminating the use of pesticides. Chemical control by foliar fungicide application is among the management measures that reduce the effects on the crop, or even prevent the entry of white mold in the field.
Pesticides are used in modern agriculture to protect the crops from pests, diseases and weeds (Zhao et al., 2005). The authors state that increased deposition of the solution on the target can be achieved by using port nozzles with air assistance. However, this technique has some restrictions, because it depends on the plant size and wind speed ratio.
The chemical control of diseases is carried out in most farms (Teixeira et al., 2008) to prevent infections caused by pathogens and provides fast results. Nevertheless, there is the need to avoid selection pressure, which often occurs when fungicides from the same chemical class are applied consecutively over several crop cycles. Pesticide rotation is recommended to manage pest resistance.
The proper use of pesticides for the control of plant diseases requires knowledge of many factors such as the causative agent involved and its potential as a pathogen, the equipment used for product application, number of applications, application timing, droplet size, volume of solution, etc..
Air-assisted spraying began to be used in the 1950s and since then the technology has evolved. Initially, in tree crops, manual sprayers were used with air guns, but required large amount of solution (Fox et al., 2008). The same authors commented that recently, the use of sprayers with more efficient fans and producing large volumes of air has led to very good results. In pesticide application, the effective control of pests requires an efficient transport of active ingredients into the canopy of plants (Farooq & Landers, 2004).
Tractor-driven sprayers with air assistance have one or two fans, usually of axial flow, positioned near the central section of the spray bar that distribute a high volume of air in an inflated duct mounted above the spray bar (Matthews, 2000).
Sprayers with downward air assistance have been used to increase the penetration of droplets into plant canopies
and reduce drift during spraying (Cooke et al. 1990; Taylor & Andersen, 1991). This method has, however, some limitations, especially in relation to plant height, wind speed and droplet size.
One of the techniques used to measure spray deposits of plant protection products in plant canopies is the addition of tracers to the spray solution, whose concentration will be measured by spectrometric analysis. According to Skoog et al. (2002), this analysis determines the absorption of electromagnetic waves, with lengths between 160 and 3000 nm, using a tungsten light source powered by a stabilized source, which generates constant radiation intensity. After diffraction, the radiation passes through the sample container and reaches a photoelectric cell. Then, the generated electrical signal is amplified and a transducer feed the meter. The meter can be calibrated to read transmittance or absorbance.
Yates & Akesson (1963) tested fluorescent tracers in quantitative analysis. They concluded that tracer solutions must be sensitive to detection; enable the use in quantitative analysis, rapidly; be soluble when mixed with the solution, with minimal physical effect on spraying and less droplet evaporation; have distinct properties to be differentiated from other substances and be stable, nontoxic and inexpensive. The first reports on the use of food dyes as tracers of spray solution date from the 1990s (Marchi et al., 2005).
Derksen & Sanderson (1996) evaluated the influence of the spray application rate on leaf deposition of plant protection products, using a tracer with the solution. They found that the application of large volumes of solution provided better coverage and less variation in deposition throughout the canopy, however, the current trend of pesticide application is to decrease volume, which reduces the risk of environmental contamination and improves the operational capacity.
The bright blue food dye was added to the spray solution to analyze the volumes deposited on leaves of the upper, middle and lower parts of cotton plants (Souza
et al., 2007a). The tracer solution consisted of 0.179% bright blue (FD&C Blue No. 1) and 0.179% Saturn Yellow dissolved in 0.015%Vixilperse as described by Palladini (2000). After spraying, the leaves were washed and the volume recovered was analyzed by spectrophotometry. Different deposition volumes were identified in the different parts of the plant.
Hayden et al. (1990) compared two natural target conditions and two water-soluble food dyes classified by “Food, Drug and Cosmetic” as FD&C No. 6 and FD&C No. 1, with wavelength readings in the distinct bands 482 and 630 nm, respectively. The dyes were shown accurate and inexpensive for research use on solution deposition on plants.
Souza et al. (2007b) investigated the variation in tracer deposits, simulating post-emergence herbicide application on populations of Brachiaria plantaginea (Link) Hitchc and Commelina benghalensis L. infesting a soybean crop. A total of 250 L ha-1 of solution prepared with 0.18%
bright blue dye and 0.18% Saturn yellow was applied. They found that plants of B. plantaginea, between the soybean lines, received on average 34% more deposition than plants on the line.
The effect of the adjuvant Aterbane added to spray solutions prepared with FD&C Blue No. 1 (1500 mg/L) on the spray deposition on Pistia stratiotes was evaluated (Martins et al., 2005). The amount of dye in the samples was measured with a GBC Cintra 20 spectrophotometer and the absorbances were read at 630 nm, thereby determining the concentration of the dye retained on the leaf surface.
Raetano et al. (2001) compared the coverage provided by different sprayers using a tracer solution consisting of bright blue dye (FD&C No. 1) at the concentration of 0.075% (w/v) and fluorescent Saturn yellow (0.075%) dissolved with lignin sulphonate Vixilperse (0.0075%).
Bauer & Raetano (2003) evaluated the spray deposition on dry beans using sprayers with and without air assistance. The use of copper oxide as a tracer, different types of nozzles and volumes of solution showed that the air assistance in the boom sprayer did not increase deposition on bean leaflets 48 days after emergence. Larger application volumes increased deposition over the whole plant, and the deposition on upper and lower leaflets was similar.
Costa et al. (2007) evaluated the effect of spray nozzles, pressure and wind speed on drift from simulated pre-emergence herbicide applications. The spray solution consisted of water and the food dye FD&C Blue No. 1 was used as tracer. Drift was sampled by active collectors fixed on the spray boom and the tracer was used successfully to evaluate herbicide drift.
This work aimed to quantify and evaluate the distribution of liquid sprayed on the plant canopy, and analyze the efficiency of fungicide applied by hydraulic spray nozzle with air assistance on white mold control.
MATERIALS AND METHODS
The experiment was carried out in a field cultivated with common bean (Phaseolus vulgaris L.), cv. Carioca Pérola, under pivot irrigation, at the developmental stage
R6 (flowering: opening of the first flowers defines the R6 stage, which lasts until the corolla of the first fertilized flower has fallen, exposing the first pod in early development), in the Agro-Reservas Farm of Brazil, located in the municipality of Unai, Minas Gerais. The trial was performed with a Jacto Falcon Vortex air-assist axial fan sprayer, with a 600 L tank, coupled to a Valtra BM 100 tractor with 73.5 kW (100 hp) engine power.
The contact fungicide Frowncide 500 SC was used at the rate of 750 g ha-1 of the active ingredient (fluazinam).
Two spray volumes were used: 200 and 400 L ha-1.
The incidence and severity of white mold and crop yield were evaluated. White mold incidence was assessed by the percentage of plants showing disease symptoms, and severity was evaluated by a grading scale from 1 to 9 used by Vieira et al. (2001) and adapted from Hall & Phillips (1996) (Table 1).
The experiment was arranged in a 2 x 2 x 2 factorial: types of nozzles, spray volumes and air assistance on and off, in a randomized block design with four replications, with blocks and plots spaced 15 m apart to avoid drift between them.
Drift was evaluated during the application of the tracer on the bean plants, using artificial targets, water-sensitive cards, following Wolf & Frohberg (2002). The cards were placed at one meter in height outside the target area of application, 5, 10 and 15 m from the plot edges, in the direction of the wind. After application, the points of impact on each card (26 x 76 mm) were recorded, which was indicative of drift intensity in each treatment.
The area of the experimental unit was of 15 m2 (5 x 3 m).
The hydraulic spray nozzles used during the trials were: Jacto JA-4, hollow cone [working at a pressure of 413.4 kPa (60 lbf/pol2), at flow rate of 1.25 L/min]; and Jacto
AXI-110-04, flat fan nozzle tip [working at a pressure of 206.7 kPa (30 lbf/pol2, a flow rate of 1.06 L/min]. During the trial, the
spacing between the nozzles was 0.5 m and the height of the boom was 0.5 m for the manifold nozzles and 0.3 m for the conical nozzle. The sprayer speed was measured and adjusted to keep the solution application rate at 200 L ha-1
or 400 L ha-1. The fan shaft speed was 219.9 rad/s (2100
rpm), using a Tako TD 303 digital tachometer. The
Table 1. Grading scale for assessing the severity of white mold in common bean.
Score Characteristic
1 All plants without symptoms of disease
3 1 to 25%
5 26 to 50%
7 51 to 75%
9 76 to 100%
Source: Vieira et al. (2001), adapted from Hall & Phillips (1996).
Most plants showing symptoms with part (%) of stems and branches
manometers were calibrated using a standard pressure gauge to obtain the ratio between the pressure indicated and actual pressure. The temperature and relative humidity were monitored using a psychrometer.
After harvesting, the moisture content of harvested beans was determined and adjusted to 12% (wb). All measurements were made using a 0.001 g digital scale. Data were subjected to analysis of variance and the means compared by the Tukey’s test at 5% probability.
Spray deposition on bean plants was evaluated by applying the solution with 3 g L-1 blue FCF dye as tracer
(FD&C Blue No. 1; Food, Drug & Cosmetic). To avoid interference of the tracer in the absorbance read by the spectrophotometer, the standard solutions were made with the mixture collected from the spray tank before application. Leaves were collected from the upper, middle, and lower third of plants. Five leaves were collected from each part, one at each cardinal point and one in the center, totaling 15 leaves per plant. Three plants were analyzed per plot. After each spraying, leaves were removed, placed in plastic containers and washed with 100 mL of distilled water. The containers were sealed and agitated for 30 s. The solution resulting from the extraction was analyzed in a SPlabor SP-1105 spectrophotometer to measure the absorbance at 630 nm (detection range of the blue dye). This analysis determines the absorption of electromagnetic waves, using a tungsten light source powered by a stabilized source, which generates constant radiation intensity. After diffraction, the radiation passes through the sample container and reaches a photoelectric cell. Then, the generated electrical signal is amplified and a transducer feed the meter. The meter can be calibrated to read transmittance or absorbance. Leaf area was measured by scanning and analysisusing the software Image Tool version 3.0.
The absorbance data were converted into concentration (mg L-1) using the calibration curve obtained
from the standard solutions; the initial concentration of the solution and the volume of sample dilution were used to calculate the volume retained in the target. With these results, the volume of total deposition retained in the target area was divided by the leaf removal area, thus obtaining the amount in µL cm-2 leaf.
The data were submitted to variance analysis and means compared by Tukey test at 5% probability.
RESULTS AND DISCUSSION
Uniformity of liquid distribution on bean canopy
Upper third of the bean plant
In the upper third part of the plant, the air assistance in the boom of the sprayer, the application rate, the nozzle type and interaction between air assistance and
application rate influenced the spray deposition on the leaves (Table 2).
The best results were obtained when the air assistance was on and the application rate was 400 L ha-1, obtaining
deposition of 0.74 µL cm-2 leaf (Table 3). This result can be
caused by a better transport dynamics of droplets to the plant canopy compared with the sprayer without air assistance (Matthews, 2000).
The best results were obtained with the flat fan nozzle tips (Table 4), probably because the conical tip produces droplets of smaller diameter, easily transported by the air, and consequently, providing higher penetration into the canopy. Thus, the volume retained in the upper third tends to decrease.
Middle third of the bean plant
In the middle third of the bean plant, no significance was found for the interactions or for the nozzle type, which also did not influence the spray deposition on the leaves of the middle third of the plant, regardless of air assistance in the boom being on or off (Table 2). This result is similar to that reported by Bauer & Raetano (2003), who found no increase in deposition on bean leaflets, 48 days after emergence, using different nozzles and spray volumes with air assistance in the boom of the sprayer.
The air assistance in the boom of the sprayer and the higher application rate increased significantly the amount of solution retained by the leaves in the middle third of the bean plants (Table 5).
Lower third of the bean plant
Similarly to the results obtained in the upper third of the bean plants; in the lower third, both the air injection and the application rate were significant, however, the interaction between these factors was also significant (Table 2).
The best results were obtained when the air assistance was on and the application rate was 400 L ha-1, obtaining
deposition of 0.28 µL cm-2 leaf (Table 6). This improvement
in the deposition probably occurred due to the transport dynamics of droplets to the plant canopy. This increase in the volume retained by the lower bean leaves may be of great importance, since white mold can start proliferation in leaves near the soil. These results are similar to those obtained by Souza et al. (2007b), who studied the volume of solution deposited on the leaves of the upper, middle and lower parts of the cotton plant, using the bright blue food dye added to the spray solution.
influence of spray volume on the leaf deposition of pesticides. The authors found that the application of large volumes resulted in better coverage and lower variations of deposition on the canopy. They discussed that larger volumes allow a redistribution of the product, due to the top-to-bottom flow of liquid, with higher deposition on the lower parts and, thus, more uniform deposition. However, this type of application poses higher risk of soil contamination, if there is non-retention of the product on the leaves.
Evaluation of bean yield
The incidence of white mold in the experimental area was around 25%, with low severity, according to the scale used by Vieira et al. (2001), adapted from Hall & Phillips (1996) (Table 2).
The influence of air assistance in the spray boom, the application rate and type of nozzle were significant. The interaction between air and volume was also significant (Table 7), therefore only the interaction must be studied. The mean bean yield increased significantly with the use of the flat fan nozzle tip, thereby providing a better white mold control (Table 8).
There was a significant increase in yield, both with increased application rate and air assistance in the boom (Table 9). Yield increased from 2.51 to 2.82 Mg ha-1 when
the air assistance in the nozzle bar was on and the application volume was 200 L ha-1.
In general, primary infections caused by white mold begin in the presence of free water and exogenous energy source, usually senescent flower petals fallen on the floor or retained on the plants. Thus, for an efficient control of this fungus, it is necessary to increase the retained volume, the density and coverage of droplets in the middle and, especially, lower parts of the target. As a rule, in this study, both the increased application rate and the air assistance in the boom provided better spray penetration into the canopy of common bean.
Table 6. Mean volume of solution on leaves (µL cm-2) in the
lower third of common bean plants
Air assistance
On Off
200 0.21Ba 0.14Bb
400 0.28Aa 0.25Ab
* Means followed by same capital letter in the columns and small letters in the lines are not significantly different at 5% probability level by the Tukey test.
Volume (L ha-1)
Table 3. Mean volume of solution on leaves (µL cm-2) of the
upper third of common bean plants
Volume (L ha-1) Air Assistance
On Off
200 0.45Ba 0.37Bb
400 0.74Aa 0.61Ab
* * Means followed by same capital letter in columns and small letters in the lines are not significantly different at 5% probability by the Tukey’s test.
Table 5. Mean volume of solution (µL cm-2) for air assistance in
the spray boom and spray volume
Air assistance Volume of solution on leaves (µµµµµL cm-2)
On 0.47a
Off 0.40b
Volume (L ha-1) Volume of solution on leaves (µµµµµL cm-2)
200 0.35b
400 0.53a
* Means followed by same letter in the columns for each factor are not significantly different at 5% probability level by the F test.
Table 4. Mean volume of solution on leaves (µL cm-2) in the
upper third of common bean plants for the different types of nozzle tips
Type of nozzle tip Spray deposition on leaves (µµµµµL cm-2)
Conical 0.52b
Flat fan 0.55a
* Means followed by same letter in the column are not significantly different at 5% probability level by the F test.
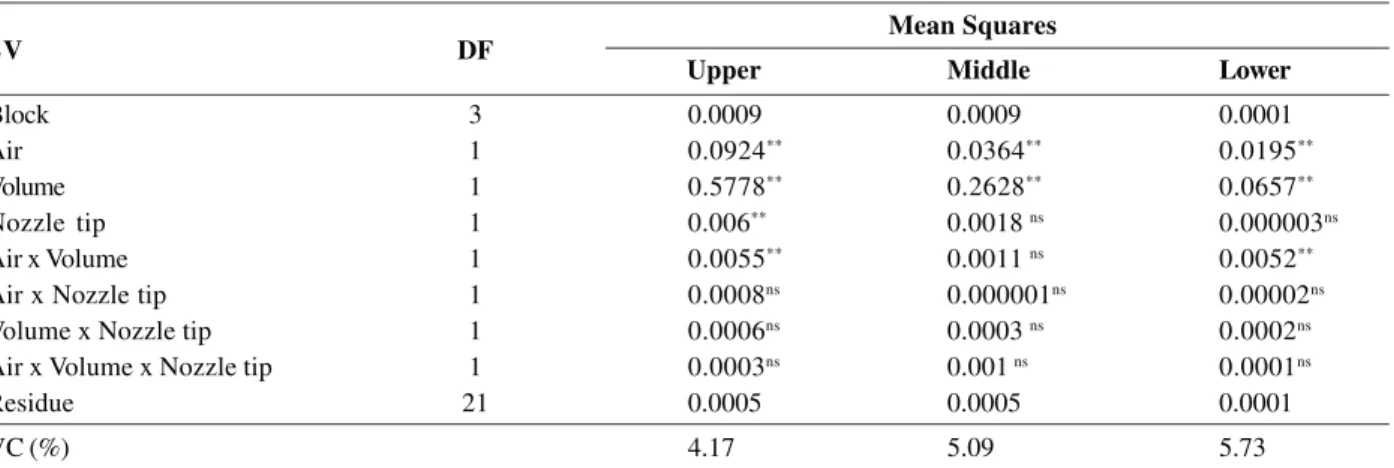
Table 2. Summary of analysis of variance of volume retained on upper, middle and lower leaves of common bean, for two types of nozzles, volumes of application and air assistance in the spray boom
Mean Squares
Upper Middle Lower
Block 3 0.0009 0.0009 0.0001
Air 1 0.0924** 0.0364** 0.0195**
Volume 1 0.5778** 0.2628** 0.0657**
Nozzle tip 1 0.006** 0.0018 ns 0.000003ns
Air x Volume 1 0.0055** 0.0011 ns 0.0052**
Air x Nozzle tip 1 0.0008ns 0.000001ns 0.00002ns
Volume x Nozzle tip 1 0.0006ns 0.0003 ns 0.0002ns
Air x Volume x Nozzle tip 1 0.0003ns 0.001 ns 0.0001ns
Residue 21 0.0005 0.0005 0.0001
VC (%) 4.17 5.09 5.73
ns Non significant at 5% probability level; ** Significant at 1% probability level; and * Significant at 5% probability.
CONCLUSIONS
The flat fan nozzle tip and the conical tip had the same performance in relation to spray deposition on bean plants.
Yield increased with air assisted spraying and application rate of 200 L ha-1.
Both the increased application rate and the air assisted spraying provided better penetration into common bean canopy.
REFERENCES
Bauer FC & Raetano CG (2003) Assistência de ar em barra de pulverização e a deposição da calda em feijoeiro. Scientia Agrí-cola, 60:211-215.
Table 8. Mean yield of common bean in megagram per hectare, for different types of nozzles
Type of nozzle tip Common bean yield (Mg ha-1)
Conical 2.74b
Flat fan 2.77a
* Means followed by same letter in the column are not significantly different at 5% probability by the F test.
Table 9. Mean yield of common bean in megagram per hectare, for the interaction between air assistance in the spray boom and volumes of application
Yield
Volume (L ha-1) Air assistance
On Off
200 2.82Ba 2.51Bb
400 2.92Aa 2.78Ab
* Means followed by same capital letter in the columns and small letters in the lines, are not significantly different at 5% probability by the Tukey’s test.
Table 7. Summary of analysis of variance of common bean yield for two types of nozzle, volumes of application and and air assistance in the spray boom
SV DF MS
Block 3 0.8212
Air 1 110.2613**
Volume 1 75.645**
Nozzle tip 1 2.88*
Air x Volume 1 15.125**
Air x Nozzle tip 1 0.005ns
Volume x Nozzle tip 1 0.2112ns
Air x Volume x Nozzle tip 1 0.1512 ns
Residue 21 0.5745
VC (%) 1.64
ns Non significant at 5% probability level, ** Significant at 1%
probability level, and * Significant at 5% probability level.
Carbonari CA, Martins D, Marchi SR & Cardoso LR (2005) Efei-to de surfatantes e pontas de pulverização na deposição de calda de pulverização em plantas de grama-seda. Planta Daninha, 23:725-729.
Cooke BK, Hislop EC, Herrington PJ, Western NM & Humpherson JF (1990). Air-assisted spraying of arable crops in relation to deposition, drift and pesticide performance. Crop Protection, 9:303-311.
Costa AGF, Velini ED, Negrisoli E, Carbonari CA, Rossi CVS, Corrêa MR & Silva FML (2007) Efeito da intensidade do ven-to, da pressão e de pontas de pulverização na deriva de aplica-ções de herbicidas em pré-emergência. Planta Daninha, 25:203-2 1 0 .
Derksen RC & Sanderson JP (1996) Volume, speed and distribution technique effects on poinsentia foliar deposits. Transactions of the ASAE 39:5-9.
Farooq M & Landers AJ (2004) Interactive effects of air, liquid and canopies on spray patterns of axial-flow sprayers. In: Annual International Meeting Sponsored, Michigan. Anais, ASAE/CSAE. p.12.
Fox RD, Derksen RC, Zhu H, Brazee RD & Svensson SA (2008) A history of air-blast sprayer development and future prospects. Transactions of the ASAE 51:405-410.
Hayden J, Ayers G, Grafius E (1990). Two watersoluble optically resolvable dyes for comparing pesticide spray distribution. Journal of Economic Entomology, 83:2411-2413.
Marchi SR, Martins D, Costa NV, Terra MA & Negrisoli E (2005) Degradação luminosa e retenção foliar dos corantes azul bri-lhante FDC-1 e amarelo tartrasina FDC-5 utilizados como traçadores em pulverizações. Planta Daninha, 23:287-294.
Martins D, Terra MA, Carbonari CA, Negrisoli E, Cardoso LR & Tofoli GR (2005) Efeito de diferentes concentrações de aterbane na deposição de calda em plantas de pistia stratiotes. Planta Daninha, 23:343-348.
Matthews GA (2000) Pesticide application methods. 1a ed. Malden,
Blackwell Science. 432 p.
Palladini LA (2000) Metodologia para avaliação da deposição em pulverizações. Tese de Doutorado. Universidade Estadual Paulista, Botucatu, 150p.
Raetano CG, Scudeler F, Bauer FC, Venegas F & Vinchi RR (2001) Avaliação da cobertura de pulverização com diferentes equipa-mentos e condições operacionais na cultura do café. In: Simpósio Internacional de Tecnologia de Aplicação de Defensivo Agríco-las: Eficiência, Economia e Preservação da Saúde Humana e do Ambiente, Jundiaí, Anais, FEPAF. p.2-6.
Rinaldi PCN (2008) Influência da profundidade de adubação e da velocidade de uma semeadora de plantio direto na cultura do feijão. Dissertação de Mestrado. Universidade Federal de Viço-sa, ViçoViço-sa, 65p.
Skoog AD, Holler FJ & Nieman TA (2002) Princípios de análise
instrumental. 5a ed. Porto Alegre, Bookman. 835p.
Souza RT, Castro RD & Palladini LA (2007b) Depósito de pulve-rização com diferentes padrões de gotas em aplicações na cultu-ra do algodoeiro. Engenharia Agrícola, 27:75-82.
Souza RT, Velini ED & Palladini LA (2007a) Aspectos metodológicos para análise de depósitos de pulverizações pela determinação dos depósitos pontuais. Planta Daninha, 25:195-202.
Teixeira, MM; Ruas, RA; Baesso, MM; Magno Junior, RG (2008) Controle da qualidade de aplicação de produtos fitossanitários nas propriedades agrícolas. Engenharia na Agricultura. Boletim Técnico, n. 11, p. 29.
Vieira RF, Paula Junior TJ, Peres AP & Machado JC (2001) Fungicidas aplicados via água de irrigação no controle do mofo-branco no feijoeiro e incidência do patógeno na semente. Fitopatologia Brasileira, 26:770-773.
Wolf RE, Frohberg DD (2002). Comparison of drift for four drift-reducing flat-fan nozzle types measured in a wind tunnel and evaluated using dropletscan software. St. Joseph, Michigan: ASAE, 7p. (ASAE Paper n.02-1101).
Yates W.E & Akesson NB (1963) Fluorescent tracers for quantitative microresidue analyses. Transactions of the ASAE, 6:105-114.