Rev. Caatinga
SOIL PHYSICAL ATTRIBUTES AND YIELD OF WINTER COMMON BEAN
CROP UNDER A NO
-
TILL SYSTEM IN THE BRAZILIAN CERRADO
1MARIA CECÍLIA CAVALLINI DA SILVA2, MARCELO ANDREOTTI2, NÍDIA RAQUEL COSTA3*, CÉSAR
GUSTAVO DA ROCHA LIMA4, CRISTIANO MAGALHÃES PARIZ5
ABSTRACT – Knowledge of the interactions between soil physical properties and yield performance in agricultural crops is very important for the adoption of appropriate management practices. This study aimed to
evaluate the linear and spatial correlations between some soil physical attributes, straw production in the palisade grass (Urochloa brizantha), and grain yield of winter common bean in succession to the grass under an
irrigated no-till system in an Oxisol Haplorthox in the Cerrado lowlands region of Brazil. The plant attributes determined were dry matter yield of U. brizantha (DMY), and grain yield (GY) and final plant population (PP) of winter common bean. The soil physical attributes, evaluated at 0.0-0.10 m and 0.10-0.20 m, were soil bulk density (BD), macroporosity (MA), microporosity (MI), total porosity (TP), penetration resistance (PR), gravimetric water content (GW), and volumetric water content (VW). A geostatistical grid with 124 sampling points was installed to collect the soil and plant data in an area of 4000 m2. The remaining straw amount of palisade grass exhibited an inverse linear correlation with bean yield and bean plant population when the bean was cultivated in succession. However, no spatial correlations were observed among the attributes. The common bean yield had a direct linear correlation with gravimetric water content in the 0.10-0.20 m soil layer.
From a spatial point of view, winter bean yield showed a strong dependence on the distribution of the volumetric water content in the 0-0.10 m soil layer.
Keywords: Geostatistics. Soil physics. Phaseolusvulgaris. Urochloa brizantha. Brazilian Cerrado lowlands.
ATRIBUTOS FÍSICOS DO SOLO E PRODUTIVIDADE DO FEIJOEIRO DE INVERNO SOB PLANTIO DIRETO NO CERRADO
RESUMO – O conhecimento das interações entre os atributos físicos do solo e o desempenho produtivo das culturas agrícolas é de suma importância para a adoção de práticas de manejo adequadas. Deste modo, o presente estudo objetivou avaliar as correlações lineares e espaciais entre alguns atributos físicos do solo com a
produção de palhada do capim-marandu (Urochloa brizantha) e a produtividade de grãos do feijoeiro de inverno cultivado em sucessão ao capim sob sistema plantio direto na região de Cerrado de baixa altitude, em
condições irrigadas em um Latossolo Vermelho distroférrico. Os atributos das plantas foram: a produtividade de matéria seca (PMS) para a Urochloa brizantha, e para o feijoeiro a produtividade de grãos (PRO) e a população de plantas (PP). Os atributos físicos do solo avaliados nas camadas de 0,0–0,10 m e 0,10-0,20 m de profundidade foram: a densidade do solo (DS), macroporosidade (MA), microporosidade (MI), porosidade total (PT), resistência à penetração (RP), umidade gravimétrica (UG) e umidade volumétrica (UV). Para coleta dos dados foi instalada uma rede amostral contendo 124 pontos, em uma área de 4000 m2. A palhada remanescente do capim-marandu apresentou correlação linear inversa com os atributos do feijoeiro de inverno (população de plantas e a produtividade de grãos). Entretanto, sem correlação espacial sobre tais atributos. A produtividade de feijão teve correlação linear direta com a umidade gravimétrica do solo na camada de 0,10-0,20 m. Do ponto de vista espacial, a produtividade do feijoeiro de inverno apresentou forte dependência com a distribuição da umidade volumétrica na camada de 0-0,10m.
Palavras-chave: Geoestatística. Física do solo. Phaseolus vulgaris. Urochloa brizantha. Cerrado de baixa altitude.
_____________________ *Corresponding author
1Received for publication in 03/15/2016; accepted in 07/20/2016. Paper extracted from the doctoral thesis of the first author.
2Department of Soil Science, Universidade Estadual Paulista, Ilha Solteira, SP, Brazil; [email protected], [email protected]. 3Department of Crop Science, Universidade Estadual Paulista, Botucatu, SP, Brazil; [email protected].
INTRODUCTION
The common bean (Phaseolus vulgaris) can be grown virtually throughout the year in different regions of Brazil, provided there are no water and temperature limitations. Improvements in cultivation practices, coupled with the development of new cultivars and the adoption of new technologies, have permitted significant grain yield increases from a national average of 500 kg ha-1 in 1970, to more than
1000 kg ha-1 currently (CONAB, 2015).
In recent years there has been much interest in finding more sustainable production systems than those in common use, and no-till systems (NTS) have proven to be excellent alternatives in tropical regions (KLUTHCOUSKI et al., 2000). Thus, many
forage species are used either in rotation or intercropped with grain crops, in order to provide
feed in the off-season and/or mulch to the soil (straw) for subsequent crop coverage. The forage grasses of the genus Urochloa have often been used in this context, especially Urochloa brizantha
(Hochst. Ex A. Rich.) RD Webster „Marandu‟, also known as Brachiaria brizantha (Hochst. Ex A. Rich.) Stapf.
There are many advantages to using forage straw in NTS, including decreased soil temperature, improved infiltration and water retention, increased biological activity in the soil, increased aggregation and preservation of soil structure, improved cycling
and increased nutrients in the soil, and greater erosion control (MARCHÃO et al., 2007; MACHADO; ASSIS, 2010; COSTA et al., 2015).
The species of Urochloa have shown excellent results under Brazilian Cerrado lowland
conditions, with dry matter production exceeding 15 t ha-1, and with the effectiveness of straw ground
cover lasting more than six months owing to its high C/N ratio (KLUTHCOUSKI; AIDAR; COBUCCI, 2007; COSTA et al., 2014). Common bean residues have a low C/N ratio, so it becomes necessary to introduce forage grasses in rotation to improve the C/ N ratio in the NTS.
Some soil physical factors are especially important when assessing the response of crops to a
specific management strategy, including soil water content, the aeration system and water storage, and mechanical impediments to root development. Thus, knowledge of variation in soil attributes can help
managers optimize and improve agricultural productivity (CARVALHO et al., 2006).
In this context, a geostatistical method can be used as a tool for assessing the spatial variability of
soil and plant attributes through a simple semivariogram and kriging technique. This approach
is suitable for analyzing those attributes whose variability has a certain degree of organization expressed by spatial dependence.
In Brazil, the geostatistical study of soil physical attributes related to common bean
productivity has increased with the expansion of
precision agriculture (FREDDI et al., 2005; CARVALHO et al., 2006; MARTINS et al., 2009;
MONTANARI et al., 2010). However, more studies are needed under NTS in tropical regions such as the Brazilian Cerrado lowlands in order to increase the sustainability of cropping systems.
Because soil physical attributes have an important influence on the development of cash crops and their management, this study aimed to evaluate the linear and spatial correlations between soil physical attributes, the dry matter productivity of palisade grass, and the productivity of winter bean grains in succession to the grass under a NTS in the Brazilian Cerrado lowlands.
MATERIAL AND METHODS
Our experiment was conducted in 2007 in Selvíria in the State of Mato Grosso do Sul, Brazil (20°18′S, 51°22′W, elevation 370 m), at a site belonging to the University of Engineering, Campus of Ilha Solteira (SP) – UNESP. According to the Koppen climate classification system, the climate in the study region is classified as Aw, which is a tropical and humid climate with a rainy summer season and a dry winter. Irrigation was performed when necessary throughout the experimental period using center-pivot sprinklers. The climate data collected were consistent with the historical averages for the region, which has a mean annual rainfall of 1370 mm, a mean temperature of 23.5°C, and a relative humidity (RH%) of 70-80%.
The soil in the study region is classified as a typic Oxisol Haplorthox (EMBRAPA, 2013), with a smooth slope to 2.5%. The particle size, analyzed
from the surface to 0.30 m, was 660, 120, and 220 g kg-1 clay, silt, and sand, respectively, which
makes it a very clayey.
The study site had been previously cultivated in crop rotation under a no-till system with annual crops and semi-evergreens with corn in the off-season (Zea mays) (2004), soybeans (Glycine
max) (2004/2005), sorghum (Sorghum bicolor) (2005), dwarf pigeon pea (Cajanus cajan) (2006), and U. brizantha „Marandu‟ (2007). The previous crop was composed of Urochloa species in the summer, the straw from which was subsequently utilized during common bean sowing.
Before initiating the experiment, the soil
chemical characteristics were evaluated at 0.0-0.10 m and 0.10-0.20 m depth, according to the
methods of Raij et al. (2001) and Embrapa (1997). These assessments were carried out before the sowing of U. brizantha „Marandu‟ on 11/15/2006 and after desiccation on 05/20/2007, in advance of the winter common bean sowing (Table 1).
Rev. Caatinga
glyphosate [isopropylamine salt of N-(phosphonomethyl) glycine] (1.44 g acid-equivalent ha-1) at a spray volume of
200 L ha-1 on 01/15/2007. The palisade grass was
sown using a no-till drill on 01/26/2007. The row spacing used was 0.17 m, approximately to 7 kg ha-1
of seed (pure live seed = 76%).
Table 1. Soil chemical and physical analysis before and after Urochloa brizantha desiccation.
(a)Chemical attributes: P = available phosphorus, SOM = soil organic matter, pH = soil pH, K+ = potassium, Ca+2 = calcium, MG+2 = magnesium, H+Al = potential acidity, CEC = cation exchange capacity, BS = base saturation, (b)Physical attributes: BD = soil bulk density, MA = macroporosity, MI = microporosity, TP = total porosity.
The plants were cultivated for 46 days and harvested (03/12/2007) with the aid of a mechanical shredder (Triton) to a height of approximately 0.25 m in relation to the soil surface. This management aimed to stimulate tillering and simulating a cut homogenization without removal of material from the area, leaving the remaining straw on the soil surface. Fifty-two days after this mechanical harvest, the plants were dried (05/02/2007) with glyphosate (1.44 g acid-equivalent ha-1).
After the palisade grass was dried, the common bean crop (cultivar IAC Carioca) was sown
on 05/30/2007 using a no-till drill with a density of 15 seeds m-1 and a row spacing of 0.45 m. The
fungicide carboxin (5,6-dihydro-2-methyl-1,4 -oxathiin-3-carboxamide) + thiram (tetramethylthiuram disulfide) was applied to the bean seeds at a dose of 60 g of active ingredient (a.i.) per 100 kg of seeds. The basic fertilization in the sowing furrows consisted of 20 kg ha-1 N, 70 kg ha-1
P2O5, and 40 kg ha-1 K2O in an 08-28-16 formula. The topdressing fertilization on 07/04/2007 was
between the common bean rows without incorporation (70 kg ha-1 of N as urea, 45% N).
For implementation of the geostatistical grid, the x and y directions of the Cartesian coordinate
system were defined between two agricultural terraces at the sowing of the winter bean crop. The
large rectangular experimental grid with a total area of 4000 m2 (100 m × 40 m) was made up of five rows and ten columns, and it contained 44 sampling points, with 10 m × 10 m spacing between the points. The points were allocated randomly within the large grid, sub-mesh of refinement for spacing conditions between distances less than 10 m. Each sub-grid was positioned between four points of the large grid and consisted of a central point and four additional points
along the Cartesian axes and in the middle between each pair of spacings with 5 m and 1.67 m between them, totaling 124 points.
The soil physical properties and the plant attributes were determined at each point of the experimental grid: in proximity to each point we took two types of samples (a deformed and an undeformed) at depths of 0-0.10 and 0.10-0.20 m on 15 and 05/16/2007. For each of these samples we determined the following attributes: soil bulk density (BD), determined by the volumetric ring method (kg dm-3); macroporosity (MA) and microporosity
(MI), determined by the tension table method (m3 m-3); total porosity (TP), defined as the sum of
macro and microporosity; and gravimetric water content (GW), determined from the relationship between the mass of the water contained in a soil sample and the mass of the soil sample after drying (kg kg-1). The determinations followed the methods
contained in Embrapa (1997).
The volumetric water content (VW) was obtained by the following expression (KIEHL, 1979):
VW = GW * BD (1)
where: VW is the volumetric water content (m3 m-3), WG is the gravimetric water content
(kg kg-1), and BD is the soil bulk density (kg dm-3).
Penetration resistance (PR) was obtained with an impact penetrometer (STOLF, 1991), and was calculated using the formula of Carvalho et al. (2006):
PR = {5.581 + 6.891 * [N/(P - A)*10]} * 0.0981 (2)
where: PR is the penetration resistance of soil
(MPa), N is the number of impacts made with the Depth
Chemical attributes(a) Physical attributes(b)
P SOM pH K+ Ca+2 Mg+2 H+Al CEC BS BD MA MI TP
mg dm-3 g dm-3 CaCl2 ---mmolc dm-3--- % kg dm-3 ---m3 m-3---
Be
fo
re
0-0.10 m 12.5 18.0 5.1 3.2 19 11 22.2 55.5 60 1.314 0.147 0.334 0.481
0.10-0.20 m 6.7 14.1 4.6 1.9 10 6 25.5 43.4 41 1.487 0.078 0.345 0.425
Afte
r 0-0.10 m 23.5 29.5 5.2 3.2 39 17 30.1 89.8 66 1.432 0.099 0.343 0.442
0.10-0.20 m 12.2 22.2 4.7 1.3 21 10 42.1 75.1 44 1.484 0.080 0.346 0.426
penetrometer hammer to obtain the reading, and A and P are the readings before (A) and after (P) the impacts (cm).
The attribute determined for U. brizantha was the dry matter yield (DMY) in kg ha-1, sampled on
05/02/2007. The values were based on all the plants collected at the sampling point with the aid of a metal square (1 m × 1 m), and 0.05 m of the soil surface was used as a reference to determine the residual dry matter (straw). A representative sample was dried using forced-air circulation at 65°C for 72
hours to determine the DMY, and the resulting values were extrapolated into kilograms per hectare
(kg ha-1).
The winter bean attribute, grain yield (GY), was measured at the end of its cycle (09/13/2007) and was adjusted to 13% moisture. The values were calculated from all the plants included within four rows at the sampling point, which had a width of 1 m
and a total area of 1.80 m2. The grain yield measurements were converted to kg ha-1. The plant
population of common bean (PP) at the time of harvest was also calculated by counting all plants in the same 1.80 m2 area, and converting to plants per hectare.
The initial descriptive analysis of the variables studied was done by classical statistics
using SAS (SCHLOTZHAVER; LITTEL, 1997). We also analyzed the frequency distribution of these attributes.
A Pearson correlation matrix was set up to determine the simple linear correlations for the two-by-two combinations of all attributes studied (soil and plant). Together to study the soil depths, we performed a linear regression analysis between the dependent variables of the plant and independent of the soil, aiming to select those that, in appropriate cases, would provide the greatest relationship between cause and effect. We also performed multiple regression tests between the dependent variables, depending on the soil attributes. For both we used the computer packages Excel and SAS.
For each attribute, we calculated the spatial dependence of the simple semivariogram using Gamma Design Software GS+ 7.0 (ROBERTSON, 2004). We applied the polynomial refinement technique (DALCHIAVON et al., 2011) to those attributes that exhibited trends. Subsequently, in order to evaluate the spatial dependence of the attributes studied, we tested the crossed semivariogram using the attributes of the plants
versus the soil.
Adjustments to the semivariograms (simple and crossed) were initially made by calculating: a) the lowest sum of squares of deviations (SSD); b) the highest coefficient of spatial determination (r2); and c) the largest spatial dependence evaluator (SDE). The interpretation proposed for the SDE was the
following: a) SDE ≤ 25% indicates weak spatial variable dependence; b) 25% < SDE ≤ 75% indicates
moderate spatial variable dependence; and c) SDE > 75% indicates strong spatial variable dependence. The final decision model representing
the adjustment was given through cross-validation, and the number of neighbors that generated the best kriging and/or cokriging was determined.
RESULTS AND DISCUSSION
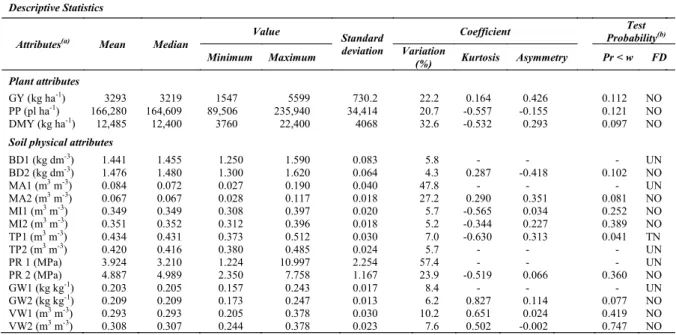
The GY and PP of common bean, as well as the DMY of U. brizantha, showed high variation coefficients (VC): 22.2%, 20.7%, and 32.6%, respectively (Table 2) (PIMENTEL-GOMES; GARCIA, 2002). The GY variability was similar to the values obtained by Montanari et al. (2010) and Dalchiavon et al. (2011) in an Oxisol Haplorthox under no-till (21.1% and 20.3%, respectively).
The soil physical properties showed low variability for BD, MI, TP, GW, and VW; high variability for MA2 and PR2; and very high variability for MA1 (Table 2). The low VC values
observed for most of the physical attributes studied were consistent with the data reported by Souza et al. (2001) and Montanari et al. (2010) in evaluating BD, as well as the data reported by Megda et al. (2008) and Cavallini et al. (2010) in evaluating MI, TP, and GW in no-till systems. This low variability can be attributed, among other factors, to the time since the no-tillage system was adopted in the experimental
area (around about 5 years), which tends to homogenize the surface layers because of the reduction in mechanical operations and soil movement. With respect to macroporosity, the high variability of this attribute may be the result of the aggressive fasciculated root system of U. brizantha, 60% of which, according to Santos et al. (2007), is concentrated in the superficial layers (0-0.10 m), thereby increasing the number of pores through root decomposition.
PR1 and PR2 showed higher and high variability, respectively (Table 2). The ideal condition of soil moisture for collecting the PR data
must be between field capacity and at least 1/3 less than field capacity, as conceptualized by Kiehl (1979). In practical terms, this usually occurs when the soil present on the VW in the microporosity values between 0.330 and 0.220 m3 m-3. The present
data were therefore collected within the proper range, since the average values of VW1 and VW2 were 0.293 and 0.308 m3 m-3, respectively. However,
Rev. Caatinga
Table 2. Initial descriptive statistical analysis of grain yield and plant population of winter bean plants, dry matter yield of
Urochloa brizantha, and physical attributes of the studied Oxisol Haplorthox.
(a)Attributes: GY = grain yield of winter common bean, PP = plant population of common bean, DMY = dry matter
yield of Urochloa brizantha, BD = soil bulk density, MA = macroporosity, MI = microporosity, TP = total porosity, PR = penetration resistance, GW = gravimetric water content, VW = volumetric water content; attributes followed by
1 or 2 refer respectively to depths of 0-0.10 m and 0.10-0.20 m; (b)FD: frequency distribution, NO = normal type, LN
= lognormal, TN = tending towards normal, and UN = undetermined.
When a statistical variable has a normal distribution, the most appropriate measure to represent it is the average. However, if this is not the
case, the median can be used (ROSA FILHO et al., 2009). Thus, we noted in Table 2 that the mean value
of 3293 kg ha-1 for GY was higher than the
2594 kg ha-1 value observed by Freddi et al. (2005)
with the cultivar IAC Carioca Eté, also in an Oxisol Haplorthox under a NTS in irrigated condition in the Selvíria/MS region. However, our value resembled the GY 3044 kg ha-1 value obtained by Dalchiavon et
al. (2011) in similar soil and climatic conditions, and both values are higher than the Brazilian national average of 1284 kg ha-1 (CONAB, 2015).
The average PP of 166,280 plants ha-1 was
lower than the desired standard of about 200,000 plants ha-1. This result is due to the effect of
the large amount of palisade grass straw that interfered with the process of sowing, preventing the
seeds from having ideal contact with the soil for germination. The DMY values for palisade grass (12,485 kg ha-1) had good straw productivity for
maintenance of the NTS, since Bayer et al. (2000)
suggest adding an additional 10,000 to 12,000 kg ha-1 per year of dry matter.
The BD values observed (BD1 = 1.455 kg dm-3 and BD2 = 1.476 kg dm-3)
demonstrated compaction of the surface and subsurface (Table 2). These BD values were below
the critical levels indicated by Kiehl (1979) – approximately 1.70 kg dm-3 – that are capable of
affecting plant growth. However, in a review
conducted by Reichert et al. (2009), it was suggested that values above 1.21 kg dm-3 could restrict root
elongation of plants, and values between 1.36 and 1.68 kg dm-3 could negatively affect both growth and
grain yield in tropical clayey soils. It is important to
note that the values obtained for BD did not negatively affect crop productivity, given the high
yields that were obtained. Normally in a no-till system, the BD values observed, which are close to the critical levels mentioned above, would be due to the machinery and implements traffic, tillage limited to line of culture, and time of system implantation (COSTA et al., 2015). Montanari et al. (2010), in a study of common bean crops in a NTS in an Oxisol Haplorthox (clayey with 620 g kg-1 of clay) in the
Cerrado lowlands, under the same soil and climatic conditions of this study, found average BD values (BD1 = 1.362 kg dm-3 and BD2 = 1.413 kg dm-3)
similar to those observed in the present research. The MA values (MA1 = 0.072 m3 m-3 and
MA2 = 0.064 m3 m-3), showed values considered
critical to proper plant development. According to Kiehl (1979), these minimum values should be about
0.100 m3 m-3. In proper soil management for
conservation purposes, Spera et al. (2009) stated that increasing the number of macropores is especially important, and MA values below 0.100 m3 m-3 can
become critical, limiting root growth in cash crops. However, according to Lanzanova et al. (2007), values below 0.100 m3 m-3, as obtained in this
research (Table 2), do not interfere in crop production, in order that these were obtained since
Descriptive Statistics
Attributes(a) Mean Median Value Standard
deviation
Coefficient Test
Probability(b)
Minimum Maximum Variation
(%) Kurtosis Asymmetry Pr < w FD
Plant attributes
GY (kg ha-1) 3293 3219 1547 5599 730.2 22.2 0.164 0.426 0.112 NO PP (pl ha-1) 166,280 164,609 89,506 235,940 34,414 20.7 -0.557 -0.155 0.121 NO DMY (kg ha-1) 12,485 12,400 3760 22,400 4068 32.6 -0.532 0.293 0.097 NO
Soil physical attributes
BD1 (kg dm-3) 1.441 1.455 1.250 1.590 0.083 5.8 - - - UN
BD2 (kg dm-3) 1.476 1.480 1.300 1.620 0.064 4.3 0.287 -0.418 0.102 NO
MA1 (m3 m-3) 0.084 0.072 0.027 0.190 0.040 47.8 - - - UN
MA2 (m3 m-3) 0.067 0.067 0.028 0.117 0.018 27.2 0.290 0.351 0.081 NO MI1 (m3 m-3) 0.349 0.349 0.308 0.397 0.020 5.7 -0.565 0.034 0.252 NO MI2 (m3 m-3) 0.351 0.352 0.312 0.396 0.018 5.2 -0.344 0.227 0.389 NO TP1 (m3 m-3) 0.434 0.431 0.373 0.512 0.030 7.0 -0.630 0.313 0.041 TN
TP2 (m3 m-3) 0.420 0.416 0.380 0.485 0.024 5.7 - - - UN
PR 1 (MPa) 3.924 3.210 1.224 10.997 2.254 57.4 - - - UN
PR 2 (MPa) 4.887 4.989 2.350 7.758 1.167 23.9 -0.519 0.066 0.360 NO
GW1 (kg kg-1) 0.203 0.205 0.157 0.243 0.017 8.4 - - - UN
GW2 (kg kg-1) 0.209 0.209 0.173 0.247 0.013 6.2 0.827 0.114 0.077 NO VW1 (m3 m-3) 0.293 0.293 0.205 0.378 0.030 10.2 0.651 0.024 0.419 NO VW2 (m3 m-3) 0.308 0.307 0.244 0.378 0.023 7.6 0.502 -0.002 0.747 NO
they still result in high productivity levels. Thus, for tropical soils in irrigated cropping systems, this limit of 0.100 m3 m-3 may not be a true limiting value in
agricultural production, provided the crops are well managed (COSTA et al., 2015).
The values shown in Table 2 for PR1 (3.210 MPa) and PR2 (4.887 MPa) can be considered high because, according to Beutler et al.
(2001), mechanical resistance to penetration becomes restrictive to root growth in cash crops
when these values are greater than 1.5-3.0 MPa, with water content close to field capacity. This shows that in no-till systems, due to reduced tillage, surface
compression and MA reduction are common. However, under the specific conditions found in our research, there was no damage to crop yields.
The correlation between GY vs DMY (r = -0.236**) and PP vs DMY (r = -0.330**) were
negative, suggesting that where DMY was higher,
GY and PP were lower (Table 3). This may be related to the large amount of remaining U. brizantha
straw in the soil, which would have hampered the sowing process and prevented further germination of bean, leading to lower bean plant populations that provided less GY in the areas with the highest straw quantities (Table 2).
Table 3. Linear correlation matrix between winter bean grain yield, dry matter yield of Urochloa brizantha, and physical attributes of the studied Oxisol Haplorthox.
(a)Attributes: GY = grain yield of winter common bean, PP = plant population of common bean, DMY = dry matter
yield of Urochloa brizantha, BD = soil bulk density, MA = macroporosity, MI = microporosity, TP = total porosity, PR = penetration resistance, GW = gravimetric water content, VW = volumetric water content; attributes followed
by 1 or 2 refer respectively to depths of 0-0.10 m and 0.10-0.20 m; ** = significant at 1%, * = significant at 5%, ns =
non-significant.
The inverse correlation between GY and DMY can be directly related to the observed effect of PP on DMY. The DMY of U. brizantha, despite adding straw to the system, produced significant changes in the mass/volume of the soil in the initial characterization (Table 1), with a respective increase in density and a reduction in macroporosity at 0-0.10 m depth. It is noteworthy that despite these possible effects on the physical characteristics of the soils and
the soil chemistry, all other attributes showed improvements.
From the practical point of view of soil management for common bean production in a NTS,
the observed correlations (Table 3) that deserve attention were between GY vs GW2 (r = 0.215*), PP
vs GW1 (r = 0.312**), and PP vs GW2 (r = 0.248*). All indicate a positive relationship between cause and effect. These results agree with those of Silva et al. (2011), who found significant correlations between common bean yield attributes in a no-till
system and soil gravimetric water content. Thus, increasing the GW indicates better conditions in the study area for the increase of GY and PP. Therefore, the GY to present a direct linear correlation with GW2, when there is maximum GW2 (0.247 kg kg-1)
entail a maximum GY estimated 3758 kg kg-1.
Because common bean is an annual crop, its water requirements must be carefully considered since they directly affect productivity. Based on these inferences, we calculated the best regression models that represent the interaction between the attributes of the plants vs soil. The best models that represented these correlations were:
GY = 7.740*102 + 1.208*104*GW2
(n = 124; r = 0.215; p ≤ 0.05) (3)
PP = -7.517*105 + 8.704*106 – 2.046*107*GW1 (n = 124; r2 = 0.158; p ≤ 0.01) (4)
Attr.(a) Correlation coefficient
(b)
GY PP DMY BD1 BD2 MA1 MA2 MI1 MI2 TP1 TP2 PR1 PR2 GW1 GW2
PP 0.229* DMY -0.236** -0.330**
BD1 0.125ns -0.012ns -0.059ns BD2 -0.048ns 0.065ns -0.222* MA1 -0.188* 0.080ns 0.054ns -0.811** MA2 -0.137ns -0.086ns 0.201* - -0.593**
Rev. Caatinga
PP = 5.669*105*GW27.959*10¹
(n = 124; r = 0.226; p ≤ 0.05) (5) where: GY = grain yield of winter common bean (kg ha-1), PP = plant population (pl ha-1), and
GW1 and GW2 = gravimetric water content at depths of 0-0.10 m and 0.10-0.20 m, respectively (kg kg-1).
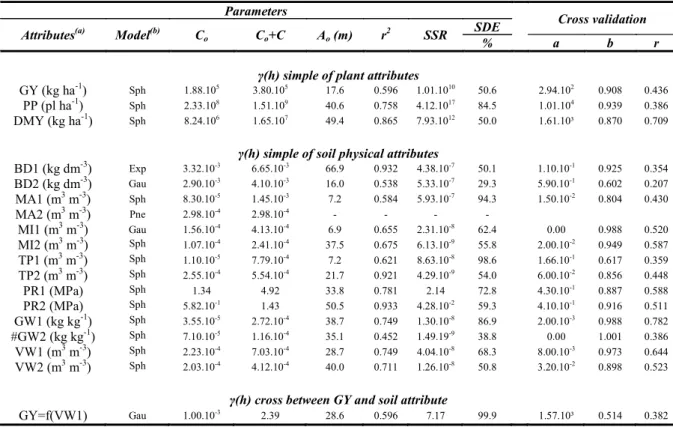
Table 4 shows the parameters of the simple and crossed semivariograms adjusted for the studied attributes. With respect to simple spatial analysis,
except for MA2, all attributes exhibited spatial dependence within the study area, showing appreciable semivariograms. The plant attributes
exhibited a better fit to the spherical model, with ranges from 17.6 m (GY) to 49.4 m (DMY), and SDE values between moderate (GY) and strongly
dependent (PP and DMY). However, the soil attributes presented ranges from 6.9 m (MI1) to 66.9
m (BD1), and the spatial dependence evaluator was moderate to heavily dependent.
Table 4. Parameters of the semivariograms (simple and crossed) fitted for the measured attributes in the studied Oxisol Haplorthox.
(a)Attributes: GY = grain yield of winter common bean, PP = plant population of common bean, DMY = dry matter yield of
Urochloa brizantha, BD = soil bulk density, MA = macroporosity, MI = microporosity, TP = total porosity, PR = penetration resistance, GW = gravimetric water content, VW = volumetric water content; (b)model: Sph: spherical,
Exp = exponential, Pne = pure nugget effect, Gau = Gaussian; SSR = sum of the squared residuals; SDE = spatial dependence evaluator.
The analysis of spatial dependence between the attributes of the plants vs. soil properties (Table 4) revealed a significant correlation only between GY vs VW1. This spatial interaction occurred positively between cause and effect, i.e., it was the same as observed in the linear correlation (Table 3): at the sites where VW was greater, there was an increase in winter bean yield, and vice versa.
It is theoretically possible that water was not a limiting factor in our experiments, because the study area was irrigated whenever necessary throughout crop development. In addition, the palisade grass straw protects the soil surface against
sudden changes in temperature, which consequently reduces the evaporation of water.
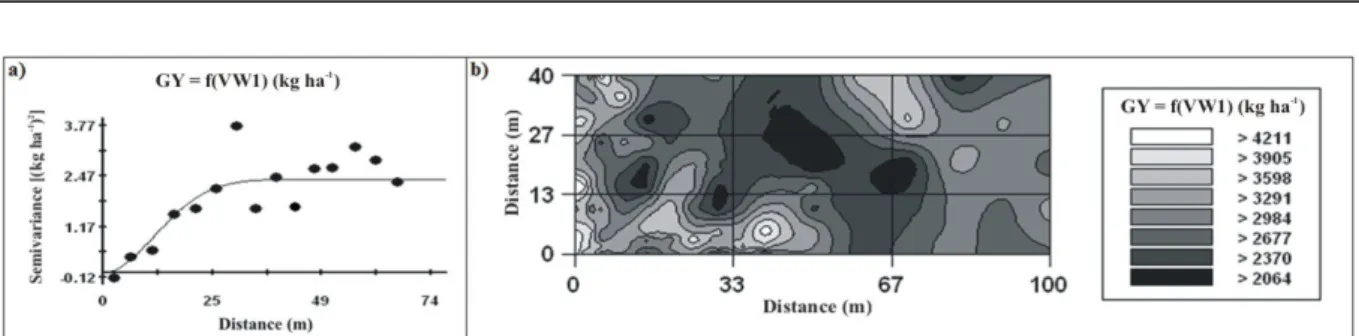
Regarding the cross semivariogram (Table 4), we observed a Gaussian fit with a range of 28.6 m, a spatial determination coefficient of r2 = 0.596, and a SDE strongly dependent. Figure 1 shows the cross semivariogram fit and the cokriging map, both of great agronomic interest for the present study. Therefore, cokriging GY = f(VW1) it was established that the spatial variability of winter bean yield can be determined by the water content at 0-0.10 m depth.
Parameters
Cross validation Attributes(a) Model(b) Co Co+C Ao (m) r2 SSR
SDE
% a b r
γ(h) simple of plant attributes
GY (kg ha-1) Sph 1.88.105
3.80.105
17.6 0.596 1.01.1010
50.6 2.94.102
0.908 0.436
PP (pl ha-1) Sph 2.33.108 1.51.109 40.6 0.758 4.12.1017 84.5 1.01.104 0.939 0.386 DMY (kg ha-1) Sph 8.24.106
1.65.107
49.4 0.865 7.93.1012
50.0 1.61.10³ 0.870 0.709
γ(h) simple of soil physical attributes
BD1 (kg dm-3) Exp 3.32.10-3 6.65.10-3 66.9 0.932 4.38.10-7 50.1 1.10.10-1 0.925 0.354 BD2 (kg dm-3) Gau 2.90.10-3
4.10.10-3
16.0 0.538 5.33.10-7
29.3 5.90.10-1
0.602 0.207
MA1 (m3 m-3) Sph 8.30.10-5
1.45.10-3
7.2 0.584 5.93.10-7
94.3 1.50.10-2
0.804 0.430
MA2 (m3 m-3) Pne 2.98.10-4
2.98.10-4
- - - -
MI1 (m3 m-3) Gau 1.56.10-4
4.13.10-4
6.9 0.655 2.31.10-8
62.4 0.00 0.988 0.520
MI2 (m3 m-3) Sph 1.07.10-4
2.41.10-4
37.5 0.675 6.13.10-9
55.8 2.00.10-2
0.949 0.587
TP1 (m3 m-3) Sph 1.10.10-5
7.79.10-4
7.2 0.621 8.63.10-8
98.6 1.66.10-1
0.617 0.359
TP2 (m3 m-3) Sph 2.55.10-4 5.54.10-4 21.7 0.921 4.29.10-9 54.0 6.00.10-2 0.856 0.448
PR1 (MPa) Sph 1.34 4.92 33.8 0.781 2.14 72.8 4.30.10-1
0.887 0.588
PR2 (MPa) Sph 5.82.10-1
1.43 50.5 0.933 4.28.10-2
59.3 4.10.10-1
0.916 0.511
GW1 (kg kg-1) Sph 3.55.10-5 2.72.10-4 38.7 0.749 1.30.10-8 86.9 2.00.10-3 0.988 0.782 #GW2 (kg kg-1) Sph 7.10.10-5
1.16.10-4
35.1 0.452 1.49.19-9
38.8 0.00 1.001 0.386
VW1 (m3 m-3) Sph 2.23.10-4
7.03.10-4
28.7 0.749 4.04.10-8
68.3 8.00.10-3
0.973 0.644
VW2 (m3 m-3) Sph 2.03.10-4
4.12.10-4
40.0 0.711 1.26.10-8
50.8 3.20.10-2
0.898 0.523
γ(h) cross between GY and soil attribute
GY=f(VW1) Gau 1.00.10-3
Figure 1. Semivariogram (a) and cokriging map (b) of grain yield (GY) as function of volumetric water content (VW1) in an Oxisol Haplorthox.
The analysis of cross spatial dependence (Table 4 and Figure 1) shows that, given bean productivity levels ranging from 2064-2984 kg ha-1
(lower numbers) to 3291-4211 kg ha-1 (higher numbers), levels that are related spatially and
that vary according to the spatial heterogeneity of VW1, there is a real need to work with specific areas and management profiles to reduce the heterogeneity of interaction sites with the lowest GY values, and thus optimize production by increasing productivity.
CONCLUSIONS
The amount of previously cultivated straw remaining in the field showed an inverse linear correlation (but not a spatial correlation) with plant population and grain yield of winter bean. Common bean productivity showed a direct linear correlation with gravimetric water content at 0.10-0.20 m soil depth; from a spatial point of view, winter bean yield showed strong dependence on the distribution of the water content at 0-0.10 m soil depth.
REFERENCES
BAYER, C. et al. Organic matter storage in a sandy clay loam Acrisol affected by tillage a cropping systems in southern Brazil. Soil and Tillage Research, Amsterdam, v. 54, n. 1-2, p. 101-109, 2000.
BEUTLER, A. N. et al. Resistência à penetração, permeabilidade de Latossolo Vermelho distrófico típico sob sistemas de manejo na Região dos Cerrados. Revista Brasileira de Ciência do Solo, Viçosa, v. 25, n. 1, p. 167-77, 2001.
CARVALHO, G. J. et al. Correlação da produtividade do feijão com a resistência à penetração do solo sob plantio direto. Revista Brasileira de Engenharia Agrícola Ambiental, Campina Grande, v. 10, n. 3, p. 765-771, 2006.
CAVALLINI, M. C. et al. Relações entre a produtividade de Brachiaria brizantha e atributos físicos de um Latossolo do Cerrado. Revista
Brasileira de Ciência do Solo. Viçosa, v. 34, n. 4, p. 1007-1015, 2010.
CONAB. Companhia Nacional de Abastecimento. Acompanhamento da safra brasileira de grãos da Safra 2014/15, v. 2, n. 4, Quarto Levantamento: janeiro/2015. Disponível em: <http:// www.conab.gov.br >. Acesso em: 05 mar. 2015.
COSTA, N. R. et al. Adubação nitrogenada em capins do gênero Urochloa implantados em consórcio com a cultura do milho. Revista Brasileira de Ciências Agrárias, Recife, v. 9, n. 3, p. 376-383, 2014.
COSTA, N. R. et al. Atributos do solo e acúmulo de carbono na integração lavoura-pecuária em sistema plantio direto. Revista Brasileira de Ciência do Solo, Viçosa, v. 39, n. 3, p. 852-863, 2015.
DALCHIAVON, F. C. et al. Variabilidade espacial da produtividade do feijoeiro correlacionada com atributos químicos de um Latossolo Vermelho Distroférrico sob sistema de semeadura direta. Bragantia, Campinas, v. 70, n. 4, p. 908-916, 2011.
EMBRAPA. Empresa Brasileira de Pesquisa Agropecuária. Centro Nacional de Pesquisa de Solos. Manual de métodos de análise de solo. 2. ed. Rio de Janeiro: EMBRAPA-CNPS, 1997. 212 p. (Documentos, 1).
EMBRAPA. Empresa Brasileira de Pesquisa Agropecuária. Sistema brasileiro de classificação de solos. 3. ed. Brasília, DF: 2013. 353 p.
FREDDI, O. S. et al. Variabilidade espacial da produtividade do feijão em um Latossolo Vermelho Distroférrico sob preparo convencional e plantio direto. Acta Scientiarum Agronomy, Maringá, v. 27, n. 1, p. 61-67, 2005.
KIEHL, E. J. Manual de edafologia: relações solo-planta. 1. ed. Piracicaba, SP: Agronômica Ceres, 1979. 264 p.
Rev. Caatinga
Agropecuário, Belo Horizonte, v. 28, n. 240, p. 16-29, 2007.
KLUTHCOUSKI, J. et al. Manejo do solo e o rendimento de soja, milho, feijão e arroz em plantio direto. Scientia Agricola, Piracicaba, v. 57, n. 1, p. 97-104, 2000.
LANZANOVA, M. E. et al. Atributos físicos do solo em sistema de integração lavoura pecuária sob plantio direto. Revista Brasileira de Ciência do Solo, Viçosa, v. 31, n. 5, p. 1131-40, 2007.
MACHADO, L. A. Z.; ASSIS, P. G. G. Produção de palha e forragem por espécies anuais e perenes em sucessão à soja. Pesquisa Agropecuária Brasileira, Brasília, v. 45, n. 4, p. 415-422, 2010.
MARCHÃO, R. L. et al. Qualidade física de um Latossolo Vermelho sob sistemas de integração lavoura-pecuária no Cerrado. Pesquisa Agropecuária Brasileira, Brasília, v. 42, n. 6, p. 873-882, 2007.
MARTINS, M. V. et al. Correlação linear e espacial entre a produtividade do feijoeiro e atributos físicos de um Latossolo Vermelho Distroférrico de Selvíria, Estado de Mato Grosso do Sul. Acta Scientiarum Agronomy, Maringá, v. 31, n. 1, p. 147-154, 2009.
MEGDA, M. M. et al. Correlação linear e espacial entre a produtividade de feijão e a porosidade de um Latossolo Vermelho de Selvíria (MS). Revista Brasileira de Ciências do Solo, Viçosa, v. 32, n. 2, p. 781-788, 2008.
MONTANARI, R. et al. Aspectos da produtividade do feijão correlacionados com atributos físicos do solo sob elevado nível tecnológico de manejo. Revista Brasileira de Ciência do Solo, Viçosa, v. 34, n. 6, p. 1811-1822, 2010.
PIMENTEL-GOMES, F. P.; GARCIA, C. H. Estatística aplicada a experimentos agronômicos e florestais. 1. ed. Piracicaba, SP: FEALQ, 2002. 309 p.
RAIJ, B. V. et al. Análise química para avaliação da fertilidade de solos tropicais. Campinas, SP: Instituto Agronômico de Campinas; 2001.285 p.
REICHERT, J. M. et al. Reference bulk density and critical degree-of-compactness for no-till crop production in subtropical highly weathered soils. Soil & Tillage Research. Amsterdan, v. 102, n. 2, p. 242-254, 2009.
ROBERTSON, G. P. GS+: geostatistics for environmental sciences. Plainwell: Michigan, Gamma Desing Software, 2004. 169 p.
ROSA FILHO, G. et al. Variabilidade da produtividade da soja em função de atributos físicos de um Latossolo Vermelho Distroférrico sob plantio direto. Revista Brasileira de Ciência do Solo, Viçosa, v. 33, n. 2, p. 283-293, 2009.
SANTOS, R. S. M. et al. Componentes da parte aérea e raízes de pastagens de Brachiaria spp. em diferentes idades após a reforma, como indicadores de produtividade em ambiente de Cerrado. Pesquisa Agropecuária Tropical, Goiânia, v. 35, n. 2, p. 119-124, 2007.
SANTOS, P. A. et al. Correlação linear e espacial entre o rendimento de grãos do feijoeiro e a resistência mecânica a penetração em um Latossolo Vermelho distrófico. Revista Brasileira de Ciência do Solo, Viçosa, v. 29, n. 2, p. 287-295, 2005.
SCHLOTZHAVER, S. D.; LITTELL, R.C. SAS system for elementary statistical analysis. 2. ed. Cary: SAS. 1997. 441 p.
SILVA, A. L. M. S. et al. Componentes de produção do feijão (Phaseolus vulgaris) correlacionados com atributos físicos de um Latossolo sob plantio direto
em Selvíria-MS. In: SIMPÓSIO DE
GEOESTATÍSTICA APLICADA EM CIÊNCIAS AGRÁRIAS, 2., 2011, Botucatu, Anais... Botucatu, 2011, p.1-6.
SOUZA, Z. M. et al. Variabilidade espacial de atributos físicos em um latossolo vermelho distrófico sob semeadura direta em Selvíria (MS). Revista Brasileira de Ciência do Solo, Viçosa, v. 25, n. 3, p. 699-707, 2001.
SPERA, S. T. et al. Integração lavoura, pecuária, os atributos físicos de solo manejado sob sistema plantio direto. Revista Brasileira de Ciência do Solo, Viçosa, v. 33, n. 1, p. 129-36, 2009.