Volume 2012, Article ID 261736,6pages doi:10.1155/2012/261736
Review Article
Behaviour of Human Erythrocyte Aggregation in Presence of
Autologous Lipoproteins
C. Saldanha,
1J. Loureiro,
2C. Moreira,
3and J. Martins e Silva
41Instituto de Medicina Molecular, Unidade de Biologia Microvascular e Inflamac¸˜ao,
Instituto de Bioqu´ımica Faculdade de Medicina da Universidade de Lisboa. Av Prof. Egas Moniz, 1649-028 Lisboa, Portugal
2Departmento de Cardiologia, Hospital Fernando da Fonseca. IC19, 2720-276 Amadora, Portugal
3Departmento de Medicina I, Faculdade de Medicina da Universidade de Lisboa. Av Prof. Egas Moniz, 1649-028 Lisboa, Portugal
4Instituto de Biopatologia Qu´ımica Faculdade de Medicina da Universidade de Lisboa. Av Prof. Egas Moniz, 1649-028 Lisboa, Portugal
Correspondence should be addressed to C. Saldanha,carlotasaldanha@fm.ul.pt
Received 20 April 2011; Accepted 7 July 2011 Academic Editor: Terry K. Smith
Copyright © 2012 C. Saldanha et al. This is an open access article distributed under the Creative Commons Attribution License, which permits unrestricted use, distribution, and reproduction in any medium, provided the original work is properly cited. The aim of this work was to evaluate in vitro the effect of autologous plasma lipoprotein subfractions on erythrocyte tendency to aggregate. Aliquots of human blood samples were enriched or not (control) with their own HDL-C, LDL-C, or VLDL-C fractions obtained from the same batch by density gradient ultracentrifugation. Plasma osmolality and erythrocyte aggregation index (EAI) were determined. Blood aliquots enriched with LDL-C and HDL-C showed significant higher EAI than untreated aliquots, whereas enrichment with VLDL-C does not induce significant EAI changes. For the same range of lipoprotein concentrations expressed as percentage of osmolality variation, the EAI variation was positive and higher in presence of HDL-C than upon enrichment with LDL-C (P < 0.01). Particle size, up to LDL diameter values, seems to reinforce erythrocyte tendency to aggregate at the same
plasma osmolality (particle number) range of values.
1. Introduction
There is scientific agreement that a high serum level of low-density lipoproteins cholesterol (LDL-C) is a risk factor for atherosclerosis and cardiovascular diseases [1–3]. A linear relationship between LDL-C levels and the occurrence of coronary artery disease is well documented in two meta-analysis [4, 5]. Conversely, it has been shown that HDL-C when at normal or high serum levels acts as a vascular protector and consequently without contribution such as a risk factor for atherosclerosis [6]. However, if its antioxidant capacity is diminished in patients with systolic heart failure, it will predict a higher risk of incident long term for adverse cardiac events [7].
Several clinical studies evidenced associations between complex lipid macromolecules; for example, high LDL-C concentrations and blood rheological behaviour, like blood hyperviscosity, that are both referred to as cardiovascular risk factors [8–10]. Blood viscosity is dependent on macro-(hematocrit and plasma viscosity) and micro-(erythrocyte
deformability and aggregation) hemorheological parame-ters. Disturbances in blood rheological behaviour, such as high values of the blood and plasma viscosity and increased erythrocyte aggregation tendency, have been described in patients with ischemic heart diseases [11]. Red blood cells (RBCs) participate in acute coronary occlusion, mainly under conditions of lower shear rate, for example, within the microcirculation in the peri-infarct domain of myocardium [12].
Under in vitro stasis conditions, RBCs in normal human blood form loose aggregates with a characteristic morphol-ogy, similar to a stack of coins. Such aggregation is frequently named as rouleaux formation [13]. After prolonged stases, individual rouleaux can cluster, thereby forming three-dimensional structures, [14, 15]. Under circulation, the attractive forces involved are relatively weak, and aggregates can be dispersed during flow by the shear rate [16]. RBCs aggregation increasing at low shear rate affects blood viscosity and microvascular flow dynamics being markedly enhanced in several clinical states [17–21].
Factors influencing RBCs aggregation can be divided into (i) extrinsic factors such as levels of plasma pro-teins (e.g., fibrinogen, lipopropro-teins, macroglobulins, or immunoglobulins), hematocrit, and shear rate, and (ii) intrinsic factors, for example, RBCs shape, deformability and membrane surface properties [22–32]. RBC membrane surface properties and structure, such as surface charge and the ability of macromolecules to penetrate the membrane glycocalyx, greatly affect aggregation for cells suspended in a defined medium [33,34]. Different studies have shown that hyperlipoproteinemia is associated with erythrocyte hyper-aggregation [35–37]. The inverse correlation of erythrocyte aggregation with HDL2-C subfraction was reported in hypercholesterolemia middle-aged male population without apparent symptoms of cardiovascular disease [38]. It was evi-denced in vitro that LDL-C enhances the RBCs aggregation induced by fibrinogen according to two aggregation models [39]. Considering the particle-like nature of the lipoproteins we raise the hypothesis that increased amounts of lipoprotein particles may change plasma osmolality with repercussions in erythrocyte aggregation.
The aim of our work was to study in vitro the erythro-cyte aggregation tendency in blood samples collected from healthy male adults and enriched with their own plasma lipoproteins subfractions.
2. Material and Methods
2.1. Blood Samples. On consecutive days, venous blood
samples were obtained with previous consent from healthy fasting volunteers adult males (n = 10) after 15 min in the recumbent position and collected (for two plastic tubes) with anticoagulant (10 I.U. of heparin/mL or 0.1% EDTA).
2.2. Lipoprotein Fractions. Lipoproteins fractions were
pre-pared by a discontinuous NaCl/KBr density gradient ultra-centrifugation using an SW 50.1 rotor (Beckman) [40]. Lipoprotein fractions were characterised by electrophore-sis (Electra HR Helena Laboratories) buffer tris-barbital-sodium buffer pH 8.8) in cellulose acetate by comparison with serum controls (Lipotrol, Helena Laboratories).
2.3. Erythrocyte Aggregation Index. Erythrocyte aggregation
was determined using the MA1 aggregometer from Myrenne GMBH (Roetgen, Germany). The MA1 aggregometer con-sists of a rotating cone plate chamber which disperses the sample by high shear rate of 600 s−1 and a photometer that determines the extent of aggregation. The intensity of light (emitted by a light emitting diode) is measured after transmission through the blood sample. The aggregation was determined in stasis for 10 seconds after dispersion of the blood sample [41].
2.4. Plasma Osmolality. Plasma osmolality was determined
with the Osmomat 030 Cryoscopic Osmometer from Gonotec (Berlin, Germany).
2.5. Experimental Design. Blood samples from each donor
were divided on aliquots, and after centrifugation and small volumes of plasma (0, 5μL, 10 μL, 20 μL, and 40 μL)
were discharged and replaced by equal values of their own previously enriched lipoprotein subfractions prepared a day before. With this procedure, no hematocrit variations were obtained. Blood aliquots were gently mixed by inversion, and erythrocyte aggregation was assessed. At the end of each assay, the aliquots were centrifuged at 12000 rpm for 1 minute in the Biofuge 15 centrifuge from Heraeus, and plasma osmolality was determined. HDL-C, LDL-C, and VLDL-C concentrations were expressed as percentage of osmolality variation values.
2.6. Statistical Analysis. The statistical evaluation performed
utilized the “one-way” ANOVA with homogeneity test, cluster analysis, and average method.
3. Results
The major plasma lipoprotein subfractions were obtained by the discontinuous density gradient centrifugation between the density range of 1.006 and 1.300 g/mL. Each lipoprotein fraction was well banded with VLDL-C at the top, LDL-C in the upper middle and the HDL-C in the lower middle portion of the tube. After that, each fraction was pooled and submitted to electrophoresis where their obtained migration was confirmed by comparison with the serum control.
The volume of each lipoprotein sub-fraction added to the autologous blood samples aliquots caused variation of osmolality concentrations in relation to its absence. Using the cluster analysis and the beverage method, four classes of concentration range expressed as osmolality variation were grouped for each LDL-C; the VLDL-C and the HDL-C enriched blood aliquots, namely, Class I 0.005–0.025; Class II 0.030–0.035; Class III 0.045–0.055; Class IV 0.077–0.095 (Figure 1).
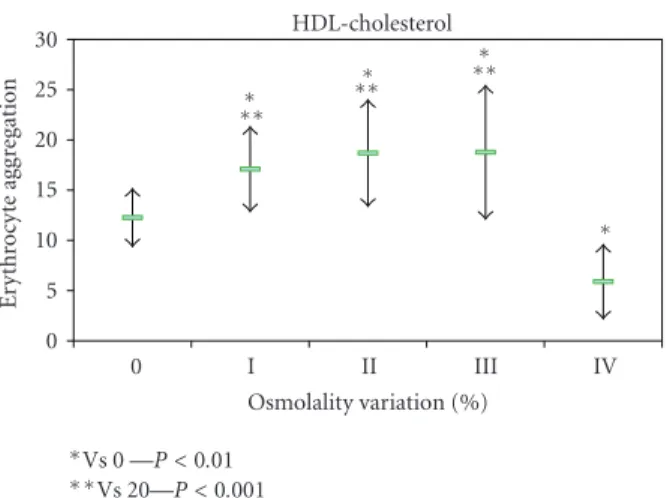
The erythrocyte aggregation variation for each enriched LDL, HDL, and VLDL blood aliquots in relation to the initial value is grouped by the different osmolality class variation values (Figure 2). The variation of erythrocyte aggregation in relation to the initial values depends on the plasma osmolality values, as well as of the type of lipoprotein sub-fraction. The enriched VLDL-C blood samples aliquots do not induce statistical significant variation on erythrocyte aggregation values (Figure 3). At variance in relation to the initial erythrocyte aggregation values, the enriched LDL-C blood samples presented significant statistical enhanced values at all range of percentage of osmolality variation (Figure 4). The same behaviour was verified in the enriched HDL-C blood aliquots, with exception for the higher values of percentages of osmolality variation, where a very signifi-cant (P < 0.0001) decrease was obtained for the erythrocyte
aggregation (Figure 5). For the same range of osmolality variation, the two types of lipoproteins LDL-C and HDL-C induced different variation of erythrocyte aggregation (P < 0.01). When the values of osmolality variation were
HDL-cholesterol LDL-cholesterol VLDL-cholesterol IV III II I Population 0 2 4 6 8 10 12 n.
Figure 1: Histogram presenting the concentrations of enriched blood samples with LDL-C (red), HDL-C (blue), VLDL-C (green) distributed by four classes according the osmolality scale of values (class I 0.005–0.025; class II 0.030–0.035: class III 0.045–0.055; class IV 0.077–0.095). HDL-cholesterol LDL-cholesterol VLDL-cholesterol V IV III II I
Erythrocyte aggregation variation
−4 −2 0 2 4 6 8
Figure 2: Histogram presenting the values of the erythrocyte aggregation variation obtained in enriched blood samples with LDL-C (red), HDL-C (blue), VLDL-C (green) in the four classes of concentration according the osmolality scale of values (I 0.005– 0.025; II 0.030–0.035: III 0.045–0.055; IV 0.077–0.095).
obtained in each enriched HDL-C aliquot, a significant (R2= 0.383) inverse linear regression was obtained (Figure 6).
4. Discussion
In the present in vitro study, we investigated the induction of human erythrocyte tendency to aggregation by autologous lipoproteins sub-fractions. With the amount of lipoprotein
IV III II I 0 Osmolality variation (%) VLDL-cholesterol 0 5 10 15 20 25 E ryt h ro cyt e ag gr eg at io n
Figure 3: Values of erythrocyte aggregation index (mean +/– sd) obtained in enriched blood samples with HDL-C and without enrichment. IV III II I 0 Osmolality variation (%) LDL-cholesterol 0 5 10 15 20 25 E ryt h ro cyt e ag gr eg at io n ∗ ∗ ∗ ∗∗ ∗Vs 0—P < 0.01 ∗∗Vs 5—P < 0.001
Figure 4: Values of erythrocyte aggregation index (mean +/– sd) obtained in enriched blood samples with HDL-C and without enrichment
sub-fractions added, changes in plasma osmolality were observed as a consequence of the increase number of particles. We used cluster method on the values of osmolality to define four classes (Figure 1).
In blood aliquots enriched with VLDL-C, no changes in erythrocyte aggregation index were verified (Figure 3). For the same amount of particles corresponding to the same class of osmolality variation, both HDL-C and LDL-C enrichment induce enhancement of erythrocyte aggregation (Figures4and5). VLDL has higher diameter than the other two lipoprotein classes [42] and may either rest in the plasma bulk not interfering with erythrocyte aggregation tendency. LDL-C particles bind in a nonabsolute specific way with erythrocyte membrane, while 60% of membrane area can be occupied by HDL-C as has been described [43]. The occu-pancy of some areas of erythrocyte membrane by HDL-C or LDL-C, causing some interference in the promotion of EAI tendency, may be an explanation for our results. Significant (P < 0.01) higher values of erythrocyte aggregation were
obtained in HDL-C-enriched aliquots more than for LDL-C-enriched ones at the same class of osmolality variation (under the same number of particles). The exception was
IV III II I 0 Osmolality variation (%) HDL-cholesterol 0 5 10 15 20 25 30 E ryt h ro cyt e ag gr eg at io n ∗ ∗∗ ∗ ∗∗ ∗ ∗∗ ∗ ∗Vs 0 —P < 0.01 ∗∗Vs 20—P < 0.001
Figure 5: Values of erythrocyte aggregation index (mean +/– sd) obtained in enriched blood samples with LDL-C and without enrichment. 0.25 0.2 0.15 0.1 0.05 0 Osmolality variation R2linear= 0.383 −10 −5 0 5 10 15 20 E ryt h ro cyt e ag gr eg at io n va ri at io n
Figure 6: Presentation of the association obtained between the ery-throcyte aggregation values and the osmolality values in enriched blood sample with HDL-C.
for the HDL-C-enriched aliquots with the highest percentage of osmolality variation which significantly (P < 0.0001)
decreased EAI to lower values than the aliquot control obtained. We raise the hypothesis that the higher number of unbinding HDL-C particles may increase the ionic strength to a threshold and consequently pull away the erythrocytes decreasing their tendency to aggregate.
Our results suggest that in healthy human blood aliquots enriched with autologous HDL-C or LDL-C, (where fibrino-gen is present at normal range), when submitted to shear rate to disaggregate RBCs, and stopped after that, EAI tendency increases. The association between EAI values and HDL-C obtained in our experimental design is in accordance with others studies [39], which is a decrease of fibrinogen-induced
RBCs aggregation in presence of the HDL2 subclass as not observed in a different experimental approach.
Recently [44], it was verified that the LDL particles num-ber must be considered as an indicator for atherosclerosis risk factor, which has been previously remembered by others in the prevention of cardiovascular disease [45].
Two models, the cross-bridging and the depletion layer, were described to explain the reversible erythrocyte aggre-gation process at physiological conditions [46], but there are controversies and difficulties to adopt one or reject an other. The depletion model developed for polymer solutions of dextran demonstrated that there is an optimal molecular weight value to reach the greater erythrocyte aggregation tendency [47]. The hydrodynamic radius (Rh) determined for VLDL [48] is in the range between 15 nm and 40 nm which is much above of others belonging to macromolecules promoters of erythrocyte aggregation increase [49]. Particle size is an influent factor that may explain the absence of VLDL effect in the erythrocyte aggregation obtained. Regarding our results, they may also fit the cross-bridging model if, by an unknown mechanism, we assume that the particles numbers and size favour fibrinogen binding in a similar way as previously reported for immunoglobulin effects on fibrinogen-mediated erythrocyte aggregation [50,
51]. More studies are needed to explain in what model fit the effects of lipoproteins in erythrocyte aggregation. Our results may contribute to better understand the direct associations between high erythrocyte aggregation tendency and other cardiovascular risk factors such as hyperlipoproteinemia.
Acknowledgments
The authors are grateful to Emilia Alves for typewriting the paper. This work was supported by “Fundac¸˜ao para a Ciˆencia e a Tecnologia.”
References
[1] W. B. Kannel, W. P. Castelli, and T. Gordon, “Cholesterol in the prediction of atherosclerotic disease: new perspectives based on the Framingham study,” Annals of Internal Medicine, vol. 90, no. 1, pp. 85–91, 1979.
[2] N. E. Miller, F. Hammett, S. Saltissi, H. Vanzeller, S. Coltart, and B. Lewis, “Relation of angiographically defined coro-nary artery disease to plasma lipoprotein subfractions and apolipoproteins,” The British Medical Journal, vol. 282, no. 6278, pp. 1741–1744, 1981.
[3] A. M. Alshehri, “Metabolic syndrome and cardiovascular risk,”
Journal of Family and Community Medicine, vol. 17, pp. 73–78,
2010.
[4] C. Baigent, A. Keech, P. M. Kearney, L. Blackwell, and G. Buck, “Efficacy and safety of cholesterol-lowering treatment prospective meta-analysis of data from 90,056 participants in 14 randomised trials of statins,” The Lancet, vol. 366, pp. 1267– 1278, 2005.
[5] J. G. Robinson, B. Smith, N. Maheshwari, and H. Schrott, “Pleiotropic effects of statins: benefit beyond cholesterol reduction? A meta-regression analysis,” Journal of the
[6] A. V. Khera, M. Cuchel, M. de la Llera-Moya et al., “Choles-terol efflux capacity, high-density lipoprotein function, and atherosclerosis,” The New England Journal of Medicine, vol. 364, no. 2, pp. 127–135, 2011.
[7] W. H. Tang, Y. Wu, S. Mann et al., “Diminished antioxidant activity of high-density lipoprotein-associated proteins in systolic heart failure,” Circulation—Heart Failure, vol. 4, no. 1, pp. 59–64, 2011.
[8] A. H. Seplowitz, S. Chien, and F. R. Smith, “Effects of lipoproteins on plasma viscosity,” Atherosclerosis, vol. 38, no. 1-2, pp. 89–95, 1981.
[9] G. Lowe, “Blood viscosity, lipoproteins, and cardiovascular risk,” Circulation, vol. 85, no. 6, pp. 2329–2331, 1992. [10] W. Koenig, M. Sund, E. Ernst, W. Mraz, V. Hombach, and
U. Keil, “Association between rheology and components of lipoproteins in human blood: results from the MONICA project,” Circulation, vol. 85, no. 6, pp. 2197–2204, 1992. [11] G. Kesmarky, K. Toth, L. Habon, G. Vajda, and I. Juricskay,
“Hemorheological parameters in coronary artery disease,”
Clinical Hemorheology and Microcirculation, vol. 18, no. 4, pp.
245–251, 1998.
[12] J. Dormandy, E. Ernst, A. Matrai, and P. T. Flute, “Hemor-rheologic changes following acute myocardial infarction,” The
American Heart Journal, vol. 104, no. 6, pp. 1364–1367, 1982.
[13] A. M. Ehrly, Therapeutic Hemorheology, Springer, New York, NY, USA, 1991.
[14] G. D. O. Lowe, Clinical Blood Rheology, CRC Press, Boca Raton, Fla, USA, 1988.
[15] J. F. Stoltz, M. Singh, and P. Riha, Hemorheology in Practice, IOS Press, Amsterdam, The Netherlands, 1999.
[16] O. K. Baskurtand and H. J. Meiselman, “Cellular determinants of low-shear blood viscosity,” Biorheology, vol. 34, no. 3, pp. 235–247, 1997.
[17] P. Sousa-Ramalho, R. Martins, C. Saldanha, L. Cardoso, D. Santos, and J. Martins e Silva, “Haemorheological changes in glaucoma,” New Trends in Ophthalmology, vol. 1, pp. 45–51, 1986.
[18] S. Chien and L. A. Lang, “Physicochemical basis and clinical implications of red cell aggregation,” Clinical Hemorheology, vol. 7, no. 1, pp. 71–91, 1987.
[19] P. Souza-Ramalho, H. Hormigo, R. Martins, C. Saldanha, and J. Martins e Silva, “Haematological changes in retinal vasculitis,” Eye, vol. 2, no. 3, pp. 278–282, 1988.
[20] L. Sargento, L. Zabala, T. Gomes, C. Saldanha, J. Martins-Silva, and P. Souza-Ramalho, “The effect of angiography with disodium fluorecein on the hemorheologic parametes of diabetes,” Acta M´edica Portuguesa, vol. 9, pp. 303–307, 1996. [21] E. Konstantinova, L. Ivanova, T. Tolstaya, and E. Mironova,
“Rheological properties of blood and parameters of platelets aggregation in arterial hypertension,” Clinical Hemorheology
and Microcirculation, vol. 35, no. 1-2, pp. 135–138, 2006.
[22] T. Shiga, N. Maeda, and K. Kon, “Erythrocyte rheology,”
Critical Reviews in Oncology/Hematology, vol. 10, no. 1, pp. 9–
48, 1990.
[23] N. Maeda, M. Seike, Y. Suzuki, and T. Shiga, “Effect of pH on the velocity of erythrocyte aggregation,” Biorheology, vol. 25, no. 1-2, pp. 25–30, 1988.
[24] G. Yardin and H. J. Meiselman, “Effects of cellular morphology on the viscoelastic behavior of high hematocrit RBC suspen-sions,” Biorheology, vol. 26, no. 2, pp. 153–175, 1989. [25] C. Saldanha and J. Martins e Silva, “Effect of plasma osmolality
on erythrocyte aggregation index. H´emorheologie et aggre-gation erythrocytaire,” in Th´eories et Applications Cliniques,
J. F. Stoltz, M. Donner, and A. L. Copley, Eds., vol. 3, pp. 142– 145, Editions Medicales Internationales, 1991.
[26] R. Mesquita, M. I. Gonc¸alves, S. Dias, L. Sargento, C. Saldanha, and J. Martins e Silva, “Ethanol and erythrocyte membrane interaction: a hemorheologic perspective,” Clinical
Hemorheology and Microcirculation, vol. 21, no. 2, pp. 95–98,
1999.
[27] I. Gonc¸alves, C. Saldanha, and J. Martins e Silva, “Beta-estradiol effects on erythrocyte aggregation—a controlled in vitro study,” Clinical Hemorheology and Microcirculation, vol. 25, no. 3-4, pp. 127–134, 2001.
[28] R. Mesquita, I. Pires, C. Saldanha, and J. Martins-Silva, “Effects of acetylcholine and spermineNONOate on erythro-cyte hemorheologic and oxygen carrying properties,” Clinical
Hemorheology and Microcirculation, vol. 25, no. 3-4, pp. 153–
163, 2001.
[29] T. Santos, R. Mesquita, J. Martins e Silva, and C. Saldanha, “Effects of choline on hemorheological properties and NO metabolism of human erythrocytes,” Clinical Hemorheology
and Microcirculation, vol. 29, no. 1, pp. 41–51, 2003.
[30] S. Hil´ario, C. Saldanha, and J. Martins e Silva, “An in vitro study of adrenaline effect on human erythrocyte properties in both gender,” Clinical Hemorheology and Microcirculation, vol. 28, no. 2, pp. 89–98, 2003.
[31] F. A. Carvalho, A. V. Maria, J. M. Braz Nogueira, J. Guerra, J. Martins-Silva, and C. Saldanha, “The relation between the erythrocyte nitric oxide and hemorheological parameters,”
Clinical Hemorheology and Microcirculation, vol. 35, no. 1-2,
pp. 341–347, 2006.
[32] J. P. Almeida, F. A. Carvalho, T. Freitas, and C. Saldanha, “Modulation of hemorheological parameters by the erythro-cyte redox thiol status,” Clinical Hemorheology and
Microcir-culation, vol. 40, no. 2, pp. 99–111, 2008.
[33] M. W. Rampling, H. J. Meiselman, B. Neu, and O. K. Baskurt, “Influence of cell-specific factors on red blood cell aggregation,” Biorheology, vol. 41, no. 2, pp. 91–112, 2004. [34] V. Schechner, I. Shapira, S. Berliner et al., “Significant
dominance of fibrinogen over immunoglobulins, C-reactive protein, cholesterol and triglycerides in maintaining increased red blood cell adhesiveness/aggregation in the peripheral venous blood: a model in hypercholesterolaemic patients,” The
European Journal of Clinical Investigation, vol. 33, no. 11, pp.
955–961, 2003.
[35] R. H. Jay, M. W. Rampling, and D. J. Betteridge, “Abnor-malities of blood rheology in familial hypercholesterolaemia: effects of treatment,” Atherosclerosis, vol. 85, no. 2-3, pp. 249– 256, 1990.
[36] S. Muller, O. Ziegler, M. Donner, P. Drouin, and J. F. Stoltz, “Rheological properties and membrane fluidity of red blood cells and platelets in primary hyperlipoproteinemia,”
Atherosclerosis, vol. 83, no. 2-3, pp. 231–237, 1990.
[37] A. Vay´a, M. Mart´ınez, R. Carmena, and J. Aznar, “The lipid composition of red blood cells and their hemorheological behaviour in patients with primary hyperlipoproteinemia,”
Clinical Hemorheology and Microcirculation, vol. 13, pp. 447–
457, 1993.
[38] S. M. Razavian, V. Atger, P. Giral et al., “Influence of HDL sub-fractions on erythrocyte aggregation in hypercholesterolemic men,” Arteriosclerosis and Thrombosis, vol. 14, no. 3, pp. 361– 366, 1994.
[39] E. Simon, S. M. Razavian, J. L. Beyec et al., “Influence of lipoprotein subfractions on dextran- and fibrinogen-induced erythrocyte aggregation,” Clinical Hemorheology, vol. 15, no. 4, pp. 667–676, 1995.
[40] B. H. Chung, T. Wilkinson, J. C. Geer, and J. P. Segrest, “Preparative and quantitative isolation of plasma lipoproteins: rapid, single discontinuous density gradient ultracentrifuga-tion in a vertical rotor,” Journal of Lipid Research, vol. 21, no. 3, pp. 284–291, 1980.
[41] H. Schmid-Schonbein, E. Volger, P. Teitel, H. Kieswetter, V. Dauer, and L. Heilman, “New hemorheological techniques for the routine laboratory,” Clinical Hemorheology, vol. 2, no. 1-2, pp. 93–105, 1982.
[42] A. M. Gotto Jr., H. J. Pownall, and R. J. Havel, “Introduction to the plasma lipoproteins,” Methods in Enzymology, vol. 128, pp. 3–41, 1986.
[43] D. Y. Hui, J. G. Noel, and J. A. Harmony, “Binding of plasma low density lipoproteins to erythrocytes,” Biochimica
et Biophysica Acta, vol. 664, no. 3, pp. 513–526, 1981.
[44] J. D. Otvos, S. Mora, I. Shalaurova, P. Greenland, R. H. MacKey, and D. C. Goff, “Clinical implications of discordance between low-density lipoprotein cholesterol and particle num-ber,” Journal of Clinical Lipidology, vol. 5, no. 2, pp. 105–113, 2011.
[45] W. C. Cromwell, J. D. Otvos, M. J. Keyes et al., “LDL particle number and risk of future cardiovascular disease in the Framingham Offspring Study—implications for LDL management,” Journal of Clinical Lipidology, vol. 1, no. 6, pp. 583–592, 2007.
[46] H. J. Meiselman, B. Neu, M. W. Rampling, and O. K. Baskurt, “RBC aggregation: laboratory data and models,” The Indian
Journal of Experimental Biology, vol. 45, no. 1, pp. 9–17, 2007.
[47] B. Neu, R. Wenby, and H. J. Meiselman, “Effects of dextran molecular weight on red blood cell aggregation,” Biophysical
Journal, vol. 95, no. 6, pp. 3059–3065, 2008.
[48] D. C. Rambaldi, A. Zattoni, S. Casolari, P. Reschiglian, D. Roessner, and C. Johann, “An analytical method for size and shape characterization of blood lipoproteins,” Clinical
Chemistry, vol. 53, no. 11, pp. 2026–2029, 2007.
[49] K. J. Armstrong, R. B. Wenby, H. J. Meiselman, and T. C. Fisher, “The hydrodynamic radii of macromolecules and their effect on red blood cell aggregation,” Biophysical Journal, vol. 87, no. 6, pp. 4259–4270, 2004.
[50] N. Maeda and T. Shiga, “Opposite effect of albumin on the erythrocyte aggregation induced by immunoglobulin G and fibrinogen,” Biochimica et Biophysica Acta, vol. 855, no. 1, pp. 127–135, 1986.
[51] R. Ben-Ami, G. Barshtein, T. Mardi et al., “A synergistic effect of albumin and fibrinogen on immunoglobulin-induced red blood cell aggregation,” The American Journal of Physiology—
Heart and Circulatory Physiology, vol. 285, pp. H2663–H2669,