ENERGY ANALYSIS AND HEAT LOADS CALCULATION APPROACH:
APPLICATION TO AGRIFOOD INDUSTRIAL PREMISES
J. GONÇALVES
(*), J. NUNES
(**), P. D. SILVA
(*), P. D. GASPAR
(*), L. PIRES
(*) (*)Engineering Faculty, University of Beira Interior, Rua Marquês d' Ávila e Bolama, 6200 Covilhã, Portugal.
E-mail: [email protected]; [email protected]; [email protected] (**)
Agriculture School, Polytechnical Institute of Castelo Branco, Apartado 119, 6001-909 Castelo Branco, Portugal.
E-mail: [email protected]
ABSTRACT
Nowadays, the agrifood industry is increasingly concerned about energy bills. Thus, there is an increasing trend on the implementation of measures and procedures that ensure and promote energy efficiency. Computational modelling is a powerful tool for project and design of engineering systems, allowing to anticipate and/or correct problems that may lead to inefficiencies. The purpose of this paper is to assess the energy performance of refrigerated premises of a real company modelled in EnergyPlus. The data that characterize the company and the production process were collected previously through an energy audit. Results of the comparison between real case and simulation show that the cooling system represents 56.4% and 47.8% of the total electrical energy consumption, respectively. Also, it is found that heat transmission loads trough cold rooms envelope and air infiltration are those that most affect the energy performance, accounting for almost 80% of the refrigeration needs of the company.
1. INTRODUCTION
The industrial refrigeration systems perform, currently, a major role in the conservation of food products. The failure or absence of these equipment would represent significant consequences in the agrifood sector, thus, would affect the people eating habits once they need, in a daily basis, a wide variety of fresh foods to meet the energy and nutrient requirements. The use of cold in food products conservation has the objective to prevent or retard the food deterioration, while maintaining a high level of quality with regard to appearance, flavour, odour and nutrient content, since its commercial value depends of these characteristics.
Food products that require cold to maintain their organoleptic properties are called perishable food products. These products require greater care, since any excess temperature to which they are subject, in transportation, in storage or in the point of sale, enhances the probability of microbial development.
This situation compromises the food quality and can casually have consequences in terms of food security. Coulomb (2008) states that food products such as fruits and vegetables, dairy products, meat, fish and shellfish, need to be preserved. These products represent almost a third of all agricultural and fishing production. Adds further that only 10% of perishable food products are, in fact, chilled and that about 30% of the total world production is wasted after harvest, pointing out the refrigeration as the option to reduce these losses.
On the other hand, a study by the International Institute of Refrigeration (2009), reveals that 25% of all food produced worldwide are wasted and 20% of this waste is due to the lack of refrigeration. If developing countries acquire the same cooling technology that is used in industrialized countries, more than 200 million tons of perishable food products could be preserved, representing about 14% of the current consumption of these countries (James and James, 2010). Mattarolo (1990) estimated that 40% of all food products require refrigeration corresponding to 15% of worldwide energy consumption as refrigeration systems to ensure a constant temperature throughout the cold chain in order to preserve the food products require significant energy consumptions (Lekov et al., 2009; Nunes et al., 2014; Gaspar et al., 2014). Moreover, the production of the electrical energy needed to power refrigeration equipments releases significant amounts of CO2 to the atmosphere, requiring the use of better energy efficiency practices (James and James, 2010; Silva et al., 2014). Nowadays the agrifood companies are concerned with the energy bills. Thus, they start to implement measures and procedures to decrease the energy consumption and to promote the energy efficiency, by the
use of new technologies together with the change of manufacturing processes and behaviours. The energy consumed by the refrigerated installations is directly related to several factors, such as, the constructive quality of the building, the exterior environmental conditions, the operating temperatures, the size of the cold rooms, the configuration of products inside the cold rooms, the inlet temperature of the products, among others (James and James, 2010).
The purpose of this work is to assess the energy performance of a real company that uses cooling chambers for storing and conservation of food products, through numerical simulation. For the simulation of the case in study, the data that characterize the company and the production process were collected through energy audits. Subsequently the results of the computational model were compared with real values. The computational model was also used to provide suggestions for improvement in terms of constructive elements, leading to optimization of the building and the cooling chambers, with the intent to obtain energy savings.
2. MATERIALS AND METHODS
DesignBuilder, version 3.4.041 – with Energy Plus 8.1, was the computational model used in this simulation study. The DesignBuilder emerged in 2005 as the first, and currently the most complete, graphical user interface with the EnergyPlus. This computational tool has the ability to simulate the thermal behaviour of a building in a variable time base, as well to calculate the energy consumption, in order to test solutions and strategies to improve energy efficiency. For this, it is necessary to introduce in the program a variety of parameters, such as the location, the geometry, the parameters related to activity, the lighting, the constructive elements, the glazed surfaces, the HVAC systems, among others (Crawley et al., 2008).
2.1. Industrial building description
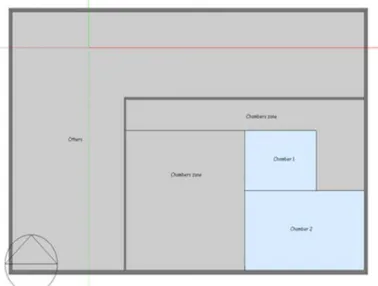
As a reference for the study was considered a small company with 4 employees and with fixed opening hours from 9 am to 6 pm, Monday to Saturday. This company is dedicated to the retail sale of meat and meat products. The building covers an area of approximately 600 m2, has the main facade oriented to the west and a minimum ceiling height of 4 m and a maximum of 6 m. In the surroundings, there are no buildings or groves that cause shading. Figure 1 shows the schematic plant of the industrial building.
Figure 1. Schematic plant of the industrial building.
The direct expansion refrigeration system of this company was an overall compressor power of 23 kW and uses the refrigerant R404A. For simplicity, the building is divided into two zones. The first zone, designed as "Others", comprises offices, dock loading and unloading, receiving and auxiliary spaces. The cold chambers are located on the second zone, designed as "Chambers zone", as well as a carcasses cutting room. The chambers 1 and 2, that were both running at the time of the study, have a volume of 86.4 m3 (6 m x 4.5 m x 3.2 m) and 192 m3 (6 m x 10 m x 3.2 m), respectively.
2.2. Constructive elements
The building under study was built in 2006, and presents excellent conditions of thermal insulation. In Table 1 are defined the elements that characterize the building and in Table 2 the elements that characterize the cold chambers 1 and 2.
Table 1. Constructive elements of the building.
Element Materials Thickness (mm) U (W m-2 K-1)
External walls
Cement sand render Brick
Extruded polystyrene board Brick
Cement sand render
15 110 40 110 15 0.595
Roof and doors
White-painted steel Polyurethane foam White-painted steel 1 40 1 0.626
Floor Aerated concrete slab 200 0.680
Walls and ceilings
White-painted steel Polyurethane foam White-painted steel 1 60 1 0.432 Windows
Glass with reflecting layer Air box Simple glass 6 6 6 3.107
Table 2. Constructive elements of the chambers 1 and 2.
Zone Materials Thickness (mm) U (W m-2 K-1)
Walls, ceiling and door White-painted steel Polyurethane foam White-painted steel 1 80 1 0.224 Floor Aerated concrete slab Epoxy
resin
200
2 0.699
2.3. Computacional model
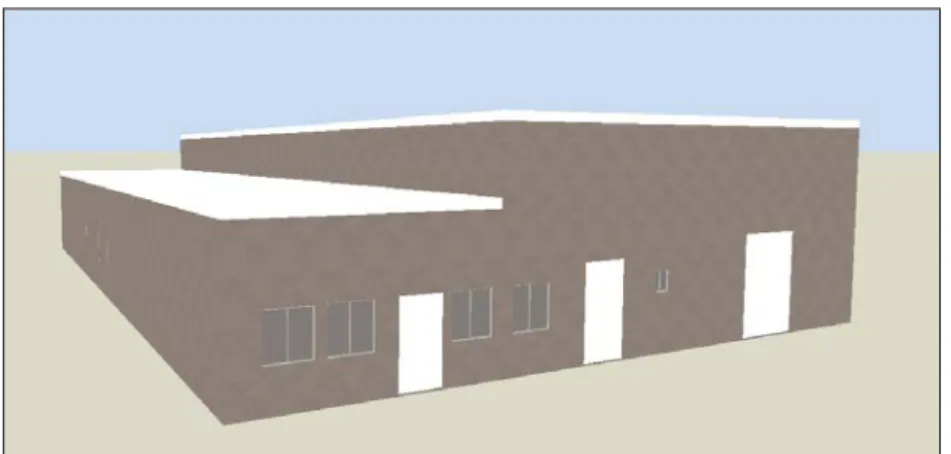
For simulation purposes it was necessary to build based on the real model a computational model. Starting with a plant kindly provided by the company, the model was built in DesignBuilder, as displayed in Figure 2.
Figure 2. Perspective of the company-building facade modelled in DesignBuilder.
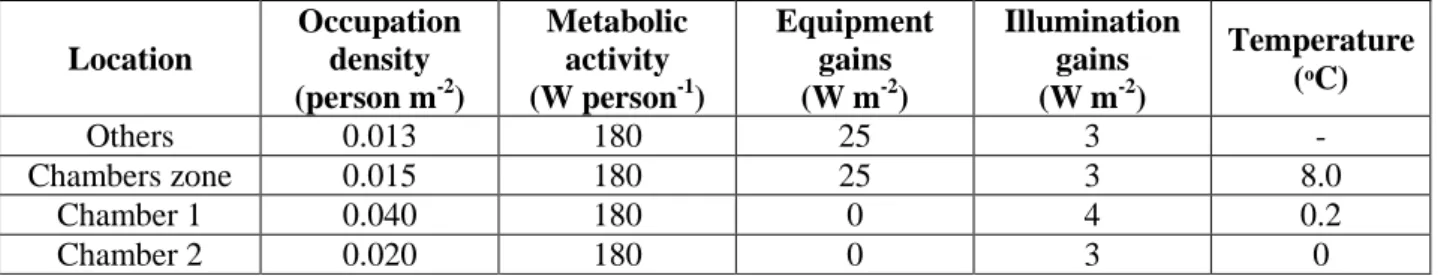
The parameters that characterize the different zones and chambers of the company under study are described in Table 3. The lamps used in the company are of the fluorescent type. Therefore, the type of luminaries has been defined as "Surface Mount". In turn, the metabolic activity considered for each of the defined zones and chambers is "Manual labour (light)". The temperature verified in the area "Others" is not controlled,
oscillating in function of the thermal gains through the constructive elements, however, the temperatures of the "Chambers Zone" and the chambers 1 and 2 are controlled. These values are shown in Table 3.
Table 3. Parameters that characterize the different zones of the company.
Location Occupation density (person m-2) Metabolic activity (W person-1) Equipment gains (W m-2) Illumination gains (W m-2) Temperature (ᵒC) Others 0.013 180 25 3 - Chambers zone 0.015 180 25 3 8.0 Chamber 1 0.040 180 0 4 0.2 Chamber 2 0.020 180 0 3 0
The sensible and latent heat load of the products was evaluated according to ASHRAE (2006, 2010). The amount of product distributed by the two storage chambers at the time the audit was 1350 kg for chamber 1 and 3150 kg for chamber 2. The rate of chilled product was obtained through the ratio between the amount of meat present in the chambers during the audit and its duration. Also, the company indicated a temperature difference of 5K between the product inlet temperature and the cold storage desired temperature. The thermal load of products and the gains related to respiration and transpiration of them were treated as convective gains of 13 and 14 Wm-2 in the chambers 1 and 2, respectively.
The thermal loads related with infiltrations through the door opening were calculated in accordance with ASHRAE (2006). It was assumed one passage by hour, with an opening time of 3 sec and was considered that the doors remained open for 30 sec. Also, the effectiveness of protection was considered equal to 0.95, since the chambers had lamellae of PVC in good conditions. Relatively to the periods of daily occupation and schedules annual occupancy, according to company information was considered an occupancy rate of 30% in “Chamber 2” and 80% for the remaining zones, during two periods: from 9 am to 12 am; and from 1 pm to 6 pm. Additional details of the computational model can be found in Gonçalves (2014).
3. ANALYSIS AND DISCUSSION OF RESULTS
The results of this simulation were obtained through the introduction of the parameters aforementioned, and are listed in the form of a final report provided by the software used. These results are discriminated in function of the building areas and chambers by several types of consumptions, zone temperatures, thermal loads, among others. The electrical energy consumption of the company, registered during period of the energy audit was 1172 kWh. On other hand, the correspondent consumption value obtained through simulation was 1324 kWh, meaning a difference of 13%, as can be seen in Figure 3.
Figure 3. Energy consumption comparison, total and partial, between the real case and the simulation, during the energy audit.
From simulation results the refrigeration represents 56.4% of the total energy consumption of the company comparing with 47.8% in the real situation. Part of the difference in energy consumed by refrigeration in the
simulation compared to the real case can be justified by the difference between the climate data used and the temperatures recorded during the audit, accordingly with reported by Chan (2011) and Bhandari et al. (2012) about the relevance of the weather data in the success of the simulation of the energy performance of a building.
Figure 4 shows the temperatures observed inside the chambers 1 and 2 during the simulation, respectively, and it appears that they remain almost constant over time and are very similar with the measured values.
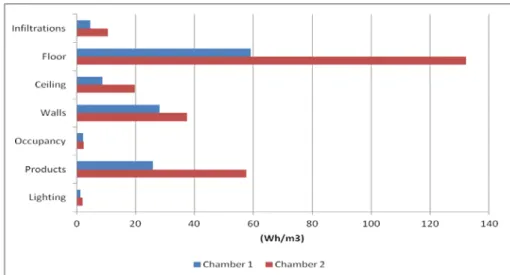
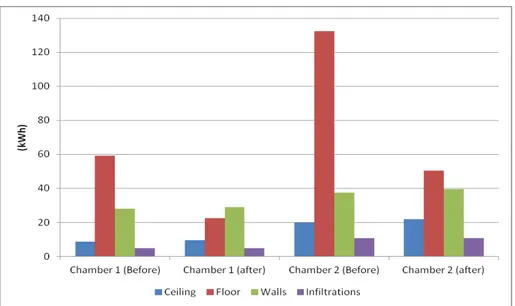
Figure 4. Temperature values inside chamber 1 (a), chamber 2 (b) and the outside dry bulb (red). The breakdown of the energy consumption is provided in Figure 5. It is verified that in the chambers 1 and 2 the thermal loads related to the lighting, sensible and latent heat load of the products and the heat load of occupation represent 20.1% and 21.2%, respectively, of the energy used by the cooling system to remove these heat gains. The remaining amount of energy is used by the cooling systems to deal with thermal gains by heat transfer through the constructive elements of the chambers and air infiltrations.
Figure 5. Internal thermal loads recorded in the modelling for the chamber 1 and 2.
Also, is through the floor that occur the higher thermal gains, 59 kWh in the chamber 1 and 132 kWh in the chamber 2. This behaviour is also true for the whole building. The computational tool will be used now to
evaluate the implementation of some changes in the constructive elements of the company and its consequences into energy performance. The first case tested consisted in improving the floor of the chambers. For this, it was placed a plate of extruded polystyrene foam of 80 mm thick (U = 0.254 Wm-2K-1). With this improvement, it was observed a decrease in thermal gains in the chamber 1 and 2 of 62% and 61.9%, respectively, as can be seen in Figure 6. From this change results a decrease of 8.5% in the total energy consumption of the company, corresponding to an energy saving of 113 kWh (a week).
Figure 6. Thermal gains by heat transmission through the constructive elements and infiltrations after the improvement of the floor of the chamber 1 and 2.
The second simulation, Figure 7, consisted in increasing the thickness of the sandwich panel of the walls of the chamber 2 that are close to the walls of the building, since they are oriented to the south and west (see Figure 1). So, the sandwich panel of 80 mm was replaced by another one with 100 mm thickness (U = 0.190 Wm-2 K-1). With this improvement there is a reduction of 13.6% on the thermal gains through the walls, corresponding to less than 3.2 kWh. Also, the total energy consumption decreased by 0.3%, corresponding to an energy saving of about 4 kWh.
Figure 7. Thermal gains by heat transmission through the constructive elements and infiltrations after the improvement of the walls of the chamber 2.
4.
CONCLUSIONS
In this study was highlighted the importance of industrial cooling systems, since they help to prevent and slow the deterioration of the food products consumed daily. However, it is necessary to realize that these systems are larger energy consumers. Therefore, it is imperative to minimize the consumption of these equipments. One of the best solutions to reach this objective is the thermal improvement of the constructive elements of the building envelope and cold rooms. The use of computational tools to analyze the energy consumptions requires a correct validation in order to assure the validity of the results. The analysis of the results obtained in simulation, show that loads by heat transfer are those that most affect the energy performance of the cold rooms, accounting for over 66% of the need of refrigeration of the company under study. The floor presents itself as a constructive element that deserves greater attention and the results show that a correct investment in the improvement of the floor could bring significant economic gains for the company. The attic above the chambers is another point that deserves some attention, given the proximity of this zone with the cameras and the large thermal amplitude between the chambers and the attic. The solution that provides better results in decreasing the temperature of the attic zone is to use materials with better thermal properties in the building envelope namely in the roof.
5. REFERENCES
1. ASHRAE. 2006, Refrigeration load, In: ASHRAE (American Society of Heating, Refrigerating and Air-Conditioning Engineers) Handbook-Refrigeration, Atlanta: 13.1-13.8.
2. ASHRAE, 2010, Thermal properties of foods, In: ASHRAE (American Society of Heating, Refrigerating and Air-Conditioning Engineers) Handbook-Refrigeration, Atlanta: 19.1-19.31.
3. Bhandari M, Shrestha S, New, J. 2012, Evaluation of weather datasets for building energy simulation, Energy and Buildings 49:109-118.
4. Chan A. 2011, Developing future hourly weather files for studying the impact of climate change on building energy performance in Hong Kong, Energy and Buildings 43: 2860-2868.
5. Coulomb D. 2008, Refrigeration and cold chain serving the global food industry and creating a better future: two key IIR challenges for improved health and environment, Food Science & Technology 19: 413-417.
6. Crawley DB, Hand JW, Kummert M, Griffith BT. 2008, Constrasting the capabilites of building energy performance simulation programs, Building and Environment 43: 661-673.
7. Gaspar PD, Silva PD, Nunes J, Andrade LP. 2014, Characterization of the specific electrical energy consumption of agrifood industries in the central region of Portugal, Applied Mechanics and Materials 590: 878-882.
8. Gonçalves J. 2014, Numerical modeling of the energy performance of food products storage rooms, Master Science Thesis (in Portuguese), Beira Interior University, Covilhã, 132p.
9. IIR. 2009, The Role of Refrigeration in worldwide nutrition, International Institute of Refrigeration (IIR), Paris.
10. James SJ, James C. 2010, The food cold-chain and climate change, Food Research International 43: 1944-1956.
11. Lekov A, Thompson L, McKane A, Rockoff A, Piette M. 2009, Opportunities for Energy Efficiency and Automated Demand Response in Industrial Refrigerated Warehouses in California, Ernest Orlando Lawrence National Laboratory, California, 79p.
12. Mattarolo, L. (1990). Refrigeration and food processing to ensure the nutrition of the growing world population, Proc. of Meetings of Comissions B2, C2, D1, D2-D3, IIR, 43-54.
13. Nunes J, Neves D, Gaspar PD, Silva PD, Andrade LP. 2014, Predictive tool of energy performance of cold storage in agrifood industries: The portuguese case study, Energy Conversion and Management 88: 758–767.
14. Silva PD, Gaspar PD, Nunes J, Andrade LP. 2014, Specific electrical energy consumption and CO2 emissions assessment of agrifood industries in the central region of Portugal, Applied Mechanics and Materials 675-677: 1880-1886.