Applicability of TRMM Precipitation for Hydrologic Modeling in a Basin
in the Northeast Brazilian
Agreste
Marcus Aurélio Soares Cruz
1, Leonardo Teixeira Rocha
2, Ricardo de Aragão
3,
André Quintão de Almeida
21
Embrapa Tabuleiros Costeiros, Aracaju, SE, Brazil.
2
Programa de Pós-Graduação em Recursos Hídricos,
Universidade Federal de Sergipe, São Cristóvão, SE, Brazil.
3
Universidade Federal de Campina Grande, Campina Grande, PB, Brazil.
Received in March 14, 2017 – Accepted in June 27, 2017
Abstract
Determining precipitation using remote sensing is gaining space in hydrologic studies, helping make up for the lack of data in many regions of Brazil. The products from satellite TRMM (Tropical Rainfall Measuring Mission) are widely ap-plied in studies in Brazil, but there are still few results about their applicability for hydrologic modeling in the Northeast Region, which is characterized by an irregular precipitation regime. The objective of this study is to evaluate the feasibil-ity of using the TRMM 3B42 V7 data for hydrologic modeling in the Japaratuba river basin in Sergipe at three timescales: daily, every ten days, and monthly. The comparative analysis between the rainfall data from rain gauges and TRMM did not indicate satisfactory adequacy at these studied scales, since the TRMM data underestimated the total rainfall for all stations used in the study. However, for the hydrologic modeling, acceptable values were obtained for the efficiency coefficients evaluated only for the ten-day and monthly scales.
Keywords:TRMM, hydrological modeling, Japaratuba river basin.
Aplicabilidade da Precipitação TRMM para Modelagem Hidrológica
em uma Bacia no Agreste do Nordeste Brasileiro
Resumo
A determinação da precipitação por sensoriamento remoto está ganhando espaço nos estudos hidrológicos, ajudando a compensar a falta de dados em muitas regiões do Brasil. Os produtos do satélite TRMM são amplamente aplicados em estudos no Brasil, mas ainda há poucos resultados sobre sua aplicabilidade para a modelagem hidrológica na região Nordeste, caracterizada por um regime irregular de precipitação. O objetivo deste estudo é avaliar a viabilidade de utilizar os dados TRMM 3B42 V7 para modelagem hidrológica na bacia do rio Japaratuba, em Sergipe, em três escalas temporais: diária, a cada dez dias e mensal. A análise comparativa entre os dados de pluviômetros e TRMM não indicou adequação satisfatória nessas escalas estudadas, uma vez que os dados TRMM subestimaram a precipitação total para todas as estações utilizadas no estudo. No entanto, para a modelagem hidrológica, foram obtidos valores aceitáveis para os coeficientes de eficiência avaliados apenas para as escalas de dez dias e mensal.
Palavras-chave:TRMM, modelagem hidrológica, Bacia do Rio Japaratuba.
1. Introduction
Rainfall is one of the most important variables in the hydrologic cycle, and is indispensable in climatological studies (Zhanet al., 2015). The understanding of its spatial
and seasonal variability in each region is essential for
agri-culture and for various sectors of the economy (FAO, 2015). Within this context, the reliability of the estimates of precipitation is of paramount importance (Silva et al.,
2012).
Countries with continental dimensions and low in-vestment capacity, such as Brazil, have problems of meteo-Artigo
rological station coverage (Bassoet al., 2015). Thus,
hy-drologists have sought alternatives to estimate precipitation values, such as remote sensing (Collischonnet al., 2007).
Rainfall estimates from remote sensors have been ob-tained through various projects around the globe and the products available are constantly improving as new tech-niques of production and correction of the final information emerge (Tapiador et al., 2012; Liu, 2015). Precipitation
data at different temporal and spatial scales are available via an Internet, such as: PERSIANN-CDR (Ashouriet al.,
2015), CMORPH (Jianget al., 2012), NCEP (Philbin &
Jun, 2015) and TRMM/TMPA (Liu, 2015), CHIRPS (Pa-redeset al., 2017).
Many studies that evaluate the quality and applicabil-ity of the data have been developed and applied in various regions, demonstrating which products have the greatest potential for use in different environments (Collischonnet al., 2007; Sapiano & Arkin, 2009, Leivaset al., 2014; Liuet al., 2015; Meloet al., 2015; Prat & Nelson, 2015; Paredes et al., 2017).
The Tropical Rainfall Measuring Mission (TRMM) was developed as a joint between NASA and National Space Development Agency of Japan mission to study tropical rainfall and its implications for climate (Shepherd
et al., 2002). The products supplied by the radar on the
TRMM satellite have been widely applied in studies in Brazil (Collischonnet al., 2007; Pereiraet al., 2013; Leivas et al., 2014); however, there are still only a few reports on
their applicability for hydrologic modeling in medium-sized basins located in the northeast region of the country, which is characterized by an irregular temporal and spatial rainfall regime (Silvaet al., 2011).
The Japaratuba river basin, in the state of Sergipe, Northeast of Brazil, is characterized by climate variability, presenting three climatic zones: semiarid in headwaters, agreste in the most part of the basin and humid coastline in the lowest portion. This basin has a low density of pluvio-meters, which implies uncertainties in the estimates of pre-cipitation, which is also apparent due to the water flow in regions where water is necessary to meet the demand for ir-rigation. Thus, the overall objective of this study is to assess the quality of the precipitation data of algorithm 3B42_V7 from the TRMM satellite within the context of hydrologic modeling of the Japaratuba river basin.
2. Materials and Methods
The Japaratuba river basin in Sergipe is located within the geographic coordinates (10°13’00’’ to 10°47’00’’ S and 36°48’00’’ to 37°19’00’’ W) (Fig. 1). Its main river is 135 km long and the basin has an area of 1685 km2(Aragão
et al., 2011). Twenty municipalities in
Sergipe are drained by the Japaratuba river basin, of which only five are fully within it (Capela, Carmópolis, Cumbe, General Maynard and Rosário do Catete). The population
of about 200,000 people is divided between 62.4% in the urban area and 37.6% in the rural area (Aragãoet al., 2013).
Three climatic zones are present in the basin: humid coastline (near the river mouth, with 1000 to 1400 mm of annual rainfall, concentrated in the period from April to August),agreste(the middle portion, 700 to 900 mm on
rainfall concentrated between April and August), and semi-arid (the headwaters, 400 to 700 mm of rainfall con-centrated between January and May). The average annual temperature is 25 °C. The relative air humidity is 74%. Of the total area of the basin, 9.63% belongs to the semi-arid region, 30.18% to the humid coastline and 60.17% is lo-cated inagreste(Aragãoet al., 2013).
In the Japaratuba river basin, Acrisol type soils pre-dominate (about 75% of the area of the basin), followed by Latosols, fluvic Neosols and Vertisols. The presence of ag-ricultural activities characterizes the use and coverage of the soil, with emphasis on pasture (about 50% of the basin area) and agricultural crops (sugar cane, corn and fruit plants, which accounts for about 25% of the area). In addi-tion to these, there are also mining activities (oil and potas-sium), exposed soils and urban areas. Consequently, the native vegetation is gradually being reduced, totaling 15% of the area of the basin. The water potential is low and has been greatly affected by the various uses of the land (Ara-gãoet al., 2013).
The analysis performed in this study used the follow-ing data: observed daily precipitation (OP) at three rain
gauges installed in the basin; observed daily flow (OQ) at a
fluviometric station in the main river; estimated daily pre-cipitation (EP) from the TRMM satellite; physical
parame-ters of the adjacent basin (area, length and declivity) for the mathematical simulation of flows (estimated flow, EQ).
OP values were obtained from the Capela (Code
1037078), Fazenda Cajueiro (Code 1036063) (ANA, 2014) and Aquidabã (Code 31782) (INPE, 2014) stations (Fig. 1). These were compared with theEP(TRMM) on three
tem-poral scales: daily, every ten days and monthly. For Capela and Fazenda Cajueiro the period from 1998 to 2013 was used, and for Aquidabã the periods from 2004 to 2013 was used. The TRMM 3B42 data (EP) is available from 1998
until 2013, and it is available in the NASA homepage. The OQ values were taken from the Japaratuba fluviometric station (Code 50040000, 735 km2area) (ANA, 2014) for the period between February 10, 2004 and Janu-ary 31, 2007. These data were compared with those simu-lated (EQ) by the WIN_IPH2 rain-flow model (Bravoet al., 2009) after the calibration of its parameters, also for the three timescales, and considering the specific and average rainfall over the basin. Evapotranspiration data were esti-mated based on Sousaet al.(2010). The WIN_IPH2 model can be requested to Climate and Water Resources Section in the Hydraulic Research Institute (IPH) homepage.
sam-pling, with data estimated every three hours and a spatial resolution of 0.25° between 50° N and 50° S (NASA, 2014). More information about formats and means of ob-taining the data can be obtained from NASA (2014). To en-compass the entire area of study, 16 points of the TRMM grid were selected.
The analysis was developed through the comparison between precipitations (OPand EP) and flows (OQ and EQ).EP was evaluated considering specific and average
values. For the specific values, in the same geographical coordinates of the rain gauge stations, interpolation through the inverse-square-distance was applied considering the in-fluence of four points from the TRMM grid. The inverse-square-distance was evaluated by cross-validation tech-nique in TRMM grid and show it adequate to interpolate precipitation data in this basin. For the average weighting of the EP in the basin, a method similar to Thiessen poly-gons was used. To do so, the areas of influence in the basin for the 16 centroids selected from the TRMM grid, were de-termined and the proportion between each centroid influ-ence area and the total area of the basin was used as weight for the average rainfall calculation.
Due to the number of variables involved in the pro-cess of rainfall-runoff modeling and considering that the objective of this work is to evaluate the possibility of using the TRMM-estimated precipitation in hydrologic model-ing, a simple model with few parameters that could be cali-brated automatically or semi-automatically was applied, thereby reducing the condition of uncertainty through par-simony. Thus, the historical series of estimated flow rates (EQ) were generated fromOPandEPthrough the
calibra-tion of the WIN_IPH2 rainfall-runoff model for the contin-uous series (Tucci, 1997; Bravoet al., 2009).
The IPH2 model, in its version for OS Windows, is widely applied in medium-sized basins in Brazil, mainly due to its simplicity and open source nature. In the model, among the existing parameters, seven parameters are re-lated with the rain-flow transformation processes:
Io = maximum infiltration capacity of the soil (mm/Dt);
lb= minimum infiltration capacity of the soil (mm/Dt);h= parameter of decay of infiltration in the soil (dimen-sionless);Ks= parameter of propagation of surface runoff
ionless parameter for simulation of continuous series (Tuc-ci, 1997; Bravoet al., 2009; Bravoet al., 2012).
In this study, we used the automatic calibration method for genetic algorithms (Shuffled Complex Evolution -SCE-UA), which already comes with the WIN_IPH2 model (Bravoet al., 2012). Calibration adjusts the seven
parameters within a pre-defined variation interval, ensuring their physical representability. It was chosen to optimize the parameters so that the Nash-Sutcliffe (NS) parameter,
which is widely applied in efficiency tests for various types of hydrological models (Sharad & Sudheer, 2008), reached values greater than 0.5, which according to Moriasiet al.
(2007) is the most suitable for this type of modeling. Five hundred iterations were used in all the calibrations to en-sure global optimization.
Calibration was performed in four ways for each timescale, thereby totaling 12 procedures. The four steps were carried out using as input data: punctual precipitations (C1 - Capela rain gauge data, and C2 - ISD from TRMM in Capela rain gauge geographic coordinates) and average precipitations (C3 - three rain gauges, and C4 - TRMM grid over all basin area), contrasting with the flows recorded (OQ) at the Japaratuba fluviometric station. The Capela
rain gauge was selected for C1 because of its location, close to the center of the sub-basin and adjacent to the fluvio-metric station.
Evaluation of the quality of the estimates ofEPand EQused the following efficiency indicators: Pearson
corre-lation index (r), Nash-Sutcliffe coefficient (NS) and
aver-age percentaver-age error of volume (EV), as indicated by
Mo-riasiet al.(2007).
3. Results and Discussion
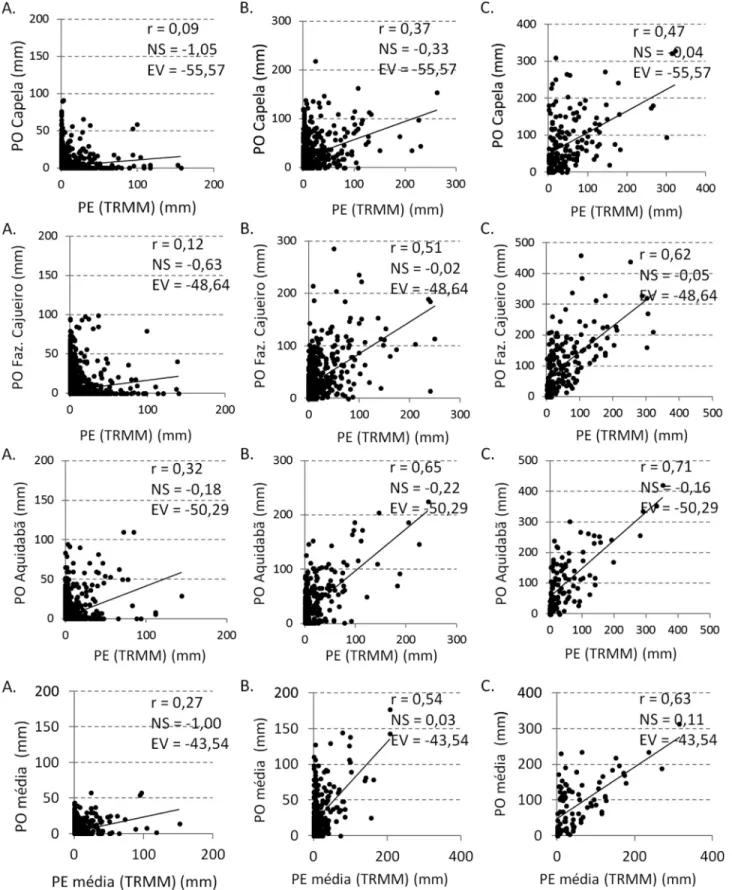
Considering the precipitation data and daily time scale, the efficiency coefficients demonstrate a very low correlation for all pluviograph stations (Table 1). Figure 2 (A) shows the scatter plots ofEP vs. OPat this timescale.
The three efficiency indicators confirm the visual analysis and have non-satisfactory values, as shown in Table 1. The Aquidabã rain gauge has the best results, especially forr
(0,32); however, the EV value has underestimated values, at near 50%, for all stations.
Considering the values determined over ten days, the efficiency indexes had improved, though are still not yet satisfactory (Fig. 2 (B) and Table 1). On this scale, the Aquidabã station still has the highestrvalue (0.65),
fol-lowed by Fazenda Cajueiro (0,51); the best value forNSis
still very low (< 0.50). The r value for Aquidabã
ap-proached that which Moriasiet al.(2007) considered to be
acceptable (r= 0.7).EVis still the same, for dealing with
the accumulated data only. Compared with the ten-day scale, the monthly scale shows improvement in some of the indicators: at Aquidabã there is improvement inr(0.71),
and at Fazenda Cajueiro (r= 0.62); however, there are still
not satisfactory values forNSandEV(Table 1).
For average precipitation (Fig. 2 (C) and Table 1), the efficiency indicators show improved values in relation to the analysis of data for the Capela and Fazenda Cajueiro stations, and near for Aquidabã station coefficients. It is noted thatEV decreased, but is still high and
underesti-mated. Thervalues also improved, indicating a possible
compensation error for studies in larger areas. Silvaet al.
(2012) presented similar results for the Northeast Region of Brazil.
In general the coefficients are not fully satisfactory on any temporal scale, however, an improvement in the results was observed proportional to the increase in temporal scale. Such behavior was also observed in other studies devel-oped in Brazil (Pereiraet al., 2013; Oliveiraet al., 2014;
Almeidaet al., 2015).
Unlike what was reported by Collischonn et al.
(2007) and Pereiraet al.(2013), this study detected the
un-derestimation of precipitation by the TRMM. Such behav-ior may be associated with the characteristics of the preci-pitation in the region of study, with high concentrations in a few months and predominance of long-term frontal rain-fall of medium intensity, and of convective rainrain-fall, with higher intensity in the periods of less rain. Recently, Paredeset al.(2017) reported similar underestimation of
rainfall, considering CHIRPS data (product calibrated with TRMM 3B42 V7) over entire Brazilian Northeast re-gion.
In the evaluation of theEQ(Estimated Flow)
result-ing from the calibration of WIN_IPH2, rain gauges rainfall (C1 and C2) and average rainfall (C3 and C4) scenarios, considering the daily scale, values of the efficiency indica-torsrandNSare still below the ideal (Table 2), but show
significant improvement compared with the previous anal-ysis related only to precipitation.EVon the other hand is
within acceptable limits (±25%). These results corroborate the assertion that the remote precipitation data holds
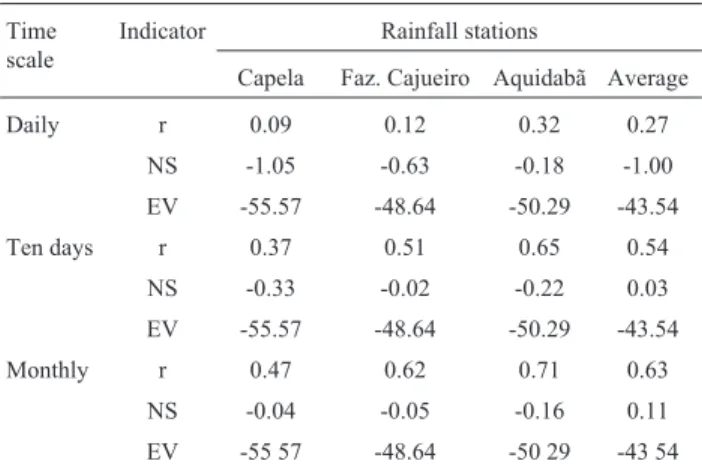
poten-Tabela 1- Efficiency indicators for estimate ofEP vs. OPin each station and the average of stations in the Japaratuba river basin considering the time scales: daily, ten days and monthly.
Time scale
Indicator Rainfall stations
Capela Faz. Cajueiro Aquidabã Average
Daily r 0.09 0.12 0.32 0.27
NS -1.05 -0.63 -0.18 -1.00
EV -55.57 -48.64 -50.29 -43.54
Ten days r 0.37 0.51 0.65 0.54
NS -0.33 -0.02 -0.22 0.03
EV -55.57 -48.64 -50.29 -43.54
Monthly r 0.47 0.62 0.71 0.63
NS -0.04 -0.05 -0.16 0.11
EV -55 57 -48.64 -50 29 -43 54
tial for hydrological studies, although they do not show ex-cellent correspondence with the field data, since it may better represent the spatial distribution of rain to larger
ar-eas (Collischonnet al., 2007; Nóbregaet al., 2008; Pereira et al., 2013). Thus, the performance of the satellite data
(C2) surpassed the rain gauges data on the daily scale:NS=
0.40;r= 0.65 andEV= 6.86, all of which are better than
those obtained for C1 (Table 2).
As in the analysis of precipitation data accumulated during 10 days, here the efficiency indicators were better than those obtained on the daily scale (Table 2). It is ob-served, however, on this 10-day time scale, that the precipi-tation used in C1 had better performance than in C2, for bothNS(0,78) andr(0.89), only for the indicatorEVthe
simulation with the satellite data was better, however the value for C1 may also be considered very good (-2.94%).
On the monthly scale, the values ofNSandrare better
than those found for the 10-day scale. It should be stressed that the coefficients obtained on this scale were very good both for C1 (NS= 0.84 andr= 0.93) and C2 (NS= 0.60 and r= 0.79). This indicates the potential for using remote data
on the 10-day and monthly scales.EVincreased for both,
and C1 had a higher value (undervalued in 15.29%) than C2 (overvalued in 14.43%). This result indicates the need of
better evaluation concerning the objective function in the process of automatic optimization for calibration and as-sessment, for example, the use of multi-objective analysis techniques, once it was selected only Nash-Sutcliffe effi-ciency index to hydrological model calibration in this study (Bravoet al., 2009).
Observing Fig. 3 as an example of calibration for 10-day time scale, it is possible to see that the model has a good representation of the seasonality in the basin, mainly for C1. In C2, despite also having good visual adjustment, there is divergence for low flow peaks (OQ) due to rains not
detected by the TRMM satellite (C2).
For the scenarios with average of precipitation data (C3 and C4) were found coefficients near to values for C1 and C2 scenarios on the daily time scale (Table 2). Thus, there was improved performance of satellite data (C4) com-pared with the rain gauges (C3) in all the coefficients at this scale. An example of hydrographs for the 10-day scale is presented in Fig. 4 and these do not show significant varia-tion in relavaria-tion to the punctual modeling (Fig. 3).
Considering the daily simulation of punctual and av-erage precipitations (Table 2) it is observed that there was improvement in the efficiency indicators; however,NS
re-mains below 0.50. In this case, C4 was very close to the sat-isfactory limits.
For the values accumulated over 10 days, C4 showed better results than the average of the rain gauges (C3) for
NSandr(0.50 and 0.76, respectively). ForEV, a diverse
be-havior was noted, with overestimation in C3 (11.37) and underestimation in C4 (11.06). It should be emphasized that the objective function selected for calibration was maximizingNS, which may have interfered in the values of
the other coefficients evaluated.
On the monthly scale, for the average values, the co-efficients were similar for C3 and C4, with slight superior-ity for C4, with the exception ofEV(-12.10) (Table 2). The
values in C3 and C4 showed improvements in comparison with the values accumulated during 10 days, most
notice-Tabela 2- Efficiency indicators toEQ(Estimated Flow)vs. OQ
(Ob-served Flow) for different precipitation scenarios in the Japaratuba river basin considering the time scales: daily, ten days and monthly.
Time scale
Indicator Precipitation scenarios applied to hydrological modeling
C1 C2 C3 C4
Daily r 0.55 0.65 0.54 0.69
NS 0.29 0.40 0.29 0.47
EV -10.99 -6.86 -7.61 -4.45
Ten days r 0.89 0.75 0.62 0.76
NS 0.78 0.56 0.35 0.50
EV -2.94 -0.65 11.37 -11.06
Monthly r 0.93 0.79 0.83 0.84
NS 0.84 0.60 0.69 0.70
EV -15.29 14.43 8.62 -12.10
r -Pearson Correlation Coef.; NS - Nash-Sutcliffe Coef.; EV - Percent Vol-ume Error.
ably in C3. Like the punctual precipitation data, the average values on a monthly scale had satisfactory efficiency coef-ficients, which implies that they could be used for modeling purposes.
Still analyzing Table 2, it can be noted that overall the results for average TRMM (C4) had betterNSandr
coeffi-cients at all timescales compared with punctual TRMM (C2), with the single except ofNSat the 10-day scale.
Re-garding the field data (C1 and C3), contrary to the TRMM, the coefficients were better for punctual precipitation than for average rainfall in almost all cases, with daily and monthlyEVbeing the only exception. This may indicate
that the chosen pluviograph station is spatially and tempo-rally representative of the precipitation that occurs in the monitored sub-basin, once losses having been noted when performing the weighted average within other rain gauges.
4. Conclusions
1. The direct comparative analysis between the field and satellite precipitation did not indicate the suitability of the TRMM data for any of the selected indicators in the Japaratuba river basin, but does indicate great improvement in the correlation coefficient (r) for monthly scale average
precipitation, as compared to other temporal scales;
2. The precipitations derived from the TRMM under-estimated the precipitation values for all rain gauges used in the study;
3. The analysis on the estimate of flows showed better values for the efficiency indicators on all temporal scales compared with the direct comparison between precipita-tions;
4. For hydrologic modeling, acceptable values were only obtained for the efficiency coefficients evaluated for the TRMM scenarios on the 10-day and monthly time scales.
References
ANA.Portal Hidroweb. Agência Nacional de Águas. Disponível
em: www.hidroweb.ana.gov.br. Acesso em: Jun. 2014. ALMEIDA, C.T.; DELGADO, R.C.; OLIVEIRA JUNIOR, J.R.;
GOIS, G.; CAVALCANTI, A.S. Avaliação das Estimativas de Precipitação do Produto 3B43-TRMM do Estado do Amazonas.Floresta e Ambiente, v. 22, n. 3, p. 279-286,
2015.
ARAGÃO, R.; CRUZ, M.A.S.; AMORIM, J.R.A.; MENDON-ÇA, L.C.; FIGUEIREDO, E.E.; et al. Análise de
sensibi-lidade dos parâmetros do modelo SWAT e simulação dos processos hidrossedimentológicos em uma bacia no agreste nordestino.Revista Brasileira de Ciência do Solo v. 37, n. 4, p. 1091-1102, 2013.
ARAGÃO R.; ALMEIDA, J.A.P.; FIGUEIREDO, E.E.; SRI-NIVASAN; V.S. Mapeamento do potencial de erosão lami-nar na Bacia do Rio Japaratuba, SE, via SIG.Revista Bra-sileira de Engenharia Agrícola e Ambiental, v. 15, n. 7, p. 731-740, 2011.
ASHOURI, H.; HSU, K.; SOROOSHIAN, S.; BRAITHWAITE, D.; KNAPP, K. R.;et al.PERSIANN-CDR: Daily
precipita-tion climate data record from multi-satellite observaprecipita-tions for hydrological and climate studiesBulletin of the American Meteorological Society, v. 96, n. 1, p. 69-83, 2015. BASSO, R.; ALLASIA, D.; TASSI, R.; BAYER, D.M. Sub-daily
extreme events distribution and changes in Northeastern Brazil in the 20th century. Proceedings IAHS, v. 369,
p. 135-140, 2015.
BRAVO, J.M.; COLLISCHONN, W.; TUCCI, C.E.M. Verifi-cação d eficiência e eficácia de um algoritmo evolucionário multi-objetivo na calibração automática do modelo hidrológico IPH II. Revista Brasileira de Recursos Hí-dricosv. 14, n. 3, p. 37-50, 2009.
BRAVO, J.M; ALLASIA, D.; PAZ, A.; COLLISCHONN, W.; TUCCI, C. Coupled Hydrologic-Hydraulic Modeling of the Upper Paraguay River Basin.Journal of Hydrologic Engi-neering, v. 17, n. 5, p. 635-646, 2012.
COLLISCHONN, B.; ALLASIA, D.; COLLISCHONN, W.; TUCCI, C.E.M. Desempenho do satellite TRMM na esti-mativa de precipitação sobre a bacia do Paraguai superior.
Revista Brasileira de Cartografia, v. 59, n. 1, p. 93-99,
2007.
FAO. Brazilian agriculture: Prospects and challenges. In:
OECD-FAO Agricultural Outlook 2015, OECD Publishing, Paris. Disponível em: http://dx.doi.org/10.1787/agr_out-look-2015-5-en. Acesso em Fev. 2016.
INPE. Sistema Integrado de Dados Ambientais - SINDA.
Instituto Nacional de Pesquisas Espaciais. Disponível em: http://sinda.crn2.inpe.br/. Acesso em: Jun. 2014.
JIANG, S.; REN, L.; HONG, Y.; YONG, B.; YANG, X.et al.
Comprehensive evaluation of multi-satellite precipitation products with a dense rain gauge network and optimally merging their simulated hydrological flows using the Bayesian model averaging method,Journal of Hydrology, v. 452-453, p. 213-225, 2012.
LEIVAS, J.F.; RICARDO, G. A.; DANIEL, C. V.; FABIO, E. T.; EDSON, L. B. Monitoramento da seca 2011/2012 no nor-deste brasileiro a partir do satélite SPOT-Vegetation e TRMM. Engenharia Agrícola, v. 22, n. 3, p. 211-221, 2014.
LIU, J.; DUAN, J.; JIANG, J.; ZHU, A. Evaluation of Three Satel-lite Precipitation Products TRMM 3B42, CMORPH, and PERSIANN over a Subtropical Watershed in China. Ad-vances in Meteorology, v. 2015, p. 1-13, 2015.
LIU, Z. Comparison of precipitation estimates between Version 7 3-hourly TRMM Multi-Satellite Precipitation Analysis (TMPA) near-real-time and research products. Atmo-spheric Research,v. 153, p. 119-133, 2015.
MELO, D.D.C.; XAVIER, A.C.; BIANCHI, T.; OLIVEIRA, P.T.; SCANLON, B.R. et al. Performance evaluation of rainfall estimates by TRMM Multi-satellite Precipitation Analysis 3B42V6 and V7 over Brazil.Journal of Geophys-ical Research: Atmospheres, v. 120, n. 18, p. 9426-9436,
2015.
MORIASI, D.N.; ARNOLD, J.G.; VAN LIEW, M.W.; BIN-GNER, R.L.; HARMEL, R.D. et al. Model evaluation
guidelines for systematic quantification of accuracy in wa-tershed simulations.Transactions of the ASABE, v. 50,
p.885-900, 2007.
NASA.Tropical Rainfall Measuring Mission. National Aero-nautics and Space Administration. Disponível em: http://trmm.gsfc.nasa.gov/ data_dir/data.html. Acesso em : Jun. 2014.
NÓBREGA, R.S.; SOUZA, E.P.; GALVÍNCIO, J.D. Análise da estimativa de precipitação do TRMM na Sub- Bacia da Amazônia ocidental.Revista de Geografia, v. 25, n.1, p. 6-20, 2008.
OLIVEIRA JR., J.R.; DELGADO, R.C.; GOIS, G.; LANNES, A.; DIAS, F.O.et al. Análise da precipitação e sua relação com sistemas meteorológicos em Seropédica, Rio de Janeiro.
Floresta e Ambiente, v. 21, n. 2, p. 140-149, 2014. PAREDES, F.T.; BARBOSA, H.A.; KUMAR, L.V. Validating
CHIRPS-based satellite precipitation estimates in Northeast Brazil.Journal of Arid Environments, v. 139, p. 26-40, 2017.
PEREIRA, G.; SILVA, M.E.S.; MORAES, E.C.; CARDOZO, F.S. Avaliação dos Dados de Precipitação Estimados pelo
Satélite TRMM para o Brasil. Revista Brasileira de Recursos Hídricos, v. 18, n. 3, p. 139-148, 2013.
PHILBIN, R.; JUN, M. Bivariate spatial analysis of temperature and precipitation from general circulation models and obser-vation proxies.Advances in Statistical Climatology, Me-teorology and Oceanography, v. 1, p. 29-44, 2015. PRAT, O.P.; NELSON, B.R. Evaluation of precipitation
esti-mates over CONUS derived from satellite, radar, and rain gauge data sets at daily to annual scales (2002-2012). Hy-drology and Earth System Sciences, v. 19, p. 2037-2056, 2015.
SAPIANO, M.R.P.; ARKIN, P.A. An intercomparison and vali-dation of high-resolution satellite precipitation estimates with 3-hourly gauge data.Journal of Hydrometeorology, v. 10, p. 149-166, 2009.
SHARAD, K. J.; SUDHEER, K. P. Fitting of Hydrologic Models: A Close Look at the Nash-Sutcliffe Index. Journal of Hydrologic Engineering, v. 13, n. 10, p. 981-986, 2008. SHEPHERD, J.M.; PIERCE, H.; NEGRI, A.J. Rainfall
modifica-tion by major urban areas: Observamodifica-tions from spaceborne rain radar on the TRMM satellite.Journal of Applied Me-teorology and Climatology, v. 41, n. 7, p. 689-701, 2002. SILVA, V.P.R; PEREIRA, E.R.R.; AZEVEDO, P.V.; SOUSA,
F.A.S.; SOUSA, I.F. Análise da pluviometria e dias chuvo-sos na região Nordeste do Brasil. Revista Brasileira de Engenharia Agrícola e Ambiental, v,15, n. 2, p. 131-138,
2011.
SILVA, V.P.R.; PEREIRA, E.R.R.; ALMEIDA, R.S.R. Estudo da variabilidade anual e intra-anual da precipitação na re-gião nordeste do Brasil.Revista Brasileira de Meteoro-logia, v. 27, n. 2, p. 163-172, 2012.
SOUSA, I.F.; SILVA, V.P.R.; SABINO, F.G.; NETTO, A.O.A.; SILVA, B.K.N.; AZEVEDO, P.V. Evapotranspiração de referência nos perímetros irrigados do Estado de Sergipe.
Revista Brasileira de Engenharia Agrícola e Ambiental, v,14, n. 6, p. 633-644, 2010.
TAPIADOR, F.J.; TURK, F.J.; PETERSEN, W.; HOU, A.Y.; GARCÍA-ORTEGA, E.et al.Global precipitation
measure-ment: methods, datasets and applications,Atmospheric Re-search, v. 104-105, p. 70-97, 2012.
TUCCI, C.E.M.Hidrologia: ciência e aplicação. 2. ed. Porto
Alegre: Editora da Universidade Federal do Rio Grande do Sul/ABRH, 1997.
ZHAN, W., PAN, M., WANDERS, N., WOOD E. F. Correction of real-time satellite precipitation with satellite soil moisture observations. Hydrology and Earth System Sciences,
v. 19, p. 4275-4291, 2015.
Internet Resources
NASA: https://pmm.nasa.gov/data-access/downloads/trmm IPH: http://www.ufrgs.br/iph.