Corresponding Author:Fernanda Cristina Winckler. e-mail: [email protected]
Received 11 April 2018 Accepted 13 September 2018
Major Article
Influence of the inflammatory response on treatment of
hepatitis C with triple therapy
Fernanda Cristina Winckler
[1], Aline Marcia Marques Braz
[2], Vanessa Nogueira da Silva
[1],
Marjorie de Assis Golim
[2], Vanessa Gutierrez de Andrade
[1],
Paulo Eduardo de Abreu Machado
[1],[2], Liciana Vaz de Arruda Silveira
[3]and Giovanni Faria Silva
[1][1]. Departamento de Clínica Médica, Faculdade de Medicina de Botucatu, Universidade Estadual Paulista, Botucatu, SP, Brasil. [2]. Laboratório de Citometria de Fluxo, Hemocentro, Universidade Estadual Paulista, Botucatu, SP, Brasil.
[3]. Departamento de Bioestatística, Instituto de Biociências, Universidade Estadual Paulista, Botucatu, SP, Brasil.
Abstract
Introduction: Chronic hepatitis C is a leading cause of liver disease. Infection triggers an immediate immune response in the host that is mediated by humoral/cellular mechanisms. T cells respond to infection via secretion of cytokines, which inhibit or stimulate one another, leading to cytokine imbalance and ultimately affecting treatment. Studies using interferon (IFN) and ribavirin (RBV) showed that TCD8+ cells and cytokine levels are associated with sustainable virological response (SVR). However, studies that investigated the effects of triple therapy (TT) are limited. Methods: The study included hepatitis C virus (HCV)+ RNA, naives, genotype 1, ≥18 years, and advanced fibrosis (F≥3) patients. Samples were collected at baseline and after
12 weeks (W12) of TT. Six cytokines were analyzed by flow cytometry. Results: Of 31 patients, four were excluded (two deaths, one interrupted TT, and one F2 patient). Of the 27 remaining patients, 21 (78%) were cirrhotic. SVR was achieved in 63% of the patients. The patients had a mean age of 55.11 ± 10.03 years. Analyses at baseline showed that the chemokine CCL5/Regulated on Activation, Normal T Cell Expressed and Secreted (RANTES) (p=0.04) and interleukin (IL)-6 (p=0.02), which was associated with SVR. RANTES (p=0.04) and IL-8 (p=0.01) levels were associated with SVR at W12. Conclusions: Similar to patterns observed during double therapy, IL-6, IL-8, and RANTES levels were associated with SVR in TT, indicating the potential role of interferon in immune response to hepatitis C virus.
Keywords: Hepatitis C. Cytokine. Treatment.
INTRODUCTION
A total of 184 million people, corresponding to 3% of the world population, are estimated to be infected with the hepatitis C virus1. Infection with hepatitis C virus is considered to be one
of the major causes of liver disease and leads to the development of cirrhosis and hepatocellular carcinoma2.
Dual therapy with petylated interferon (PegIFN) and rivabirin was considered the standard treatment for chronic hepatitis C until the middle of 2011. However, low SVR rates
were observed in patients with genotype 1, advanced fibrosis,
and cirrhosis3-6. SVR is characterized by the absence of HCV
RNA (undetected viral load or <12 IU/mL) by polymerase chain reaction at 24 weeks after completion of PegIFN-based therapy7.
In 2011, a new class of drugs became available that included the protease inhibitors (PIs) Boceprevir and Telaprevir, which
were administered during TT in combination with PegIFN and RBV. Treatment with TT increased SVR rates but was not
sufficiently effective, especially in patients with cirrhosis8,9.
Other factors, including the IR, are associated with low SVR rates10. Several studies have attempted to further investigate the mechanisms underlying the above findings11-15; however, the
results remained ambiguous and controversial.
Infection with the hepatitis C virus triggers an immediate immune response in the host, which involves humoral and cellular mechanisms16.
The T cell response is mediated by the secretion of cytokines, which participate in a molecular cascade wherein the cytokines can stimulate or inhibit one another, eventually causing cytokine imbalance17,18. In turn, cytokine imbalance leads to sustained inflammation and the development of liver fibrosis19,20.
One study indicated that the poor response of CD4 and CD8 T cells observed during chronic infection could be attributed to immunological tolerance in the liver21.
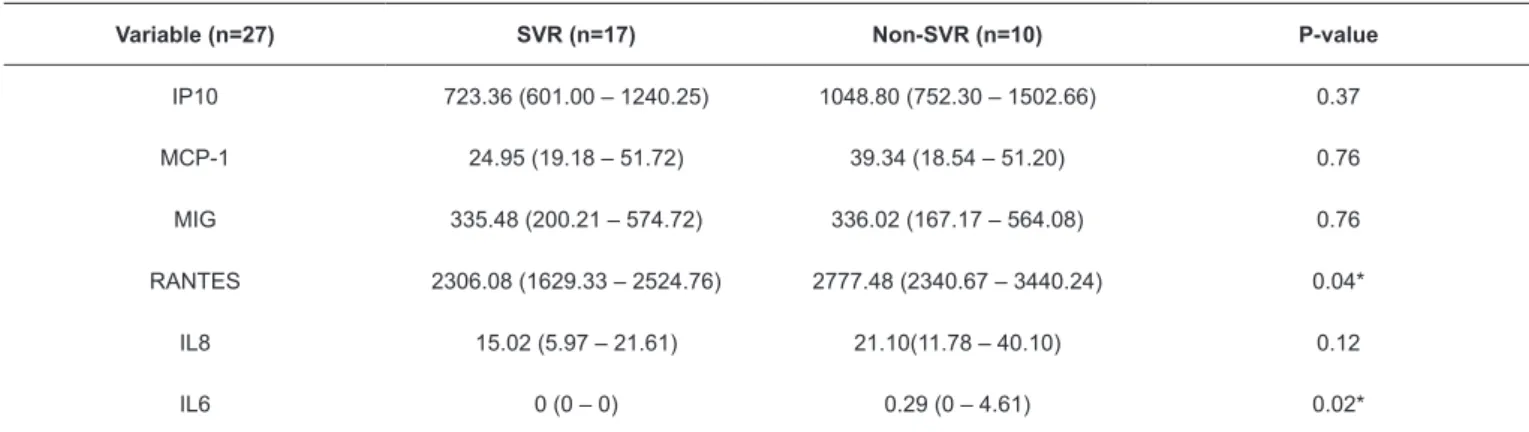
TABLE 1: Comparison of cytokine and chemokine levels between SVR and non-SVR patients undergoing triple therapy at the baseline period.
Variable (n=27) SVR (n=17) Non-SVR (n=10) P-value
IP10 723.36 (601.00 – 1240.25) 1048.80 (752.30 – 1502.66) 0.37 MCP-1 24.95 (19.18 – 51.72) 39.34 (18.54 – 51.20) 0.76 MIG 335.48 (200.21 – 574.72) 336.02 (167.17 – 564.08) 0.76 RANTES 2306.08 (1629.33 – 2524.76) 2777.48 (2340.67 – 3440.24) 0.04* IL8 15.02 (5.97 – 21.61) 21.10(11.78 – 40.10) 0.12 IL6 0 (0 – 0) 0.29 (0 – 4.61) 0.02*
SVR: virological response. Interleukin (IL)-6, IL-8, regulated on activation normal T cell expressed and secreted (RANTES), monocyte chemotactic protein-1
(MCP-1), monokine induced by gamma IFN (MIG) and IFN gamma-induced protein 10 (IP-10). Results are expressed as a median and interquartile range (25; 75). T helper (Th)1 response in the baseline period, and the increase
in Th2 cytokines during treatment may define treatment success
or failure11,14,23,24. These studies were performed on patients
treated with dual therapy (IFN alpha or PegIFN and RBV). Regardless of the treatment response of the patient, the levels of certain cytokines and chemokines were found to be upregulated in response to stimulation by IFN. However, IFN treatment
could significantly alter the host response to treatment.
The present study aimed to evaluate whether the RVS is
influenced by the IR by analyzing chemokine levels in patients
undergoing TT treatment.
METHODS
The prospective study was conducted at the Botucatu Medical School (FMB/UNESP) from September 1, 2014 to July 30, 2016. The study was approved by the Research Ethics Committee of the hospital.
The inclusion criteria were as follows: naive, genotype
1, fibrosis 3 or 4 (METAVIR score system25) patients, male and female genders, ≥18 years old, candidates for TT (PIs:
Boceprevir or Telaprevir), and treatment completion. Patients
with hepatitis B and/or human immunodeficiency virus (HIV)
co-infection, pregnant women, and users of illicit drugs and alcohol were excluded.
Samples were collected at two time points (baseline and W12
of treatment). Patients were stratified into two groups, namely,
the G1 and G2 groups, according to their virologic response (G1: SVR and G2: non-SVR).
Plasma cytokine and chemokine levels [IL-6, IL-8, monocyte chemotactic protein-1 (MCP-1), RANTES, monokine induced by IFN gamma (MIG), and IFN gamma-induced protein
10 (IP-10)] were quantified at two time points of treatment.
Comparative analyses were performed by evaluating the cytokine and chemokine levels between the two groups at the same time point (G1 × G2 – baseline; G1 × G2 – W12) and between the two treatment points within the same group (G1 – baseline × W12; G2 - baseline × W12).
Statistical tests were performed using SAS software version
4.0 for Windows. P<0.05 was considered statistically significant.
Fisher's exact test was used for association analyses. The Kruskal-Wallis nonparametric test was used to compare the variables when the data did not satisfy normality assumptions.
For sample collection, venous blood was placed in two tubes containing ethylenediamine tetraacetic acid (EDTA) (5 ml each). Samples were centrifuged for 10 min at 300 g, and aliquots of plasma were placed in Eppendorf® microtubes and subsequently frozen at –80 °C.
Cytokine and chemokine levels were analyzed by flow
cytometry following the CBA method using the kits CBA Human Chemokine (MCP-1, RANTES, IL-8, MIG, and IP-10) and Human IL-6 Flex Set.
Data were collected after obtaining informed consent from the patients. Informed consent was additionally obtained from a patient's legally authorized representative when the patient could not consent. The procedures were conducted in accordance with the Helsinki Declaration of 1975, which was revised in 1983. The present study was approved by the Ethics Committee of the Botucatu Medical School (Approval number of the ethics committee: 773.353).
RESULTS
A total of 31 patients were screened, out of which four were excluded because of the following reasons: two deaths, one interrupted treatment, and one patient was assigned to the F2 stage based on the METAVIR score.
Of the 27 remaining patients, 78% (21) were cirrhotic. The majority of patients were male (67%). The average age of the patients was 55.11±10.03. SVR, F4, and F3 were observed in 63%, 57% (12/21), and 83% (5/6) of all patients.
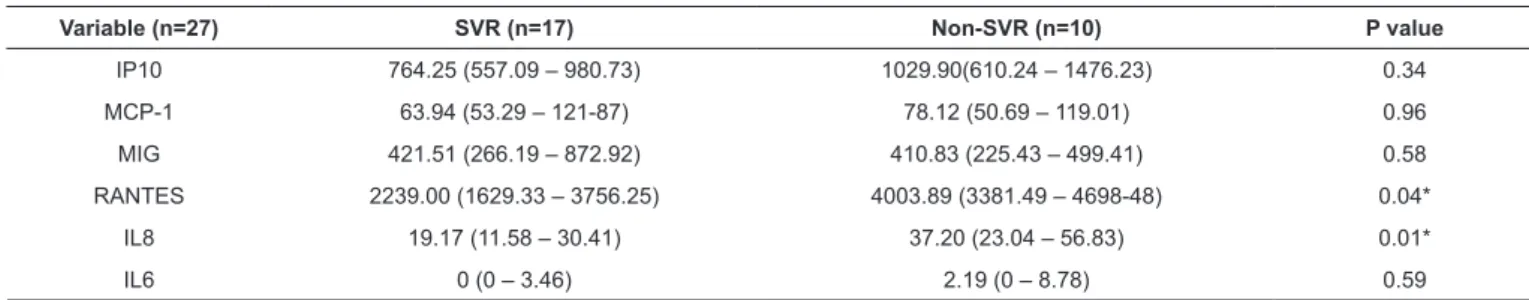
TABLE 2: Analysis of cytokine and chemokine levels between SVR and non-SVR patients undergoing triple therapy at W12.
Variable (n=27) SVR (n=17) Non-SVR (n=10) P value
IP10 764.25 (557.09 – 980.73) 1029.90(610.24 – 1476.23) 0.34 MCP-1 63.94 (53.29 – 121-87) 78.12 (50.69 – 119.01) 0.96 MIG 421.51 (266.19 – 872.92) 410.83 (225.43 – 499.41) 0.58 RANTES 2239.00 (1629.33 – 3756.25) 4003.89 (3381.49 – 4698-48) 0.04* IL8 19.17 (11.58 – 30.41) 37.20 (23.04 – 56.83) 0.01* IL6 0 (0 – 3.46) 2.19 (0 – 8.78) 0.59
SVR: virological response. Interleukin (IL)-6, IL-8, regulated on activation normal T cell expressed and secreted (RANTES), monocyte chemotactic protein-1
(MCP-1), monokine induced by gamma IFN (MIG) and IFN gamma-induced protein 10 (IP-10). Results are expressed as a median and interquartile range (25; 75).
TABLE 3: Analysis of cytokine and chemokine levels in SVR patients at baseline and W12.
Variable (n=27) Week 0 Week 12 P value
IP10 723.36 (601.00 – 1240.25) 764.25 (557.09 – 980.73) 0.89 MCP-1 24.95 (19.18 – 51.72) 63.94 (53.29 – 121-87) 0.001*
MIG 335.48 (200.21 – 574.72) 421.51 (266.19 – 872.92) 0.36 RANTES 2306.08 (1629.33 – 2524.76) 2239.00 (1629.33 – 3756.25) 0.38 IL8 15.02 (5.97 – 21.61) 19.17 (11.58 – 30.41) 0.26
IL6 0 (0 – 0) 0 (0 – 3.46) 0.02*
SVR: virological response. Interleukin (IL)-6, IL-8, regulated on activation normal T cell expressed and secreted (RANTES), monocyte chemotactic protein-1
(MCP-1), monokine induced by gamma IFN (MIG) and IFN gamma-induced protein 10 (IP-10). Results are expressed as a median and interquartile range (25; 75).
TABLE 4: Analysis of cytokine and chemokine levels in non-SVR patients at baseline and W12.
Variable (n=27) Week 0 Week 12 P value
IP10 1048.80 (752.30 – 1502.66) 1029.90(610.24 – 1476.23) 0.91
MCP-1 39.34 (18.54 – 51.20) 78.12 (50.69 – 119.01) 0.01*
MIG 336.02 (167.17 – 564.08) 410.83 (225.43 – 499.41) 0.62
RANTES 2777.48 (2340.67 – 3440.24) 4003.89 (3381.49 – 4698-48) 0.05*
IL8 21.10(11.78 – 40.10) 37.20 (23.04 – 56.83) 0.14
IL6 0.29 (0 – 4.61) 2.19 (0 – 8.78) 0.69
Interleukin (IL)-6, IL-8, regulated on activation normal T cell expressed and secreted (RANTES), monocyte chemotactic protein-1 (MCP-1), monokine induced by gamma IFN (MIG) and IFN gamma-induced protein 10 (IP-10). Results are expressed as a median and interquartile range (25; 75).
Table 2 shows the comparison of cytokine and chemokine levels between the G1 and G2 groups at the W12 time point. RANTES (p=0.04) and IL-8 (p=0.01) levels were downregulated
in the G1 group, and the observed differences were significantly
associated with SVR. Expression levels of other cytokines and chemokines were not associated with SVR, although some parameters were higher in the non SVR group.
Table 3 and Table4 show the comparison between the baseline and W12 time points in the G1 and G2 groups, respectively.
Table 3 (G1) shows significant differences in the plasma
levels of IL-6 (p=0.02) and MCP-1 (p=0.001) between the two different time points. Both treatment groups showed the upregulation of IL-6 and MCP-1 levels at W12. Although other parameters showed similar patterns, the observed differences
did not reach statistical significance. RANTES was the only
parameter that was downregulated at W12 relative to W0;
however, the observed difference was not statistically significant.
As shown in Table 4, the RANTES (p=0.05) and MCP-1
(p=0.01) levels were significantly different between the baseline
and W12 time points in the G2 group. Although the other
cytokines and chemokines showed no significant differences
between the two time points, an increase in W12 levels occurs
DISCUSSION
Elucidating the mechanisms underlying IR during the different treatment regimens for HCV is of great importance
because the SVR is influenced by the host IR, as previously
established by studies on patients undergoing dual therapy14,17,21,26. In particular, previous findings indicated that the production of
cytokines and chemokines plays an important role in the IR during HCV infection. However, there is limited knowledge on the IR during TT. Thus, there is a need to investigate whether the addition of PIs to PegIFN/RBV treatment alters cytokine and
chemokine profiles and whether the induced changes enhance
the host's response to the treatment.
IL-6 levels than those in the RVS group. Therefore, our findings
were consistent with previous studies showing that the cytokine levels were associated with double therapy and that IFN
influenced cytokine behavior27,28. Lower baseline RANTES
levels were observed in the RVS group (Table 1), consistent with
the findings reported in an independent study that investigated
patients who received dual therapy29. However, another study30
reported that high RANTES levels at baseline were associated
with SVR in dual therapy in patients with low fibrosis (F≤2).
On the other hand, our subjects included 78% cirrhotic patients
and 22% advanced fibrosis patients.
Our current findings showed that patients with higher levels
of IP-10 at baseline did not reach SVR and were not associated with SVR. Nevertheless, some studies indicated that low serum levels of IP-10 at baseline were associated with SVR during dual therapy31-34.
Baseline IL-8 levels were higher in the non-SVR group compared to those in the SVR group, but the differences did not
reach statistical significance. Studies have shown that increased
serum IL-8 levels were associated with non-response to IFN-based treatment and disease progression35,36.
Table 2 shows the analysis of IL-8 and RANTES levels with SVR at W12. The patient group with lower IL-8 levels reached SVR.
The chemokine IL-8 is an important member of the chemokine CXC family. The key function of IL-8 is to attract polymorphonuclear cells to sites of tissue injury and inflammation. IL-8 is synthesized by several cell types, including monocytes, macrophages, Kupffer cells, hepatocytes, and hepatic stellate cells35-37. IL-8 levels are upregulated in the
peripheral blood and liver, thereby indicating that increased
tissue infiltration and macrophage-induced hepatic activation are
mediated by the interaction between IL-8 and CXCR-1 during hepatitis C infection35.
RANTES levels were found to be associated with SVR in W12 (Table 2), similar to baseline levels (Table 1). These results were contradictory to those of a previous study on patients undergoing dual therapy,29 in which RANTES levels
were not associated with SVR, although RANTES levels were upregulated during treatment in patients who did not achieve
SVR. Multiple studies reported different effects of IFN- α on
RANTES expression in different cell types38, 39.
More recently, two studies on patients subjected to TT
evaluated the influence and behavior of IP-10 chemokines in
SVR. One study evaluated 15 patients at different time points during the treatment period and did not identify differences in IP-10 chemokine levels between the SVR and non-SVR groups40.
Another study evaluated 97 patients at baseline and showed that IP-10 levels were associated with SVR41. Our results showed no
association between IP-10 and SVR in any of the evaluated time points. However, patients in the SVR group were observed to have lower IP-10 levels at both time points. Analysis of a larger sample
size are likely to reproduce the above findings.
Median cytokine levels of patients in the SVR group were evaluated at baseline and W12 (Table 3). Notably, MCP-1 and
IL-6 levels were significantly different between the two time
points. A previous study assessed HIV co-infected patients and observed that high IL-6 levels were associated with
therapeutic failure with IFN-α42. Another study showed that IL-6 levels were decreased during IFN-α treatment in patients
who reached SVR. Similar changes were observed among non-SVR patients, although IL-6 levels were restored at the end of the dual treatment43.
MCP-1 chemokines are known to play roles in the chemotactic recruitment of monocytes. Our current results showed that MCP-1 levels were upregulated with the independent response found in TT during treatment (Table 3
and Table 4). A previous study reported similar findings during
dual therapy treatment.44 However, another study45 indicated that
the same pattern was observed only in SVR patients.
Table 4 compares the variables in the non-SVR group between the baseline and W12. Both MCP-1 and RANTES
levels were significantly different between the two time points. The chemokine RANTES was found to be significantly
upregulated during treatment in the non-SVR group (Table 4) at the baseline and W12 time points. In accordance with a previous study, the observed increase in RANTES levels
was associated with the presence of inflammation. The hepatitis
C virus induces RANTES production by macrophages46.
Evidence suggests that IFN type I inhibits the production of RANTES by T cells47. Therefore, consistent with the expected
results, RANTES levels did not increase during TT treatment in the SVR group (Table 3).
A previous study that assessed cytokine and chemokine levels during dual therapy treatment showed that IL-8 levels were lower throughout the treatment and were associated with SVR48. In contrast to the abovementioned findings, our
current results indicated that IL-8 levels were upregulated during the early periods of TT treatment in both patient groups (Table 3 and Table 4).
In a previous study on patients undergoing dual therapy,49
levels of the cytokine MIG were shown to be downregulated during SVR. By contrast, our results showed that the MIG levels were upregulated in both groups (Table 3 and 4); however, the SVR group presented higher MIG levels at W12, although
the differences were also not significant (Table 2). Moura et al. (2011) investigated subjects undergoing dual therapy and showed that patients in the SVR group had higher MIG levels than those in the non-SVR group; however, the differences were
not statistically significant.
CONCLUSION
Our findings showed that RANTES, IL-6, and IL-8 levels
were associated with SVR during TT treatment. Our results were similar to those observed in patients with double therapy, thereby supporting the role of IFN in the host RI. Further studies
are required to investigate the cytokine and chemokine profiles
Conflict of interest
The authors declare that there is no conflict of interest.
REFERENCES
1. World Health Organization (WHO). Guidelines for the screening, care and treatment of persons with hepatitis C infection. Geneva: WHO; 2014. 124 p.
2. Gower E, Estes C, Blach S, Razavi-Shearer K, Razavi H. Global epidemiology and genotype distribution of the hepatitis C virus infection. J Hepatol. 2014;61(Suppl 1):S45-57.
3. Manss MP, McHutchison JG, Gordon SC, Rustgi VK, Shiffman M, Reindollar R, et al. Peginterferon alfa-2b plus ribavirin compared with interferon alfa-2b plus ribavirin for initial treatment of chronic hepatitis C: a randomised trial. Lancet. 2001;358(9286):958-65.
4. Bruno S, Shiffman ML, Roberts SK, Gane EJ, Messinger D, Hadziyannis SJ, et al. Efficacy and Safety of Peginterferon Alfa-2a (40KD) Plus Ribavirin in Hepatitis C Patients with Advanced Fibrosis and Cirrhosis. Hepatology. 2010;51(2):388-97.
5. Silva GF, Polônio RJ, Pardini MI, Corvino SM, Henriques RM, Peres MN, et al. Using Pegylated Interferon alfa-2b and Ribavirin to Treat Chronic Hepatitis Patients Infected with Hepatitis C Virus Genotype 1: Are Nonresponders and Relapsers Different Populations? Braz J Infect Dis 2007;11(6):554-60.
6. Silva GF, Villela-Nogueira CA, Mello CE, Soares EC, Coelho HS, Ferreira PR, et al. Peginterferon plus ribavirin and sustained
virological response rate in HCV-related advanced fibrosis: a real
life study. Braz J Infect Dis. 2014;18(1):48-52.
7. Martinot-Peignoux M, Stern C, Maylin S, Ripault MP, Boyer N, Leclere L, et al. Twelve weeks posttreatment follow-up is as relevant as 24 weeks to determine the sustained virologic response in patients with hepatitis C virus receiving pegylated interferon and ribavirin. Hepatology. 2010;51(4):1122-6.
8. Bacon BR, Gordon SC, Lawitz E, Marcellin P, Vierling JM, Zeuzem S, et al. Boceprevir for Previously Treated Chronic HCV Genotype 1 Infection. N Engl J Med. 2011;364(13):1207-17.
9. Zeuzem S, Andreone P, Pol S, Lawitz E, Diago M, Roberts S, et al. Telaprevir for retreatment of HCV infection. N Engl J Med. 2011;364(25):2417-28.
10. Edlich B, Ahlenstiel G, Azpiroz AZ, Stoltzfus J, Noureddin M,
Serti E, et al. Early changes in interferon signaling define natural
killer cell response and refractoriness to interferon-based therapy of hepatitis C. Hepatology. 2012;55(1):39-48.
11. Moura AS, Carmo RA, Teixeira AL, Teixeira MM, Rocha MO. Soluble
inflammatory markers as predictors of virological response in patients with chronic hepatitis C virus infection treated with interferon-α plus
ribavirin. Mem Inst Oswaldo Cruz. 2011;106(1):38-43.
12. Komase K, Maekawa S, Miura M, Sueki R, Kadokura M, Shindo H, et al. Serum RANTES level influences the response to pegylated interferon and ribarivin therapy in chronic hepatitis C . Hepatol Res. 2013,43(8):865-75.
13. Zeremski M, Petrovic LM, Talal AH. The role of chemokines as
inflammatory mediators in chronic hepatitis C virus infection. J
Viral Hepat. 2007;14(10):675-87.
14. Nguyen TT, Niloofar R, Rubbo PA, Nils K, Bollore K, Ducos J, et al. Cytokine Response Associated with Hepatitis C Virus Clearance in
HIV Coinfected Patients Initiating Peg Interferon-α Based Therapy.
Mediterr J Hematol Infec Dis. 2016;8(1):e2016003.
15. Wandrer F, Falk CS, John K, Skawran B, Manns MP, Schulze-Osthoff K, et al. Interferon-Mediated Cytokine Induction
Determines Sustained Virus Control in Chronic Hepatitis C Virus Infection. J Infect Dis. 2016;213(5):746-54.
16. Barbosa KVBD, Teixeira R, Bassetti-Soares E, de Souza AF, Penido JM, Teixeira-Carvalho A, et al. Phenotypic features of innate and adaptive immunity in patients with chronic hepatitis C and end-stage renal disease. Liver Int. 2013;33(9):1349-56.
17. Amati L, Caradonna L, Magrone T, Mastronardi ML, Cuppone R, Cozzolongo R, et al. Modifications of the Immune Responsiveness in Patients with Hepatitis C Virus Infection following Treatment with IFN-a / Ribavirin. Curr Pharm Des. 2002;8(11):981-93.
18. Nelson DR, Tu Z, Soldevila-Pico C, Abdelmalek M, Zhu H, Xu YL, et al. Long-term lnterleukin 10 therapy in chronic hepatitis C
patients has a proviral and anti-inflammatory effect. Hepatolology.
2003;38(4):859-69.
19. Jacobson-Brown PM, Neuman MG. Immunopathogenesis of hepatitis C virus infection: Th1/Th2 responses and the role of cytokines. Clin Biochem. 2001;34(3):167-71.
20. Neuman MG, Schmilovitz-Weiss H, Hilzenrat N, Bourliere M, Marcellin P, Trepo C, et al. Markers of inflammation and
fibrosis in alcoholic hepatitis and viral hepatitis C. Int J Hepatol.
2012;2012:231210.
21. Fathy A, Ahmed AS, Metwally L, Hassan A. T helper type 1/T helper type 17-related cytokines in chronic hepatitis C patients before and after interferon and ribavirin therapy. Med Princ Pract. 2011;20(4):345-9.
22. Araujo AR, Peruhype-Magalhães V, Coelho-dos-Reis JG, Chaves LP, de Lima TA, Pimentel JP, et al. Dual role of IL-12 in the
therapeutic efficacy or failure during combined PEG-Interferon-α2A and ribavirin therapy in patients with chronic hepatitis C.
Immunol Lett. 2013;154(1-2):61-9.
23. Falconer K, Askarieh G, Weis N, Hellstrand K, Alaeus A, Lagging M. IP-10 predicts the first phase decline of HCV RNA and overall viral response to therapy in patients co-infected with chronic hepatitis C virus infection and HIV. Scand J Infect Dis. 2010;42(11-12):896-901.
24. Fujimoto T, Tomimatsu M, Iga D, Endo H, Otsuka KJ. Changes in the Th1/Th2 ratio during a 24-week course of an interferon alpha-2b plus ribavirin combination therapy for patients with chronic hepatitis C. J Gastroenterol Hepatol. 2008;23(8Pt2);e432-7.
25. Bedossa P, Poynard T. An algorithm for the grading of activity in chronic hepatitis C. The METAVIR Cooperative study Group. Hepatology. 1996;24(2):289-93.
26. Tarragô AM, Costa AG, Pimentel JPD, Gomes STM, Freitas FB, Lalwani P, et al. Combined impact of hepatitis C virus genotype 1 and interleukin-6 and tumor necrosis factor-a polymorphisms
on serum levels of pro-inflammatory cytokines in Brazilian
HCV-infected patients. Hum Immunol. 2014;75(11):1075-83.
27. Gao B, Hong F, Radaeva S. Host factors and failure of interferon-alfa treatment in HCV. Hepatology. 2004;39(4):880-90.
28. Pavon-Castillero EJ, Munoz-de-Rueda P, Lopez-Segura R, Gila A, Quiles R, Munoz-Gamez JA, et al. Importance of IL-10 and IL-6 during chronic hepatitis C genotype-1 treatment and their relation with IL28B. Cytokine. 2013;61(2):595-601.
29. Yoneda S, Umemura T, Joshita S, Ichijo T, Matsumoto A, Yoshizawa K, et al. Serum chemokine levels are associated with the outcome of pegylated interferon and ribavirin therapy in patients with chronic hepatitis C. Hepatol Res. 2011;41(6):587-93.
30. Katsounas A, Trippler M, Wang B, Polis M, Lempicki RA, Kottilil S, et al. CCL5 mRNA is a Marker for early fibrosis in chronic
hepatitis C and is regulated by Interferon-α therapy and Toll-like
31. Diago M, Castellano G, Garcia-Samaniego J, Pérez C, Fernández I, Romero H, et al. Association of pretreatment serum interferon γ inducible protein 10 levels with sustained virological response to peginterferon plus ribavirin therapy in genotype 1 infected patients with chronic hepatitis C. Gut. 2006;55(3):374-9.
32. Moura AS, Carmo RA, Teixeira AL, Rocha MO. Soluble
inflammatory markers as predictors of hepatocellular damage
and therapeutic response in chronic hepatitis C. Braz J Infect Dis. 2009;13(5):375-82.
33. Larrubia JR, Benito-Martínez S, Calvino M, Sanz-de-Villalobos E, Parra-Cid T. Role of chemokines and their receptors in viral persistence and liver damage during chronic hepatites C vírus infection. World J Gastroenterol. 2008;14(47):7149-59.
34. Willemse SB, Reesink HW, Ladee K, Karlas J, Gelderblom HC, Molenkamp R, et al. IP-10 in chronic hepatitis C patients treated with high-dose interferon. Neth. J Med. 2014;72(8):407-15.
35. Zimmermann HW, Seidler S, Gassler N, Nattermann J, Luedde t, Trautwein C, et al. Interleukin-8 Is Activated in Patients with Chronic Liver Diseases and Associated with Hepatic Macrophage Accumulation in Human Liver Fibrosis. PLoS One. 2011;6(6):e21381.
36. Polyak SJ, Khabar KS, Rezeiq M, Gretch DR. Elevated levels of interleukin-8 in serum are associated with hepatitis C virus infection and resistance to interferon therapy. J Virol. 2001;75(13):6209-11.
37. Huang YS, Chan CY, Wu JC, Pai CH, Chao Y, Lee SD. Serum levels of interleukin-8 in alcoholic liver disease: relationship with disease stage, biochemical parameters and survival. J Hepatol. 1996;24(4):377-84.
38. Cremer I, Ghysdael J, Vieillard V. A non-classical ISRE/ISGF3 pathway mediates induction of RANTES gene transcription by type I IFNs. FEBS Lett. 2002;511(1-3):41-5.
39. Zimmerer JM, Lesinski GB, Radmacher MD, Ruppert A, Carson III WE. STAT1-dependent and STAT1-independent gene expression in murine immune cells following stimulation with interferon-alpha. Cancer Immunol Immunother. 2007;56(11):1845-52.
40. Zeremski M, Dimova RB, Benjamin S, Penney MS, Botfield MC, Talal AH. Intrahepatic and Peripheral CXCL10 Expression in Hepatitis C Virus–Infected Patients Treated With Telaprevir, Pegylated Interferon, and Ribavirin. J Infect Dis. 2015;211(11): 1795-9.
41. Nishikawa H, Enomoto H, Nasu A, Aizawa N, Saito M, Tamori A, et al. Clinical significance of pretreatment serum interferon-gamma-inducible protein 10 concentrations in chronic hepatitis C patients treated with telaprevir-based triple therapy. Hepatol Res. 2014;44(14):E397-407.
42. Guzman-Fulgencio M, Jimenez JL, Berenguer J, Fernandez-Rodriguez A, Lopez JC, Cosin J, et al. Plasma IL-6 and IL-9 predict the failure of interferon-alpha plus ribavirin therapy in HIV/HCV-coinfected patients. J Antimicrob Chemother. 2012; 67(5):1238-45.
43. Grungreiff K, Reinhold D, Ansorge S. Serum concentrations of sIL-2R, IL-6, TGF-beta1, neopterin, and zinc in chronic hepatitis C patients treated with interferon-alpha. Cytokine. 1999;11(12):1076-80.
44. Florholmen J, Kristiansen MG, Steigen SE, Sørbye SW, Paulssen EJ, Kvamme JM, et al. A rapid chemokine response of macrophage
inflammatory protein (MIP)-1a, MIP-1b and the regulated on
activation, normal T expressed and secreted chemokine is associated with a sustained virological response in the treatment of chronic hepatitis C. Clin Microbiol Infect. 2011;17(2):204-9.
45. Kushner L, Wendelboe AM, Lazzeroni LC, Chary A, Winters MA, Osinusi A, et al. Immune biomarker differences and changes comparing HCV mono-infected, HIV/HCV co-infected, and HCV spontaneously cleared patients. PLoS One. 2013;8(4):e60387.
46. Sasaki R, Devhare PB, Steele R, Ray R, Ray RB. Hepatitis C virus induced CCL5 secretion from macrophages activates hepatic stellate cells. Hepatology. 2017; 66(3):746-57.
47. Zang YC, Halder JB, Samanta AK, Hong J, Rivera VM, Zhang JZ. Regulation of chemokine receptor CCR5 and production of RANTES and MIP-1alpha by interferon-beta. J Neuroimmunol. 2001;112(1-2):174-80.
48. Alhetheel A, Albarrag A, Shakoor Z, Alswat K, Abdo A, Al-Hamoudi W. Assessment of pro-inflammatory cytokines in sera of patients with hepatitis C virus infection before and after anti-viral therapy. J Infect Dev Ctries. 2016;10(10):1093-8.