Title 1
2
Intranasal fosphenytoin: the promise of phosphate esters in nose-to-brain delivery of poorly 3
soluble drugs 4
5
Patrícia C. Pires1,2,a, Liliana T. Santos1,2,b, Márcio Rodrigues1,2,3,c, Gilberto Alves1,2,d, Adriana O. 6
Santos1,2,* 7
1 Health Sciences Research Centre (CICS-UBI), University of Beira Interior, Av. Infante D. 8
Henrique, 6200-506 Covilhã, Portugal 9
2 Faculty of Health Sciences, University of Beira Interior, Av. Infante D. Henrique, 6200-506 10
Covilhã, Portugal 11
3 Research Unit for Inland Development (UDI-IPG), Polytechnic Institute of Guarda, 6300-749 12
Guarda, Portugal 13
* Corresponding author, asantos@fcsaude.ubi.pt (00351 275329079) 14
a patriciapires93@gmail.com; b lilianasantos96@hotmail.com; c marciorodrigues@fcsaude.ubi.pt; d 15
gilberto@fcsaude.ubi.pt. 16
17 18
Abstract 1
Intranasal administration could increase both safety and efficacy of drugs acting on the central 2
nervous system, but low solubility severely limits administration through this route. Phenytoin’s 3
prodrug, fosphenytoin, is hydrophilic and freely soluble in water, but less permeable since it is 4
dianionic. We aimed to assess whether this phosphoester prodrug could be a suitable alternative to 5
phenytoin in intranasal delivery. Secondly, we aimed to compare simple formulation strategies in 6
fosphenytoin delivery. 7
8
Fosphenytoin formulations containing thermosensitive and/or mucoadhesive (hydroxypropyl 9
methylcellulose, HPMC) polymers were developed, guided by viscosity, gelling temperatures, 10
osmolality, and in vitro drug release tests. Then, a pharmacokinetic study was performed, 11
comparing an intravenous fosphenytoin solution, an intranasal fosphenytoin solution, and intranasal 12
fosphenytoin mucoadhesive formulations with or without albumin. 13
14
Formulations containing HPMC allowed high drug strengths, and had a relatively fast release 15
profile, which was not changed by albumin. Intranasal administration of a formulation with HPMC 16
and albumin prolonged drug concentration over time and led to complete or even increased absolute 17
bioavailability. Moreover, phenytoin’s blood levels did not reach the high peak obtained with 18
intravenous administration. In conclusion, the use of phosphate ester prodrugs could be an efficient 19
and safe strategy to increase the intranasal bioavailability of poorly soluble drugs. 20
21
Keywords: Albumin, Brain delivery, Epilepsy, Fosphenytoin, Intranasal, Pharmacokinetics. 22
23
Abbreviations: 24
AUC – area under the drug concentration vs time curve; AUC0-t – AUC from time zero to the last 25
quantifiable drug concentration; AUC0-inf – AUC from time zero to infinite; AUCextrap (%) – 26
percentage of the AUC that was extrapolated, from the last quantifiable drug concentration to 27
infinite; AUMC – area under the first moment curve; F – absolute blood bioavailability (intranasal 28
formulation vs intravenous solution); Clast – last quantifiable drug concentration; Cmax – maximum 29
drug concentration; FDA – Food and Drug Administration;FOS – fosphenytoin; HPLC – high-30
performance liquid chromatography; H or HPMC – hydroxypropyl methylcellulose; IN – intranasal; 31
IV – intravenous; kel – elimination rate constant; MRT – mean residence time; P – Pluronic F-127; 32
R2 – coefficient of determination; RB% blood – relative blood bioavailability (intranasal formulation 33
vs intranasal solution); SEM – standard error of the mean; t1/2el – elimination life; Tgel50 – half-34
gelation temperature; Tmax – time to reach maximum drug concentration. 35
1. Introduction 1
Epilepsy is a high incidence chronic neurological disorder, affecting millions of people worldwide 2
(World Health Organization, 2019). It is characterized by the occurrence of epileptic seizures, 3
which happen when there is a disturbance in the normal electrical activity of the brain, with an 4
excessively synchronous or sustained neuronal discharge (Musumeci et al., 2019). There are several 5
types of seizures with many different clinical manifestations, including partial or total impairment 6
of consciousness, that may or may not be accompanied by repeated and/or unusual body 7
movements (Kiriakopoulos and Shafer, 2017). Convulsive status epilepticus is the most severe of 8
all epileptic seizures (Glauser et al., 2016). In the hospital setting, first-line treatment of convulsive 9
status epilepticus is usually a benzodiazepine, specifically lorazepam (intravenous), diazepam 10
(intravenous) or midazolam (intramuscular) (Glauser et al., 2016). Second-line treatment includes 11
the intravenous administration of several other antiseizure drugs. Among them is the drug/prodrug 12
pair phenytoin and fosphenytoin, that have had a decrease in use over the years due to systemic side 13
effects (cardiovascular complications, liver toxicity, osteopenia, peripheral neuropathy), but seem to 14
be non-inferior in efficacy when compared to other antiepileptics (Glauser et al., 2016; Poplawska 15
et al., 2015; Shih et al., 2016; Zaccara et al., 2017). Nevertheless, intravenous administration 16
requires hospitalization, trained personnel, and establishment of intravenous access, which can 17
delay therapeutic response. Furthermore, it is an invasive route of administration, which makes it 18
uncomfortable and even painful for the patients, with risk of injury at the administration site 19
(Kapoor et al., 2016). 20
The intranasal route could be an alternative to parenteral anticonvulsive drug administration due to 21
several associated advantages, being a more pleasant and patient-friendly option, and also having 22
proven to be overall faster in achieving seizure cessation, since there is no need for hospitalization, 23
being easy to administer by a caregiver (Glauser et al., 2016; Kapoor et al., 2016; U.S. Food and 24
Drug Administration, 2019; Zaccara et al., 2017). Furthermore, intranasal delivery allows direct 25
nose-to-brain transport, which means that at least part of the drug will bypass the blood-brain 26
barrier, and can get to the brain directly, hence reducing systemic distribution and potentially 27
increasing safety (Erdó et al., 2018; Pires and Santos, 2018). Intranasal administration of 28
antiepileptics, namely midazolam and diazepam, has shown to be as effective as the intravenous 29
alternatives, having become first-line options in pre-hospital setting (off-label use), and with one 30
preparation having even reached the market (Nayzilam®, a midazolam formulation) (U.S. Food and 31
Drug Administration, 2019). However, benzodiazepines’ use may cause somnolence, and drug 32
formulations required to solubilize benzodiazepines have been shown to induce lacrimation and 33
nose and throat irritation (Maglalang et al., 2018). Moreover, if abused, they can also cause 34
deleterious cognitive effects and dependence/tolerance. 35
With phenytoin being a low solubility antiepileptic, we hypothesized that using its hydrophilic 36
prodrug, fosphenytoin, could be a viable approach for an intranasal formulation. Even if it is 37
unlikely for fosphenytoin to undergo free passive absorption due to its anionic nature, it can be 38
converted to phenytoin by phosphatases in the nasal cavity, as has been reported by Antunes Viegas 39
et al (Antunes Viegas et al., 2016). Our rationale was that the substantially increased drug strength, 40
while formulating with safe excipients, and the local metabolization to the active diffusible form, 41
could compensate for the reduced prodrug diffusion. Furthermore, by choosing a drug/prodrug pair 42
already available in the market, this work aimed to serve as proof-of-concept that phosphate esters 43
can be a useful strategy for nasal formulation development, to overcome poor bioavailability of 44
many other poorly soluble drugs. 45
In order to increase the formulation’s retention time in the nasal cavity, consequently allowing more 1
time for drug absorption to occur and potentially increasing brain bioavailability, we considered two 2
strategies: adding a mucoadhesive polymer – hydroxypropyl methylcellulose (HPMC); and/or 3
adding a thermosensitive polymer – Poloxamer 407 (Pluronic® F-127, from now on referred to as 4
Pluronic only) – which when heated can undergo sol-gel phase transition, if in solution at sufficient 5
concentration. Both polymers have been previously used in the composition of nasal formulations, 6
alone or in combination (Karavasili and Fatouros, 2016; Shaikh et al., 2011). The addition of 7
albumin to the formulation was also evaluated, since fosphenytoin strongly binds to it, and albumin 8
has been described to be actively transported from the nasal cavity to the brain (Falcone et al., 2014; 9
Lai et al., 1995). The developed mucoadhesive and/or thermosensitive formulations of fosphenytoin 10
were characterized regarding viscosity, osmolality, pH and in vitro drug release profile. The 11
selected formulations were then administered to mice in an in vivo pharmacokinetic study, to 12
compare and characterize their pharmacokinetic profile. 13
14
2. Materials and methods 15
16
2.1. Materials 17
Part of fosphenytoin disodium (USP) was a gift sample from JPN Pharma (Mumbai, India), and 18
another part was purchased from Jai Radhe Sales (Ahmedabad, India). Although it was provided as 19
a hydrated disodium salt, mass concentration in the text will be indicated as calculated for the 20
anhydrous acid form. Fosphenytoin and phenytoin (USP) reference standards and ketoprofen were 21
acquired from Sigma-Aldrich (Steinheim, Germany), as were Pluronic, monobasic sodium 22
phosphate and bovine serum albumin. Pentobarbital sodium injection solution (Eutasil®) was 23
purchased from Ceva (Libourne, France). HPMC 2910 (USP) was bought from Acofarma 24
(Barcelona, Spain). High-performance liquid chromatography (HPLC) grade methanol, analytical 25
grade triethylamine, perchloric acid 70% (v/v) and diethyl ether, and sodium chloride and sodium 26
hydrogen carbonate were all acquired from Fisher Scientific (Leicestershire, United Kingdom). 27
Sodium acetate was bought from Merck (Darmstadt, Germany), potassium chloride from Chem-Lab 28
(Zedelgem, Belgium), and dibasic sodium phosphate from Acros Organics (Geel, Belgium). 29
Magnesium chloride and sodium hydroxide were purchased from Labkem (Barcelona, Spain). 30
Calcium chloride and ortho-phosphoric acid 85% (v/v) were acquired from Panreac (Barcelona, 31
Spain). Hydrochloric acid 37% (v/v) was bought from Fluka (Seelze, Germany). Water was always 32
of ultra-pure grade (Milli-Q water apparatus, 0.22 μm filter, Merck, Darmstadt, Germany). 33
34
2.2. Formulation preparation 35
Formulations were prepared by weighing together all the necessary components: Pluronic and 36
albumin were added in powder form; HPMC was added as a 2% (w/w) aqueous solution; and 37
fosphenytoin was added either as a more concentrated aqueous solution, for preliminary batches 38
with lower drug strengths, or as a powder, for final formulations with higher drug strengths. The pH 39
was adjusted to 6 - 7 (nasal pH) for all formulations (Orion Star A211 pH meter, Thermo Fisher 40
Scientific, Indonesia) and was then verified using universal indicator paper (Nahita, Auxilab S.L., 41
Navarra, Spain). Water was also added by measuring the required mass, and formulations’ 42
homogenization was achieved with mechanical or magnetic steering, at 4 ºC for preparations 1
containing Pluronic and at room temperature for all others. For simplification purposes, percentual 2
w/w concentrations [% (w/w)] will be indicated throughout the text as percentage only (%). 3
4
2.3. Rheology and osmolality 5
Viscosity measurements were made with a cone-plate rheometer (DV3T, Brookfield Ametek, 6
Massachusetts, USA). Sample volume was 0.5 mL, and one of two spindles was selected – CP40Z 7
or CP52Z. Temperature was regulated and maintained using a thermostated water bath (MultiTemp 8
III Thermostatic Circulator, Thermo Fisher Scientific, New Hampshire, USA). Viscosity was 9
measured at a constant temperature (20 ºC, mean room temperature, or 32 ºC, mean nasal cavity 10
temperature) and varying shear rates. For Newtonian fluids, zero shear viscosity was considered to 11
be the value measured at the highest rotational speed (within the apparatus measurement range), for 12
lower associated measurement error. Gelation was evaluated at a constant shear rate (100 s-1) and 13
varying temperatures. Each batch was measured only once, and values that were not within the 14
torque interval correspondent to a minimum of 95% measurement accuracy were not considered. 15
Osmolality was determined using a freezing point osmometer (Osmomat 3000, Gonotec, Berlin, 16
Germany). Mean values were calculated using 3 to 5 measurements for each batch. 17
18
2.4. In vitro drug release 19
In vitro drug release studies were performed using horizontal Ussing Chambers (Harvard 20
Apparatus, NaviCyte, Hugstetten, Germany).Temperature was kept at 32 ºC (measured inside the 21
chamber) using a thermostated water bath (Grant Instruments, Cambridge, England), and the 22
membranes used in the assay were made of hydrophilic polyethersulfone, with a 0.2 μm pore size 23
(Supor® membrane disc filters, Pall Life Sciences, Michigan, USA). 24
Experimental protocol was adapted from a previously developed method (Pires et al., 2020). The 25
bottom chamber was filled with 1.8 mL of nasal fluid simulant buffer, pH 6.5 (monobasic sodium 26
phosphate 7 mM, dibasic sodium phosphate 3 mM, potassium chloride 30 mM, sodium chloride 27
107 mM, calcium chloride 1.5 mM, magnesium chloride 0.75 mM, and sodium hydrogen carbonate 28
5 mM). After the chambers were fully assembled, 200 μL of this same buffer were placed on the 29
upper side of the membrane. After reaching the intended temperature, the buffer on the upper side 30
of the membrane was replaced with 200 μL of the formulation. Homogenization of the bottom 31
chamber fluid was achieved through magnetic steering (Micro Stirring Bars, 2 mm, VWR, United 32
Kingdom). Samples of 100 μL were taken from the receiver chamber at 5, 10, 20, 40, 60, 80, 100, 33
120, 140, 160 and 180 minutes, and the volume was replaced with new buffer solution at every time 34
point.Subsequently, drug quantification in the formulation and in the collected samples was done 35
by spectrophotometry or HPLC, as described in the following sections 2.4.1. and 2.4.2. A simple 36
fosphenytoin aqueous solution was used as positive control. 37
38
2.4.1. Spectrophotometric assay 39
Spectrophotometric assay selectivity was assessed by measuring vehicle, matrix and empty ultra-40
violet microplates (Greiner Bio-One, Germany) absorbance at 210 nm in a microplate 41
spectrophotometer (xMark, Bio-Rad, Japan). Both the matrix (nasal fluid simulant buffer) and the 1
empty wells had a relevant absorbance at the chosen wavelength, and thus the corresponding values 2
were subtracted from the ones obtained for sample quantification, during data analysis. Vehicle 3
interference was assessed by measuring the absorbance of the highest of the chosen polymer 4
concentrations: Pluronic at 15% and HPMC at 0.5% (properly diluted). 5
Before absorbance reading, samples collected from the Ussing chambers (except the ones belonging 6
to formulations containing albumin) were diluted 20-fold in nasal fluid simulant buffer. For the 7
quantification of initial drug concentration, a sample was taken directly from the preparations and 8
diluted 800-fold. 9
Method validation followed the Food and Drug Administration (FDA) guideline (FDA et al., 2018), 10
for evaluation of the method’s limit of quantification, linearity, precision, accuracy and selectivity 11
for the analyte (fosphenytoin). Further detailed information can be found in the appendix A (section 12
A.1). 13
14
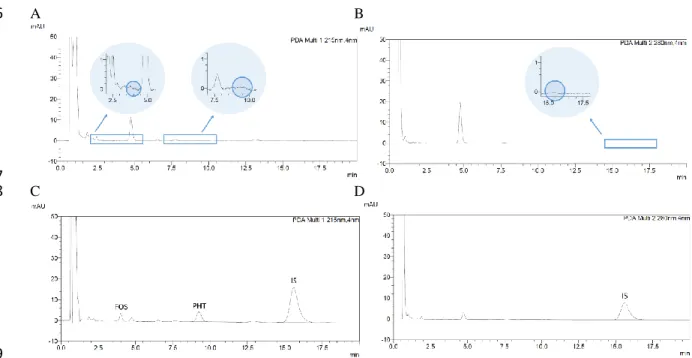
2.4.2. High-performance liquid chromatography assay 15
In vitro drug release test samples belonging to formulations containing albumin were quantified by 16
HPLC. The method was adapted from the one developed by Antunes Viegas et al. (Antunes Viegas 17
et al., 2016). To obtain drug levels within the range of the calibration curves, samples collected 18
from the Ussing chambers during the drug release assay were diluted 200-fold in nasal fluid 19
simulant buffer, and samples taken directly from the formulations used in the assay were diluted 20
5000-fold. Perchloric acid at 10% (v/v) was then added in order to precipitate the albumin that was 21
part of the formulation’s composition. Chromatographic apparatus consisted of a HPLC system 22
(LC-2010A HT Liquid Chromatography) coupled with a diode-array detector (SPD-M20A), 23
controlled automatically by the data acquisition software (LabSolutions, version 5.52), from 24
Shimadzu (Kyoto, Japan). Analyte separation was performed at 30 ºC on a reversed-phase column 25
(C18, 3 μm particle size, 55 × 4 mm) protected by a reversed-phase guard column (C18, 5 μm 26
particle size, 4 × 4 mm), LiChroCART® Purospher® STAR models, both purchased from Merck 27
(Darmstadt, Germany). Elution was done at 1 mL/min in isocratic mode, and the mobile phase was 28
composed of (v:v) 36% methanol and 64% sodium phosphate buffer, 10 mM, pH 3, with 0.25% 29
triethylamine, filtered (Nylaflo membrane, 0.2 μm pore size, Pall, USA) and degassed for 30 30
minutes (Branson Bransonic® M Mechanical Bath 5800, Missouri, USA) prior to injection. Sample 31
injection volume was 20 μL. Analyte detection was done at 215 nm, with 20 minute runs. 32
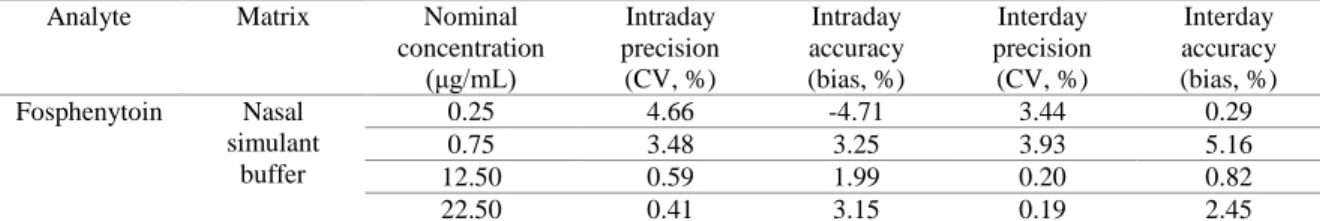
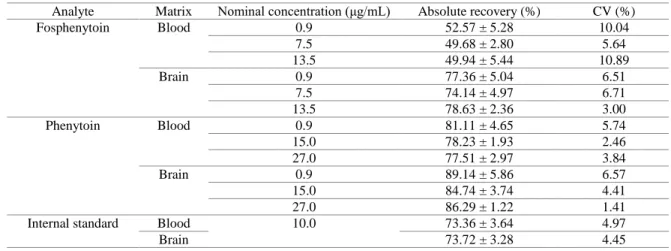
Method validation concerning limit of quantification, linearity, precision, accuracy, selectivity and 33
recovery of fosphenytoin followed the FDA guideline criteria (FDA et al., 2018). Method 34
selectivity was also evaluated for the formulation vehicle. Further detailed information can be found 35
in the appendix A, (section A.2). 36
37
2.5. In vivo pharmacokinetic study 38
2.5.1. Animal experimentation 39
In the animal experimentation studies we used adult male CD-1 mice, age ranging between 7 and 11 40
weeks, and weighing between 28 and 42 g. These animals came from our own institution’s certified 41
animal facility, and they were housed under controlled environmental conditions (12 hours 1
light/dark cycle, 20 ± 2 ºC, 50 ± 5% relative humidity) with free access to tap water and standard 2
rodent diet (4RF21, Mucedola, Italy). All animal procedures, including those to obtain blank 3
matrices for validation experiments, were performed in conformity with the regulations of the 4
European Directive 2010/63/EU, regarding the protection of laboratory animals used for scientific 5
purposes, and approved by the Local Animal Ethics Committee and by the competent national 6
authority [Portuguese National Authority for Animal Health, Phytosanitation and Food Safety 7
(DGAV – Direção Geral de Alimentação e Veterinária)]. 8
A total of 176 animals were randomly divided into 4 experimental groups (11 time points, 4 mice 9
per time point). Prior to formulation administration each mouse was anesthetized with a dose of 60 10
mg/kg of pentobarbital, through intraperitoneal injection. All formulations had a target fosphenytoin 11
strength of 50 mg/g. A first group was given a slow intravenous tail-vein injection (over 12
approximately 1 minute) of a fosphenytoin solution diluted 20-fold in physiological saline solution 13
(sodium chloride 0.9%); a second group received a fosphenytoin solution intranasally; a third group 14
received a fosphenytoin solution in HPMC at 0.5% (H0.5FOS) intranasally; and a fourth group was 15
given a fosphenytoin solution in HPMC at 0.5% plus albumin at 2% (H0.5FOS + albumin) also 16
intranasally. For intranasal administrations the mouse’s body was laid on its left side, on top of a 17
heating pad (plus a DC Temperature Controller 40-90-8D, FHC, Maine, USA). A flexible catheter, 18
attached to a 50 μL syringe (Hamilton, Nevada, USA), was then inserted 3 to 4 mm into the right 19
nostril. A volume of 5 μL per 30 g of body weight was administered once. After drug administration 20
the mice were left to recover from anesthesia in a supine position, in a temperature-controlled 21
environment. 22
23
2.5.2. In vivo sample collection, processing and high-performance liquid chromatography 24
assay 25
After euthanasia at specific time points – 5, 10, 15, 30, 60, 120, 240, 360, 480, 720 and 1440 26
minutes – mice blood and brain were collected. Blood was collected to tubes containing 27
ethylenediaminetetraacetic acid (1 mL capacity, with K3 EDTA, FL Medical, Italy), and after mild 28
agitation 300 μL were transferred to an eppendorf tube already containing 300 μL of 29
orthophosphoric acid 85% (v/v), making a blood:acid mixture in a 1:1 (v/v) ratio. The mixture was 30
then kept on ice. Whole brains were homogenized (Ika Ultra-Turrax® T25 Basic, Staufen, 31
Germany) in a mixture of water and orthophosphoric acid also in a 1:1 (v/v) ratio (1 g of tissue per 32
4 mL of mixture), and were likewise kept on ice. Afterwards, brain homogenates were centrifuged 33
(MIKRO 200R microcentrifuge, Hettich, Tuttlingen, Germany) at 14000 rpm, 4 ºC, for 10 minutes. 34
Both acidified blood and acidified brain homogenates’ supernatants were stored at -20 ºC 35
(RZ80FHRS freezer, Samsung, Seoul, South Korea) until needed. The purpose of the addition of 36
orthophosphoric acid to the tissues was to prevent fosphenytoin conversion to phenytoin. 37
During processing all samples were kept on ice. Initially, 20 μL of ketoprofen (the internal 38
standard) spiking solution were added to 100 μL of brain homogenate supernatant sample or 200 μL 39
of blood sample (either a blank matrix plus spiking solution, or a direct sample from the in vivo 40
pharmacokinetic study). This was followed by liquid-liquid extraction, with 1000 μL of diethyl 41
ether being added to each sample, which was subsequently vortexed for 30 seconds and then 42
centrifuged (microcentrifuge, Gyrozen, Daejeon, South Korea) for 5 minutes, at 13500 rpm, at room 43
temperature. The resulting organic phase was transferred to a glass tube, and the aqueous phase was 44
then re-extracted twice more, under the same conditions, with the combined organic phases being 1
evaporated to dryness under a gas stream at 45 °C, and then reconstituted with 100 μL of mobile 2
phase. 3
The chromatographic apparatus and analyte separation conditions were the same as for the 4
quantification of the samples from the drug release study (section 2.4.2), but mobile phase was 5
changed to 36% methanol and 64% sodium acetate buffer (10 mM, pH 5, with 0.25% 6
triethylamine). Furthermore, fosphenytoin and phenytoin detection was done at 215 nm, but the 7
detection of the internal standard was done at 280 nm. Run time and injection volume remained the 8
same (20 minutes and 20 μL, respectively). 9
Method validation followed the FDA guideline as well (FDA et al., 2018), determining the same 10
parameters as before, but now for both fosphenytoin and phenytoin (derived from the in vivo 11
bioconversion of fosphenytoin). Further detailed information can be found in the appendix A 12 (section A.3). 13 14 2.6. Data analysis 15
Statistical data analysis and graphical representation was done using the GraphPad Prism software, 16
version 6.0. The significance level was set at 0.05. 17
Zero shear viscosity of non-Newtonian pseudoplastic fluids was estimated by fitting a non-linear 18
regression model (one phase decay) to the “viscosity vs shear rate” data and determining the zero of 19
the function (Y when X = 0), with or without prior variable transformation (X = Log10 X for 20
Pluronic + HPMC formulations at 32 ºC). Tgel50, the half-gelation temperature, was considered to 21
be the temperature at which viscosity is at 50% of the correspondent to complete gelation, and was 22
determined by applying a non-linear regression model (log(agonist) vs. response, variable slope, 23
four parameters) to the “viscosity vs temperature” data. 24
The determination of the drug release parameters was done taking into account initial drug strength. 25
Drug release rates were calculated using an adaptation of the Higuchi model (Ramteke et al., 2014; 26
United States Pharmacopeial Convention, 2017), in which both time (X) and drug release 27
percentage (Y) were transformed: the square root of X was calculated (X = √X), and Y was divided 28
by the area of the membrane used in the assay (Y = Y/0.64). Then after these transformations a 29
linear regression was applied, using mean values for each time point, and late time points for which 30
correspondent values fell out of the linear zone were excluded. To assess whether they differed 31
significantly between formulations, the drug release rates (slopes) were compared two-by-two using 32
an F-test. 33
The existence of a correlation between total drug release percentage and zero shear viscosity at 32 34
ºC was assessed by using a Spearman’s correlation test, two-tailed. 35
Differences between formulations’ drug concentration levels in blood and brain were determined by 36
two-way ANOVA analysis with Tukey’s multiple comparisons post-test. 37
Pharmacokinetic parameters’ determination was done using the add-in program for Microsoft Excel 38
“PKSolver”, a useful and reliable tool with results satisfactorily comparable to those of WinNonlin 39
(the Pharmaceutical Industry’s go-to tool) (Zhang et al., 2010). A non-compartmental analysis was 40
done for all data, and all administrations were considered to be extravascular, even in the case of the 41
intravenous group, since the administration was done at a slow rate. Maximum drug concentration 1
(Cmax) in blood and brain, and the corresponding time to reach it (Tmax), were directly derived from 2
the experimental data. The area under the drug concentration vs time curve, from time zero to the 3
last quantifiable drug concentration (AUC0-t) was calculated through the linear trapezoidal method. 4
The area under the drug concentration vs time curve, from time zero to infinite (AUC0-inf) was 5
calculated by adding AUC0-t to the last quantifiable drug concentration (with adequate precision and 6
accuracy, Clast) divided by the elimination rate constant (kel), with the formula being AUC0-inf = 7
AUC0-t + Clast/kel. kel was estimated by applying a log-linear regression to the terminal segment of 8
the drug concentration vs time curve. The elimination half-life (t1/2el) was calculated by dividing ln2 9
by kel (the formula being t1/2el = ln2/kel), and the mean residence time (MRT) by dividing the area 10
under the first moment curve (AUMC) by the AUC0-t (the formula being MRT = AUMC/AUC0-t). 11
The percentage of the AUC that was extrapolated, from the last quantifiable drug concentration to 12
infinite, was also calculated (AUCextrap (%)). 13
Absolute blood bioavailability (F) of the intranasal formulations was calculated with equation 1: 14
F =𝐴𝑈𝐶𝐴𝑈𝐶𝑏𝑙𝑜𝑜𝑑𝐼𝑁
𝑏𝑙𝑜𝑜𝑑𝐼𝑉× 100 (1).
15
Relative blood bioavailability (RB% blood) was used to compare intranasally administered 16
formulations to a simple intranasal aqueous drug solution, and it was calculated by equation 2: 17 𝑅𝐵%𝑏𝑙𝑜𝑜𝑑 = (𝐴𝑈𝐶 𝑏𝑙𝑜𝑜𝑑𝐼𝑁)𝑓𝑜𝑟𝑚𝑢𝑙𝑎𝑡𝑖𝑜𝑛 (𝐴𝑈𝐶 𝑏𝑙𝑜𝑜𝑑𝐼𝑁)𝑠𝑜𝑙𝑢𝑡𝑖𝑜𝑛 × 100 (2). 18 19
3. Results and discussion 20
3.1. Formulation development with rheology and osmolality characterization 21
Osmolality measurements and rheological studies were used to support the decision making on 22
which polymer concentrations should be used in vehicle composition. Pluronic alone had an 23
osmolality that ranged from around 130 to 260 mOsmol/kg, therefore being almost isotonic at the 24
highest concentration (16%) (Table 1). This fact limits the amount of drug that can be dissolved in 25
these vehicles without compromising the osmotic safety of the preparations. Oppositely, HPMC 26
alone did not contribute measurably to the osmolality of the formulations. Consequently, mixed 27
vehicles’ osmolality values were similar to those of Pluronic alone. 28
29 30
Table 1. Viscosity and osmolality of vehicles containing HPMC only, Pluronic only, or mixtures of HPMC 1
and Pluronic. Data correspond to 1 representative batch for each different vehicle. Osmolality data are 2
presented as mean ± SEM. Viscosity was measured at 20 ºC, and in Newtonian fluids corresponds to the value 3
at the highest torque. Viscosity of non-Newtonian fluids is represented as zero shear viscosity, inferred by 4
non-linear regression analysis, and is presented as mean ± SEM. 5
Composition (w/w %) Viscosity at 20 ºC (cP) R2 n Osmolality
(mOsmol/kg) HPMC 0.2% 4.54 ± 0.05 0.9751 10 0 HPMC 0.5% 25.24 ± 0.15 0.9971 16 0 HPMC 1% 228.00 ± 1.04 0.9980 12 0 Pluronic 12% 10.11 - - 132.2 ± 0.5 Pluronic 13% 12.61 - - 165.0 ± 2.7 Pluronic 14% 16.12 - - 196.2 ± 3.0 Pluronic 15% 22.38 - - 222.2 ± 3.9 Pluronic 16% 29.04 - - 260.8 ± 1.7 Pluronic 12% + HPMC 0.2% 13.54 - - 135.7 ± 1.2 Pluronic 13% + HPMC 0.2% 15.71 - - 160.0 ± 1.0 Pluronic 14% + HPMC 0.2% 19.84 - - 204.0 ± 1.7 Pluronic 15% + HPMC 0.2% 26.75 - - 245.4 ± 2.4 Pluronic 16% + HPMC 0.2% 41.97 ± 0.55 0.9455 13 285.8 ± 2.4 n – number of points (number of different speeds, one measurement per speed); HPMC – hydroxypropyl methylcellulose; 6
R2 – coefficient of determination; SEM – standard error of the mean. 7
8
The rheological behavior of the vehicles over a range of shear rates, their zero shear viscosity and 9
their gelation temperatures (when applicable) were then assessed, first for each polymer separately, 10
and then in combination. At 20 ºC, HPMC showed non-Newtonian pseudoplastic behavior and 11
Pluronic presented Newtonian behavior, for concentrations between 0.2 - 1% and 12 - 16%, 12
respectively (not shown). Viscosity increased with increasing polymer concentration. For 13
pseudoplastic fluids (HPMC dispersions), zero shear viscosity (inferred from regression analysis) 14
was used to compare with Pluronic formulations’ viscosity (Table 1). 15
As for the combination of the two polymers, it was only possible to obtain physically stable 16
vehicles with HPMC at 0.2%, since with HPMC at 0.5 or 1% phase separation occurred after some 17
time (varying between a few hours to a few days, sooner for higher polymer concentrations), and 18
for the highest polymer concentrations a precipitate appeared. This physical instability in vehicles 19
containing Pluronic and HPMC in combination (at higher polymer concentrations) has not, to the 20
best of our knowledge, been previously reported in the scientific literature, even while having a 21
wide variety of studies using them. Hence, we decided on combining Pluronic (at various 22
concentrations) with HPMC at 0.2% only. The addition of HPMC to Pluronic at 16% changed its 23
rheological behavior from Newtonian to non-Newtonian (pseudoplastic) at 20 ºC (not shown). 24
Pluronic undergoes temperature induced sol-gel transitions. If the polymer’s concentration is not 25
high enough, it transitions from a low viscous fluid to a more viscous one and not to a solid gel, but 26
we will still refer to it as gelation. With dispersions of Pluronic alone, gelation occurred at 15 and 27
16%, while for polymer concentrations equal or below 14% the viscosity only slightly increased 28
with temperature increase up to 45 ºC (Figure 1A and appendix B, section B.1). The combination of 29
the two polymers slightly increased the viscosity compared to Pluronic alone at 20 ºC (Table 1), 30
but, more substantially, it also anticipated Pluronic’s gelation (Figure 1A and appendix B, section 31
B.1). Moreover, with Pluronic at 14% in combination with HPMC a transition to increased viscosity 32
did in fact occur. 33
1
Figure 1. Viscosity variation with temperature increase at a constant shear rate (100 s-1) for aqueous solutions 2
containing Pluronic only (continuous connecting line) or Pluronic + HPMC (discontinuous connecting line) 3
(A); evaluation of viscosity as function of the shear rate at 32 ºC of HPMC (B) or Pluronic (C) aqueous 4
solutions; and zero shear viscosity at 32 ºC of aqueous solutions containing Pluronic only (clear pattern 5
columns) or Pluronic + HPMC (striped pattern columns), determined by non-linear regression (D); 1 to 3 6
batches for each formulation. Data are presented as mean ± SEM. H or HPMC – hydroxypropyl 7
methylcellulose; P – Pluronic; SEM – standard error of the mean. 8
9
At 32 ºC, both HPMC and Pluronic showed non-Newtonian pseudoplastic behavior (Figures 1B and 10
1C). For Pluronic at 16% it was not possible to evaluate viscosity over a wide shear velocity range, 11
since at lower rotational speeds the torque was too high, with a corresponding viscosity above the 12
spindle’s measurement range. Furthermore, the addition of 0.2% HPMC to Pluronic resulted in 13
increased zero shear viscosity at 32 ºC (Figure 1D). 14
In what concerns drug incorporation, for vehicles containing HPMC only the concentration of 1% 15
was excluded because it led to a high zero shear viscosity at room temperature, which could 16
hindrance administration, especially through nasal instillation. Therefore, we selected the 17
concentrations of 0.2 and 0.5%. Drug incorporation into these vehicles increased zero shear 18
viscosity at both studied temperatures, but not substantially (for the highest concentration, 0.5%, it 19
only increased about 3 cP at 20 ºC and about 1 cP at 32 ºC) (Figure 2A and Tables 1 and 2). For 20
vehicles containing Pluronic only, polymer concentration of 16% was excluded due to its gelation 21
temperature being too low (Tgel50 30.4 ºC), having the risk of undergoing sol-gel transition at an 22
increased room temperature (on a hot summer day, for example), which could also make it difficult 23
to administer. Hence, concentrations from 12 to 15% were selected, and drug addition to these 24
vehicles increased zero shear viscosity considerably, at both studied temperatures, but more 25
substantially at 32 ºC (for the highest concentration, 15%, it increased about 26 cP at 20 ºC and 26
about 122621 cP at 32 ºC) (Figure 2A and Tables 1 and 2). Moreover, there was also an effect of 27
drug addition on gelation, which was anticipated, hence occurring at lower temperatures, with 28
Pluronic at 15% plus fosphenytoin having a sol-gel transition near the mean nasal temperature 29
(Figure 2B and appendix B, section B.1). 30
31
Figure 2. Zero shear viscosity at 32 ºC of vehicles (clear pattern columns) and drug formulations (striped 32
pattern columns), determined by non-linear regression (A); and viscosity variation with temperature increase 33
at a constant shear rate (100 s-1) for Pluronic vehicle (continuous connecting line) and Pluronic drug
34
formulation (discontinuous connecting line) (B); 1 to 3 batches for each formulation. Data are presented as 35
mean ± SEM. FOS – fosphenytoin; H or HPMC – hydroxypropyl methylcellulose; P – Pluronic; SEM – 36
standard error of the mean. 37
38 39
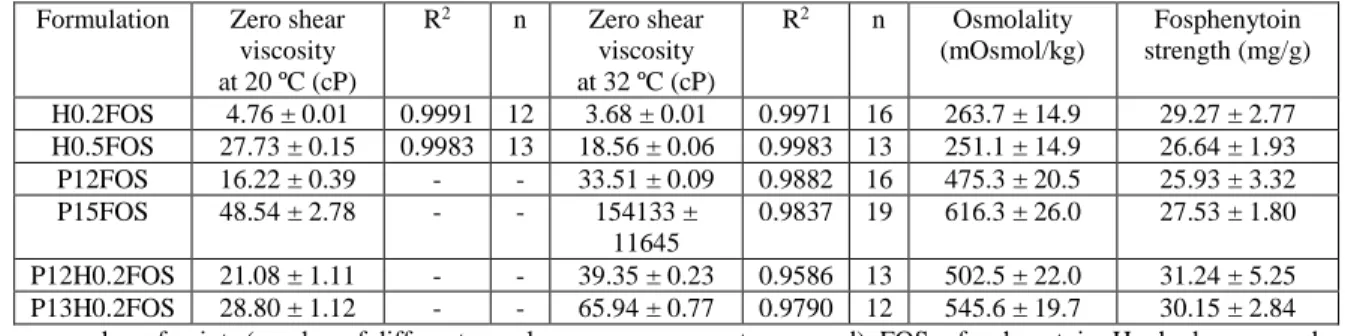
Table 2. Drug formulations’ viscosity and zero shear viscosity, at 20 and 32 ºC, and osmolality. Three 1
batches for each different formulation. Data are presented as mean ± SEM. 2
Formulation Zero shear viscosity at 20 ºC (cP) R2 n Zero shear viscosity at 32 ºC (cP) R2 n Osmolality (mOsmol/kg) Fosphenytoin strength (mg/g) H0.2FOS 4.76 ± 0.01 0.9991 12 3.68 ± 0.01 0.9971 16 263.7 ± 14.9 29.27 ± 2.77 H0.5FOS 27.73 ± 0.15 0.9983 13 18.56 ± 0.06 0.9983 13 251.1 ± 14.9 26.64 ± 1.93 P12FOS 16.22 ± 0.39 - - 33.51 ± 0.09 0.9882 16 475.3 ± 20.5 25.93 ± 3.32 P15FOS 48.54 ± 2.78 - - 154133 ± 11645 0.9837 19 616.3 ± 26.0 27.53 ± 1.80 P12H0.2FOS 21.08 ± 1.11 - - 39.35 ± 0.23 0.9586 13 502.5 ± 22.0 31.24 ± 5.25 P13H0.2FOS 28.80 ± 1.12 - - 65.94 ± 0.77 0.9790 12 545.6 ± 19.7 30.15 ± 2.84 n – number of points (number of different speeds, one measurement per speed); FOS – fosphenytoin; H – hydroxypropyl 3
methylcellulose; P – Pluronic; R2 – coefficient of determination; SEM – standard error of the mean. 4
5
As for mixed vehicles, drug incorporation was only possible for the two lowest Pluronic 6
concentrations – 12 and 13% (plus HPMC at 0.2%), since for Pluronic at higher concentrations 7
fosphenytoin had poor solubility, forming a drug precipitate. Drug addition to the selected polymer 8
mixtures gave rise to an increased viscosity (for the highest concentrations, Pluronic at 13% and 9
HPMC at 0.2%, it increased about 13 cP at 20 ºC and about 11 cP at 32 ºC) (Figure 2A and Tables 1 10
and 2). 11
Drug incorporation into the selected vehicles led to slightly hypotonic formulations for preparations 12
containing HPMC only, and moderately hypertonic formulations for preparations containing 13
Pluronic only or Pluronic + HPMC (Table 2). Although hypertonic, these last formulations were 14
still within the established limits for marketed nasal preparations (Marx et al., 2015), at the current 15
drug concentration range. 16
In addition to selecting the desired polymers and their concentrations, we sought to find a strategy 17
that could potentially increase drug targeting to the brain, and one that was, ideally, relatively 18
simple. Therefore, we chose adding albumin at 2% (w/w) to the selected preparations, as it has been 19
described to be actively transported from the nasal cavity to the brain (Falcone et al., 2014). 20
Nevertheless, for formulations containing just Pluronic, only polymer concentrations of 12% 21
allowed the addition of this protein without compromising physical stability, with the preparations 22
with Pluronic at higher concentrations acquiring a high turbidity. The same happened for the mixed 23
vehicles, regardless of composition. On the contrary, formulations containing HPMC only, at both 24
0.2 and 0.5%, were physically stable. Furthermore, the addition of albumin to the vehicles 25
containing Pluronic at 12% or HPMC at 0.2 or 0.5% did not noticeably alter their viscosity (data not 26
shown). 27
28
3.2. In vitro drug release 29
The viscosity of a formulation may, on the one hand, increase its retention in the nasal cavity, 30
thereby also increasing bioavailability through this route, but on the other hand it can also 31
considerably decrease drug diffusion and release rate, having a counterproductive effect. Therefore, 32
to further assist on formulation selection, the in vitro drug release rates of the preparations that were 33
selected during the rheological studies phase – H0.2FOS, H0.5FOS, P12FOS, P15FOS, 34
P12H0.2FOS and P13H0.2FOS – were evaluated using horizontal Ussing chambers, and compared 1
to a fosphenytoin aqueous solution (positive control). 2
Since HPMC and Pluronic at the highest concentrations (Pluronic at 15% and HPMC at 0.5%) did 3
not interfere with drug absorption at 210 nm (at the dilution used in the assay), a simple 4
spectrophotometric method was developed for fosphenytoin quantification. For the formulation 5
H0.5FOS + albumin in vitro drug release assay sample quantification was done by HPLC, since 6
albumin showed high absorbance at 210 nm, thereby interfering with drug quantification in the 7
spectrophotometric method. Validation results for both assays are given in appendix B (sections B.2 8
and B.3). 9
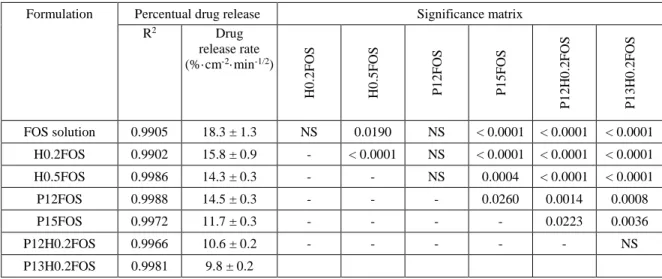
In what concerns percentual drug release (Figure 3) and percentual drug release rate (Table 3) 10
H0.2FOS and P12FOS were not significantly different from the drug solution or from each other, 11
although H0.2FOS appeared to release fosphenytoin slightly faster than P12FOS. Drug release from 12
H0.5FOS was as fast as from P12FOS, and they both reached a total drug release similar to 13
H0.2FOS (at the final time point). P15FOS had a more sustained, significantly slower drug release 14
than all other formulations, which was to be expected given its very high viscosity at 32 ºC (which 15
was likely to reduce drug diffusion), except when compared to P12H0.2FOS and P13H0.2FOS, 16
which despite having a much lower viscosity than P15FOS were the slowest in releasing drug over 17
time, also releasing the least amount after 180 minutes (3 hours). 18
19
Figure 3. Fosphenytoin’s percentual drug release between 5 and 180 minutes. FOS – fosphenytoin; H - 20
hydroxypropyl methylcellulose; P – Pluronic. 21
22
Table 3. Fosphenytoin’s percentual drug release rate, calculated by applying a linear regression to the plotting 23
of the square root of time (X = √X) versus percentual drug release divided by the area (cm2) of the membrane
24
used in the assay (Y = Y/0.64). Significance matrix is shown for the difference between formulations (slopes’ 25
comparison using an F test). 26
Formulation Percentual drug release Significance matrix
R2 Drug release rate (%·cm-2·min-1/2) H0 .2 F OS H0 .5 F OS P 1 2 F OS P 1 5 F OS P 1 2 H 0 .2 F OS P 1 3 H 0 .2 F OS FOS solution 0.9905 18.3 ± 1.3 NS 0.0190 NS < 0.0001 < 0.0001 < 0.0001 H0.2FOS 0.9902 15.8 ± 0.9 - < 0.0001 NS < 0.0001 < 0.0001 < 0.0001 H0.5FOS 0.9986 14.3 ± 0.3 - - NS 0.0004 < 0.0001 < 0.0001 P12FOS 0.9988 14.5 ± 0.3 - - - 0.0260 0.0014 0.0008 P15FOS 0.9972 11.7 ± 0.3 - - - - 0.0223 0.0036 P12H0.2FOS 0.9966 10.6 ± 0.2 - - - NS P13H0.2FOS 0.9981 9.8 ± 0.2
FOS – fosphenytoin; H - hydroxypropyl methylcellulose; NS – not significant (statistical difference); P – Pluronic; R2 – 27
linear regression’s coefficient of determination. 28
Theoretically, a formulation with a higher viscosity slows down drug diffusion more, leading to a 1
more sustained and/or overall lower release. Our results were mostly in agreement with that, with a 2
strong negative correlation existing between zero shear viscosity at 32 ºC and drug release 3
percentage at the final time point (Spearman’s correlation test, two-tailed, p < 0.0001, rS = - 0.756). 4
Nevertheless, the formulations combining both the thermosensitive and the mucoadhesive 5
polymers, which were not most viscous, had the slowest drug release. This might be due to an 6
interaction between the two polymers and the drug. 7
Considering osmolality, viscosity and in vitro drug release results, we decided that the formulation 8
containing HPMC at 0.5% would be the best choice for further studies, due to several reasons: it 9
was potentially mucoadhesive and had a high enough viscosity at 32 ºC to possibly help retain the 10
formulation in the nasal cavity, but not so high that it slowed or decreased drug release in a 11
substantial way; viscosity at 20 ºC allowed administration; and regarding osmolality (and osmotic 12
safety) it allowed a higher drug strength than the preparations containing Pluronic. 13
Hence, from the formulations containing albumin we also chose HPMC at 0.5% and went on to 14
verifying whether the addition of albumin to the polymeric preparation altered drug release in any 15
way. Results showed that there was no considerable difference in drug release from H0.5FOS + 16
albumin, in any of the studied parameters, being similar to those obtained for H0.5FOS (data not 17
shown). 18
Formulations H0.5FOS and H0.5FOS + albumin were, therefore, selected for further evaluation in 19
in vivo pharmacokinetic studies, administered through the intranasal route. Drug strength was 20
increased and set at 50 mg/g, corresponding to an osmolality between 300 and 400 mOsmol/kg, 21
values that are regarded as safe for intranasal administration (Marx et al., 2015). 22
23
3.3. In vivo pharmacokinetic study 24
Bioanalytical method validation results are presented in the appendix B (section B.4). 25
Fosphenytoin is a dianionic molecule with reduced permeability, but in a previous ex vivo 26
permeation study a small amount of this prodrug was shown to permeate (Antunes Viegas et al., 27
2016). We wished to know whether fosphenytoin could reach the brain in its unmetabolized form 28
when administered intranasally. Despite the developed procedure, preventing fosphenytoin 29
conversion to phenytoin after sample collection, fosphenytoin levels were always below the limit of 30
quantification of 0.3 µg/mL (blood) and 1.5 µg/g (brain), even at short time points (5 or 10 31
minutes). However, it is not certain whether in vivo the absence of fosphenytoin quantification is 32
due to it being converted to phenytoin before absorption, or if some fosphenytoin may permeate as 33
such and be converted immediately afterwards, since intravenous administration also led to 34
unquantifiable fosphenytoin. In fact, fosphenytoin has a short and species-dependent conversion 35
half-life. Fosphenytoin’s conversion to phenytoin in the blood is complete about 15 minutes after 36
intravenous infusion in humans, and 10 minutes after intravenous infusion or intramuscular 37
administration in rabbits, however in rats conversion is essentially complete after 5 minutes 38
(Muchohi et al., 2002; U.S. Food and Drug Administration, 2011a; Walton et al., 1999). Moreover, 39
all those studies used higher drug doses, varying between 10 and 30 mg of phenytoin equivalents 40
per kg of animal body mass, whereas in our study drug doses only reached 5.8 mg/kg. Logically, 41
with lower doses conversion is likely to be completed sooner. 42
Looking at phenytoin’s brain and blood concentration over time (Figure 4), it is noticeable that the 1
intravenous solution produced higher concentrations at earlier time points (p < 0.01, two-way 2
ANOVA). Tmax in the brain was 120 minutes (2 hours) for the intravenous administration and 240 3
minutes (4 hours) for the intranasal administrations (Table 4). Even assuming that effective brain 4
concentrations can be achieved before Tmax, it still indicates that the intranasal delivery of prodrugs 5
like fosphenytoin, at least with the present formulation strategy, may not lead to a fast therapeutic 6
effect, as is required in emergency situations. This is possibly explained by the need of prodrug 7
conversion occurring before effective drug diffusion through the nasal mucosa. 8
9
Figure 4. Curves of phenytoin concentration as a function of time in brain (A) and blood (B). Data are 10
presented as mean ± SEM. Only significance levels for significant differences obtained when comparing one 11
condition to all others are shown: **** p < 0.0001 and ** p < 0.01, two-way ANOVA analysis with Tukey’s 12
multiple comparisons post-test; FOS – fosphenytoin; H – hydroxypropyl methylcellulose; IN – intranasal; IV 13
– intravenous. 14
15
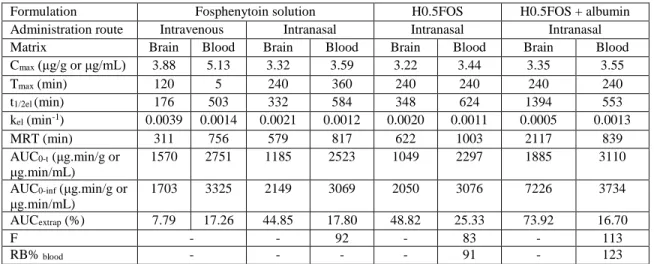
Table 4. Pharmacokinetic parameters determined for phenytoin levels, in both brain and blood, for all tested 16
formulations and administration routes. 17
Formulation Fosphenytoin solution H0.5FOS H0.5FOS + albumin Administration route Intravenous Intranasal Intranasal Intranasal Matrix Brain Blood Brain Blood Brain Blood Brain Blood Cmax (μg/g or μg/mL) 3.88 5.13 3.32 3.59 3.22 3.44 3.35 3.55 Tmax (min) 120 5 240 360 240 240 240 240 t1/2el (min) 176 503 332 584 348 624 1394 553 kel (min-1) 0.0039 0.0014 0.0021 0.0012 0.0020 0.0011 0.0005 0.0013 MRT (min) 311 756 579 817 622 1003 2117 839 AUC0-t (μg.min/g or μg.min/mL) 1570 2751 1185 2523 1049 2297 1885 3110
AUC0-inf (μg.min/g or
μg.min/mL)
1703 3325 2149 3069 2050 3076 7226 3734
AUCextrap (%) 7.79 17.26 44.85 17.80 48.82 25.33 73.92 16.70
F - - 92 - 83 - 113
RB% blood - - - - 91 - 123
AUC0-t – area under the curve of drug concentration as a function of time, from time zero to the last quantifiable drug 18
concentration; AUC0-inf – area under the curve, from time zero to infinite; AUCextrap (%) – percentage of the AUC that was 19
extrapolated, from the last quantifiable drug concentration to infinite; F – absolute blood bioavailability (intranasal 20
formulation vs intravenous solution); Cmax – maximum drug concentration; FOS – fosphenytoin; H – hydroxypropyl 21
methylcellulose; IN – intranasal; IV – intravenous; kel – elimination rate constant; MRT – mean retention time; RB% blood 22
– relative blood bioavailability (intranasal formulation vs intranasal solution); t1/2el – elimination half-life; Tmax – time to 23
reach maximum drug concentration. 24
25
The brain and blood profiles of the intranasal drug solution and the intranasal H0.5FOS formulation 26
largely overlap (Figure 4). Therefore, overall HPMC did not benefit nor reduce drug absorption. 27
Phenytoin’s Cmax in the brain was relatively similar between all formulations and administration 28
routes (3.2 to 3.9 μg/g) (Table 4). Blood Cmax was also quite similar for all intranasal formulations 29
(3.4 to 3.6 μg/mL) but was substantially higher for the intravenous administration (5.1 μg/mL), 30
which suggests that the intranasal route could be safer in what concerns maximum systemic drug 31
levels. Importantly, this small single dose administration already achieved half of the lower limit of 1
these rodents’ therapeutic level, which is around 7-12 μg/mL (Markowitz et al., 2010). 2
The addition of albumin at 2% to the formulation (H0.5FOS + albumin) prolonged phenytoin’s 3
blood and brain drug levels, since phenytoin’s concentration at 480 minutes (8 hours) and, more 4
significantly, at 720 minutes (12 hours) was clearly higher that the obtained with the other 5
formulations (p < 0.0001, two-way ANOVA) (Figure 4). This could, hypothetically, be explained 6
by intracellular neural transport to the brain, as previously demonstrated for albumin (Falcone et al., 7
2014), since intracellular transport is slow when compared to extracellular diffusion, and/or 8
increased retention in the nasal cavity. 9
Given the larger uncertainty obtained in brain phenytoin’s pharmacokinetic profile in intravenous 10
administration, partially due to the high limit of quantification of the method, elimination and AUC 11
parameters are shown (Table 4) but are likely less reliable in this matrix. Therefore, we decided not 12
to calculate absolute brain bioavailability or brain targeting ratios. However, blood bioavailability is 13
for phenytoin a good indicator of brain bioavailability as well. All intranasal formulations, and 14
especially the formulation with albumin, led to high absolute bioavailability, with the formulation 15
containing albumin having a bioavailability about 30% higher than the simple aqueous intranasal 16
fosphenytoin solution (Table 4). This is clearly associated with the sustained phenytoin levels. 17
Phenytoin is a good example of a very low water solubility drug, estimated as being only 0.032 18
mg/mL for its sodium salt (National Center for Biotechnology Information, n.d.). Its marketed 19
solution, to be administered through intravenous infusion, reaches a drug strength of 50 mg/mL, but 20
drug solubilization is only achieved by using 40% propylene glycol and 10% ethanol, a high 21
percentage of potentially harmful organic solvents, and pH 12, a high pH that can also be associated 22
with toxicity. Serious and sometimes fatal dermatological reactions have been reported to occur, 23
varying from mild irritation and inflammation to tissue necrosis (U.S. Food and Drug 24
Administration, 2011b). It is, for sure, not suitable for nasal administration. A few studies report 25
attempts to increase phenytoin’s solubility without the use of potentially toxic excipients, however, 26
achieved drug concentrations have mostly been low. And even though for some therapeutic 27
indications a low phenytoin strength (0.01 to 0.2 mg/mL) might be enough, and is even desired, 28
such as in topical wound healing, for epilepsy treatment, especially for the management of seizures, 29
higher strengths are required (Baharvand et al., 2014; Teo et al., 2016). Self-emulsifying drug 30
delivery systems for oral delivery reported phenytoin concentrations reaching up to 25 mg/mL (Atef 31
and Belmonte, 2008; Ye et al., 2019). In our study, by using phenytoin’s hydrophilic prodrug, 32
fosphenytoin, we obtained a higher strength of phenytoin equivalents than any of the reported 33
works, reaching around 35 mg/mL (50 mg/mL of fosphenytoin). Furthermore, we could still further 34
increase it by 2- or 3-fold, as osmolality was not very high yet, and fosphenytoin has a higher 35
aqueous solubility than the concentration we selected and/or perform multiple administrations. 36
Thus, therapeutic levels are likely achievable. Moreover, the developed fosphenytoin formulations 37
are simple to prepare and safe to administer, since they have no potentially toxic excipients in their 38
composition. 39
In conclusion, intranasal fosphenytoin efficiently permeated and/or was converted to the diffusible 40
active form in vivo, reaching high absolute bioavailability. Therefore, the use of phosphate ester 41
prodrugs is an efficient and safe way of increasing the intranasal delivery of poorly soluble drugs 42
such as phenytoin. Moreover, the addition of albumin to the formulation can prolong the drug’s 43
disposition in the brain compared to other intranasal formulations, enabling a better drug targeting. 44
1
4. Acknowledgements and funding 2
We thank JPN Pharma (Tarapur, India) and Jai Radhe Sales (Ahmedabad, India) for donating part 3
of the fosphenytoin sodium powder used in formulation preparation. Patrícia C. Pires and part of the 4
work was supported by European Regional Development funds through the Operational Programme 5
“Centro 2020”, through the ICON project (Interdisciplinary Challenges On Neurodegeneration, 6
reference CENTRO-01-0145-FEDER-000013). Part of the work was supported by national funds 7
through “Fundação para a Ciência e a Tecnologia” (reference UIDB/00709/2020). 8
9
5. Declaration of interests 10
The authors declare no conflicts of interest. 11
12
6. References 13
Antunes Viegas, D., Rodrigues, M., Francisco, J., Falcão, A., Alves, G., Santos, A.O., 2016. 14
Development and application of an ex vivo fosphenytoin nasal bioconversion/permeability 15
evaluation method. Eur. J. Pharm. Sci. 89, 61–72. https://doi.org/10.1016/j.ejps.2016.04.018 16
Atef, E., Belmonte, A.A., 2008. Formulation and in vitro and in vivo characterization of a 17
phenytoin self-emulsifying drug delivery system (SEDDS). Eur. J. Pharm. Sci. 35, 257–263. 18
https://doi.org/10.1016/j.ejps.2008.07.004 19
Baharvand, M., Mortazavi, A., Mortazavi, H., Yaseri, M., 2014. Re-evaluation of the first phenytoin 20
paste healing effects on oral biopsy ulcers. Ann. Med. Heal. Sci. Res. 4, 858–862. 21
https://doi.org/10.4103/2141-9248.144877 22
Erdó, F., Bors, L.A., Farkas, D., Bajza, Á., Gizurarson, S., 2018. Evaluation of intranasal delivery 23
route of drug administration for brain targeting. Brain Res. Bull. 143, 155–170. 24
https://doi.org/10.1016/j.brainresbull.2018.10.009 25
Falcone, J.A., Salameh, T.S., Yi, X., Cordy, B.J., Mortell, W.G., Kabanov, A. V, Banks, W.A., 26
2014. Intranasal administration as a route for drug delivery to the brain: evidence for a unique 27
pathway for albumin. J. Pharmacol. Exp. Ther. 54–60. 28
FDA, CDER, CVM, 2018. Bioanalytical method validation - guidance for industry. 29
Glauser, T., Shinnar, S., Gloss, D., Alldredge, B., Arya, R., Bainbridge, J., Bare, M., Bleck, T., 30
Dodson, W.E., Garrity, L., Jagoda, A., Lowenstein, D., Pellock, J., Riviello, J., Sloan, E., 31
Treiman, D.M., 2016. Evidence-based guideline: treatment of convulsive status epilepticus in 32
children and adults - report of the Guideline Committee of the American Epilepsy Society. 33
Epilepsy Curr. 16, 48–61. https://doi.org/10.5698/1535-7597-16.1.48 34
Kapoor, M., Cloyd, J.C., Siegel, R.A., 2016. A review of intranasal formulations for the treatment 35
of seizure emergencies. J. Control. Release 237, 147–159. 36
https://doi.org/10.1016/j.jconrel.2016.07.001 37
Karavasili, C., Fatouros, D.G., 2016. Smart materials: in situ gel-forming systems for nasal 38
delivery. Drug Discov. Today 21, 157–166. https://doi.org/10.1016/j.drudis.2015.10.016 39
Kiriakopoulos, E., Shafer, P.O., 2017. Types of seizures [WWW Document]. Epilepsy Found. URL 1
https://www.epilepsy.com/learn/types-seizures (accessed 9.20.09). 2
Lai, C.M., Moore, P., Quon, C.Y., 1995. Binding of fosphenytoin, phosphate ester pro drug of 3
phenytoin, to human serum proteins and competitive binding with carbamazepine, diazepam, 4
phenobarbital, phenylbutazone, phenytoin, valproic acid or warfarin. Res. Commun. Mol. 5
Pathol. Pharmacol. 88, 51–62. 6
Maglalang, P.D., Rautiola, D., Siegel, R.A., Fine, J.M., Hanson, L.R., Coles, L.D., Cloyd, J.C., 7
2018. Rescue therapies for seizure emergencies: new modes of administration. Epilepsia 59, 8
207–215. https://doi.org/10.1111/epi.14479 9
Markowitz, G.J., Kadam, S.D., Boothe, D.M., Irving, N.D., Comi, A.M., 2010. The 10
pharmacokinetics of commonly used antiepileptic drugs in immature CD1 mice. Neuroreport 11
21, 452–456. https://doi.org/10.1038/jid.2014.371 12
Marx, D., Williams, G., Birkhoff, M., 2015. Intranasal drug administration — an attractive delivery 13
route for some drugs, in: Drug Discovery and Development - From Molecules to Medicine. 14
pp. 299–320. 15
Muchohi, S.N., Kokwaro, G.O., Maitho, T.E., Munenge, R.W., Watkins, W.M., Edwards, G., 2002. 16
Pharmacokinetics of phenytoin following intravenous and intramuscular administration of 17
fosphenytoin and phenytoin sodium in the rabbit. Eur. J. Drug Metab. Pharmacokinet. 27, 83– 18
89. https://doi.org/10.1007/BF03190421 19
Musumeci, T., Bonaccorso, A., Puglisi, G., 2019. Epilepsy disease and nose-to-brain delivery of 20
polymeric nanoparticles: an overview. Pharmaceutics 11. 21
https://doi.org/10.3390/pharmaceutics11030118 22
National Center for Biotechnology Information, n.d. Phenytoin, CID = 1775 [WWW Document]. 23
PubChem Database. URL https://pubchem.ncbi.nlm.nih.gov/compound/Phenytoin (accessed 24
3.16.20). 25
Pires, P.C., Peixoto, D., Teixeira, I., Rodrigues, M., Alves, G., Santos, A.O., 2020. Nanoemulsions 26
and thermosensitive nanoemulgels of phenytoin and fosphenytoin for intranasal 27
administration: formulation development and in vitro characterization. Eur. J. Pharm. Sci. 141. 28
https://doi.org/10.1016/j.ejps.2019.105099 29
Pires, P.C., Santos, A.O., 2018. Nanosystems in nose-to-brain drug delivery: a review of non-30
clinical brain targeting studies. J. Control. Release 270, 89–100. 31
https://doi.org/10.1016/j.jconrel.2017.11.047 32
Poplawska, M., Borowicz, K., Czuczwar, S., 2015. The safety and efficacy of fosphenytoin for the 33
treatment of status epilepticus. Expert Rev. Neurother. 15, 983–992. 34
https://doi.org/10.1586/14737175.2015.1074523 35
Ramteke, K.H., Dighe, P.A., Kharat, A.R., Patil, S. V, 2014. Mathematical models of drug 36
dissolution: a review. Sch. Acad. J. Pharm. 3, 388–396. 37
Shaikh, R., Singh, T., Garland, M.J., Woolfson, A.D., Donnelly, R.F., 2011. Mucoadhesive drug 38
delivery systems. J. Pharm. Bioallied Sci. 3, 89–100. https://doi.org/10.4103/0975-7406.76478 39
Shih, J.J., Whitlock, J.B., Chimato, N., Vargas, E., Karceski, S.C., Frank, R., 2016. Epilepsy 40
treatment in adults and adolescents: expert opinion, 2016. Epilepsy Behav. 69, 186–222. 41
https://doi.org/10.1016/j.yebeh.2016.11.018 42
Teo, S.Y., Yew, M.Y., Lee, S.Y., Rathbone, M.J., Gan, S.N., Coombes, A.G.A., 2016. In vitro 1
evaluation of novel phenytoin-loaded alkyd nanoemulsions designed for application in topical 2
wound healing. J. Pharm. Sci. 106, 377–384. https://doi.org/10.1016/j.xphs.2016.06.028 3
U.S. Food and Drug Administration, 2019. Nayzilam - New Drug Application [WWW Document]. 4
Drugs@FDA FDA Approv. Drug Prod. URL 5
https://www.accessdata.fda.gov/scripts/cder/daf/index.cfm?event=overview.process&ApplNo 6
=211321 (accessed 2.20.20). 7
U.S. Food and Drug Administration, 2011a. Cerebyx ® (fosphenytoin sodium) injection [WWW 8
Document]. FDA Approv. labeling text. URL 9
https://www.accessdata.fda.gov/drugsatfda_docs/label/2011/020450s008s009s016s019lbl.pdf 10
(accessed 3.16.20). 11
U.S. Food and Drug Administration, 2011b. Dilantin ® (phenytoin sodium) injection [WWW 12
Document]. FDA Approv. labeling text. URL 13
https://www.accessdata.fda.gov/drugsatfda_docs/label/2011/010151s036lbl.pdf (accessed 14
3.16.20). 15
United States Pharmacopeial Convention, 2017. <1724> Semisolid drug products, in: United States 16
Pharmacopeia 40th Edition - National Formulary 35th Edition. pp. 2056–2067. 17
Walton, N.Y., Uthman, B.M., Yafi, K. El, Kim, T.M., Treiman, D.M., 1999. Phenytoin penetration 18
into brain after administration of phenytoin or fosphenytoin. Epilepsia 40, 153–156. 19
https://doi.org/10.1111/j.1528-1157.1999.tb02068.x 20
World Health Organization, 2019. Epilepsy: a public health imperative. Summary. Geneva. 21
https://doi.org/WHO/MSD/MER/19.2 22
Ye, J., Wu, H., Huang, C., Lin, W., Zhang, C., Huang, B., Lu, B., Xu, H., Li, X., Long, X., 2019. 23
Comparisons of in vitro Fick’s first law, lipolysis, and in vivo rat models for oral absorption 24
on BCS II drugs in SNEDDS. Int. J. Nanomedicine 14, 5623–5636. 25
https://doi.org/10.1093/nar/gkx1037. 26
Zaccara, G., Giannasi, G., Oggioni, R., Rosati, E., Tramacere, L., Palumbo, P., 2017. Challenges in 27
the treatment of convulsive status epilepticus. Seizure 47, 17–24. 28
https://doi.org/10.1016/j.seizure.2017.02.015 29
Zhang, Y., Huo, M., Zhou, J., Xie, S., 2010. PKSolver: An add-in program for pharmacokinetic and 30
pharmacodynamic data analysis in Microsoft Excel. Comput. Methods Programs Biomed. 99, 31
306–314. https://doi.org/10.1016/j.cmpb.2010.01.007 32
Figures 1 2 Figure 1. 3 4 Figure 2. 5
1 Figure 3. 2 3 Figure 4. 4 5
Appendices 1
2
Appendix A. Supplementary methods 3
4
A.1. In vitro drug release spectrophotometric assay validation 5
The calibration standards were prepared by dilution of a more concentrated simple aqueous 6
fosphenytoin solution, using nasal simulant buffer, to obtain drug concentrations of 4.11, 8.22, 16.44, 7
32.88, 65.75 and 105.20 μg/mL. The lower limit of quantification (LLOQ) was defined as the lowest 8
analyte concentration that could be quantified with acceptable inter/intraday precision and accuracy. 9
To assess linearity, a mean calibration curve was determined using data from 6 individual curves (n 10
= 6), each done on a different day. Precision’s specification corresponded to a coefficient of variation 11
lower than or equal to 15% (or 20% for the LLOQ) and accuracy (% of bias) had to be within ± 15% 12
(or ± 20% for the LLOQ). 13
14
A.2. In vitro drug release high-performance liquid chromatography assay validation 15
For the preparation of the calibration standards a stock solution of fosphenytoin at 5 mg/mL was made 16
by dissolving the powder in methanol, and from this solution an intermediate one at 0.5 mg/mL was 17
prepared by dilution in nasal fluid simulant buffer. To obtain the desired concentrations, the final 18
dilution was also made in that same buffer, preparing calibration standards with fosphenytoin at 0.25 19
(LLOQ), 0.50, 2.00, 5.00, 10.00, 15.00, 20.00 and 25.00 μg/mL. Then 100 μL of each of these 20
calibration standards were mixed with 20 μL of perchloric acid at 10% (v/v) by vortexing for 15 21
seconds, followed by centrifugation (microcentrifuge, Gyrozen, Daejeon, South Korea) at 13500 rpm 22
for 5 minutes. The supernatant was then transferred into a glass vial for quantification. Quality control 23
(QC) samples were prepared using the same methodology, but from an independent stock solution, 24
at 0.75, 12.50 and 22.50 μg/mL (QC1, QC2 and QC3, respectively). An additional sample was also 25
prepared at the concentration of the LLOQ (QCLLOQ). 26
27
A.3. In vivo pharmacokinetic study high-performance liquid chromatography assay validation 28
From methanol stock fosphenytoin and phenytoin solutions intermediate ones at 100 μg/mL were 29
prepared by dilution. Finally, for the spiking of the calibration standards, we prepared combined 30
solutions of fosphenytoin and phenytoin, from either stock or intermediate solutions, by dilution in 31
water-methanol (50:50, v/v). Fosphenytoin’s concentration in these solutions was 1.5, 3.0, 10.0, 25.0, 32
50.0 or 75.0 μg/mL, and phenytoin’s concentration was 1.5, 3.0, 10.0, 50.0, 100.0 or 150.0 μg/mL. A 33
separate spiking solution was prepared for the internal standard, at 50 μg/mL. 34
The calibration standards were prepared by spiking aliquots of 80 μL of blank matrices (either mice 35
acidified blood or brain homogenate) with 20 μL of one of the combined spiking solutions (5-fold 36
dilution), being that the final concentration ranges were 0.3 - 15 μg/mL for fosphenytoin and 0.3 – 30 37
μg/mL for phenytoin. QC samples were prepared at 0.9 (QC1), 7.5 (QC2) and 13.5 (QC3) μg/mL for 38
fosphenytoin and 0.9 (QC1), 15.0 (QC2) and 27.0 (QC3) μg/mL for phenytoin. 39
After spiking, both calibration standard samples and QC samples were processed as described in 1
section 2.5.2 of the main article. For linearity assessment the functions used as weighting factors in 2
the transformation of the data by a weighted linear regression were 1/x2 for blood samples and 1/y2 3
for brain samples. Method selectivity was evaluated by processing and analyzing blank acidified 4
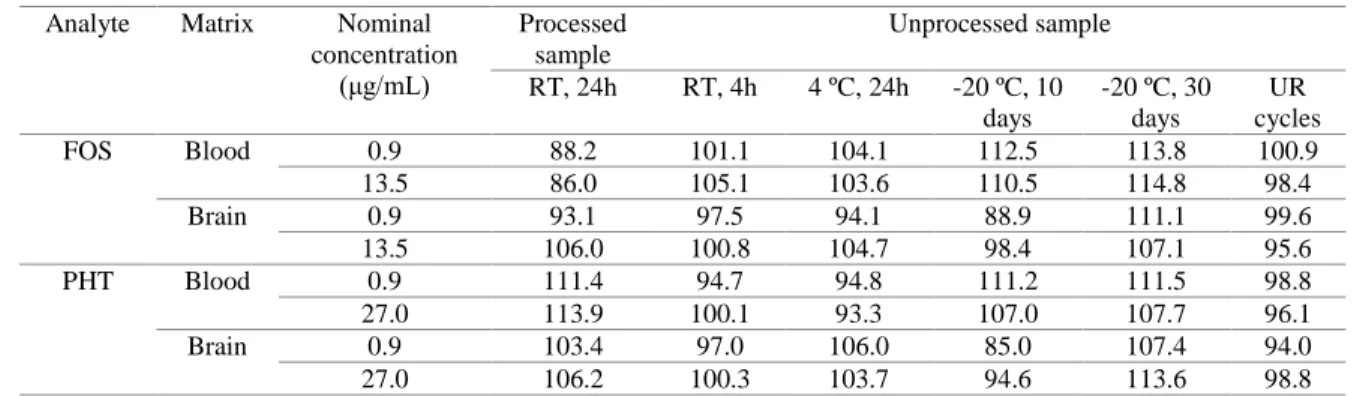
blood or brain samples (matrix without analytes or internal standard) from six different mice. 5
Short and long-term sample stability were also evaluated for QC1 and QC3 samples, in replicates (n 6
= 5). For the evaluation of pre-processing stability, and attempting to simulate predicted handling and 7
storage settings, studied conditions included room temperature for 4 hours, 4 ºC for 24 hours, and -8
20 ºC for 10 and 30 days. Post-processing stability was evaluated at room temperature for 24 hours, 9
which is the estimated maximum amount of time for which samples are kept in the auto-sampler 10
before analysis. Additionally, the effect of 24 hour freeze-thaw cycles in unprocessed samples was 11
also assessed by keeping them at -20 ºC and doing 3 cycles of sample unfreezing/refreezing, on three 12
consecutive days. 13
14
Appendix B. Supplementary results 15
16
B.1. Gelation temperatures 17
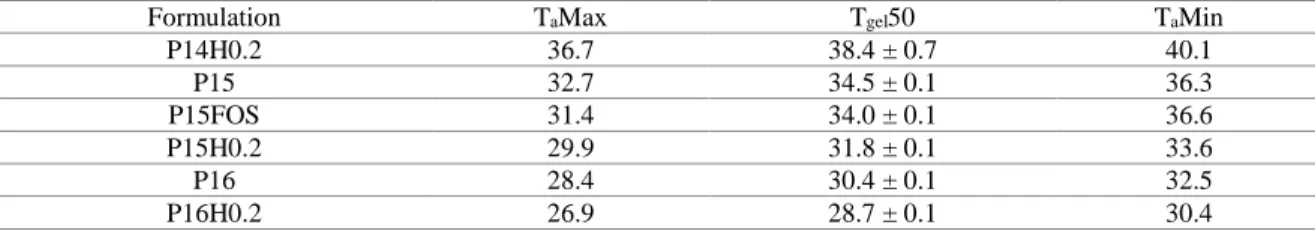
Table B1. Gelation temperatures of formulations containing Pluronic at 14, 15 or 16% (w/w), with or without 18
HPMC or fosphenytoin. Tgel50 was determined by applying a non-linear regression model (log(agonist) vs. 19
response, variable slope, four parameters) to the “viscosity vs temperature” data. TaMax and TaMin were 20
correspondingly calculated as the maximum and minimum of the second derivative of the function given by the 21
non-linear regression model obtained for the determination of Tgel50. 22
Formulation TaMax Tgel50 TaMin
P14H0.2 36.7 38.4 ± 0.7 40.1 P15 32.7 34.5 ± 0.1 36.3 P15FOS 31.4 34.0 ± 0.1 36.6 P15H0.2 29.9 31.8 ± 0.1 33.6 P16 28.4 30.4 ± 0.1 32.5 P16H0.2 26.9 28.7 ± 0.1 30.4
FOS – fosphenytoin; H or HPMC – hydroxypropyl methylcellulose; P – Pluronic; TaMax – maximum acceleration 23
temperature, considered as the temperature at which gelation starts; TaMin – minimum acceleration temperature, considered 24
as the temperature at which gelation ends; Tgel50 – half-gelation temperature; 25
26
B.2. In vitro drug release spectrophotometric assay validation 27
Linearity ranged from 4.11 to 105.20 μg/mL (R2 ≥ 0.99). The LLOQ was experimentally determined 28
and set at 4.11 μg/mL, with adequate precision and accuracy (CV and |bias| < 17%), 29
and all the other calibration curves’ samples also showed precision and accuracy 30
within the acceptance criteria (CV and |bias| < 10%) (Table B2). 31
32
Table B2. Precision and accuracy obtained for the calibration curves’ samples in the spectrophotometric 33
method developed to quantify in vitro drug release. 34
Nominal concentration (μg/mL) Precision (CV, %) Accuracy (bias, %)