*Correspondence: Ehsan Adeli.The International Branch. Shahid Beheshti University of Medical Sciences. No. 19, Shahid Abbaspour St., Vali-Asr Ave, Tehran, Iran. E-mail: [email protected] or [email protected]
A
vol. 52, n. 1, jan./mar., 2016 <http://dx.doi.org/10.1590/S1984-82502016000100002
Preparation and evaluation of azithromycin binary solid dispersions
using various polyethylene glycols for the improvement of the drug
solubility and dissolution rate
Ehsan Adeli
*The International Branch, Shahid Beheshti University of Medical Sciences, Tehran, Iran
Azithromycin is a water-insoluble drug, with a very low bioavailability. In order to increase the solubility and dissolution rate, and consequently increase the bioavailability of poorly-soluble drugs (such as azithromycin), various techniques can be applied. One of such techniques is “solid dispersion”. This technique is frequently used to improve the dissolution rate of poorly water-soluble compounds. Owing to its low solubility and dissolution rate, azithromycin does not have a suitable bioavailability. Therefore, the main purpose of this investigation was to increase the solubility and dissolution rate of azithromycin by preparing its solid dispersion, using diferent Polyethylene glycols (PEG). Preparations of solid dispersions and physical mixtures of azithromycin were made using PEG 4000, 6000, 8000, 12000 and 20000 in various ratios, based on the solvent evaporation method. From the studied drug release proile, it was discovered that the dissolution rate of the physical mixture, as the well as the solid dispersions, were higher than those of the drug alone. There was no chemical incompatibility between the drug and polymer from the observed Infrared (IR) spectra. Drug-polymer interactions were also investigated using Diferential Scanning Calorimetry (DSC), Powder X-Ray Difraction (PXRD) and Scanning Election Microscopy (SEM). In conclusion, the dissolution rate and solubility of azithromycin were found to improve signiicantly, using hydrophilic carriers, especially PEG 6000.
Uniterms: Azithromycin/solubility. Azithromycin/dissolution. Solid dispersion. Polyethylene glycols.
A azitromicina é um fármaco insolúvel em água, com biodisponibilidade muito baixa. A im de aumentar a taxa de solubilidade e dissolução e, consequentemente, aumentar a biodisponibilidade de fármacos fracamente solúveis (tais como azitromicina), várias técnicas podem ser aplicadas. Uma dessas técnicas é a “dispersão sólida”, frequentemente usada para melhorar a taxa de dissolução de compostos fracamente solúveis em água. Devido à baixa taxa de solubilidade e de dissolução, este fármaco não tem biodisponibilidade adequada. Portanto, o principal objetivo desta pesquisa foi o de aumentar a taxa de solubilidade e dissolução da azitromicina, preparando a sua dispersão sólida, utilizando diferentes glicóis de polietileno (PEG). As dispersões sólidas e as misturas físicas de azitromicina foram preparadas utilizando PEG 4000, 6000, 8000, 12000 e 20000, em várias proporções, com base no método de evaporação do solvente. O peril de liberação do fármaco foi estudado e veriicou-se que tanto a taxa de dissolução da mistura física quanto as dispersões sólidas foram maiores do que as do fármaco sozinho. Espectros de IR não revelaram incompatibilidade química entre o fármaco e o polímero. Interações fármaco-polímero também foram investigadas usando calorimetria diferencial de varredura (DSC), Difração de Raios X (PXRD) e Microscopia Eletrônica de Varredura(SEM). Em conclusão, a taxa de dissolução e a solubilidade da azitromicina melhoraram, de forma signiicativa, utilizando suportes hidrofílicos, especialmente PEG 6000.
INTRODUCTION
Azithromycin (Figure 1) is a semi-synthetic antibiotic obtained from erythromycin. It is a Macrolide antibiotic. This drug is a nitrogen-containing macrolide (Azalide), with indications and usage similar to Erythromycin. All macrolides, such as azithromycin inhibit RNA dependent protein synthesis by binding reversibly to the 50S ribosomal subunits of susceptible microorganisms (Patil
et al., 2011; Montejo-Bernardo et al., 2005; Beckers et al., 1995; Champney, Burdine, 1998). This antibiotic is one of the world’s best-selling antibiotics, and is currently the world’s most widely consumed antibiotic (WIPO, 2012). The dihydrate form of this drug is a white crystalline powder, with a molecular formula of C38H72N2O12.2H2O
and molecular weight of 748.984 g.mol-1 (Mofat et al., 2011; USP, 2007; Amidon, 1995). It is used orally for the treatment of bronchitis, certain types of skin infections, sore throat, pharyngitis, tonsillitis, nosocomial infections and pneumonia. The excellent activity against Chlamydia trachomatis is its unique feature (Sweetman, 2009). It is
prescribed for the treatment of respiratory-tract infections (including otitis media) and also for skin and soft-tissue infections. Azithromycin can also be used for prophylaxis, and act as a component of drug regimen in the treatment of
Mycobacterium avium complex (MAC) infections. It has
activity against gram-positive organisms and also ofers an increased gram-negative coverage over erythromycin and clarithromycin (Mofat et al., 2011; Sweetman, 2009;
Palanisamy, Khanam, 2011).
Poorly water-soluble drugs could create problems regarding decreased drug efectiveness. Majority of the drugs, which are soluble in small amounts of water, have low bioavailability. The efort to improve the dissolution and solubility of a poorly water-soluble drug remains one of the most challenging tasks in drug development. Many approaches are used to increase the dissolution rate of
drugs, including solid dispersion, chemical modiication, micronization, co‐solvency, complexation, pH adjustment, and micellar-solubilization.
The use of solid dispersions in improving the solubility of poorly water-soluble drugs dates back to 1961 (Sekiguchi, Obi, 1961; Patil et al., 2013; Damian et al., 2000). Solid dispersions could be prepared by diferent methods, including melting, solvent and melting-solvent techniques (Patil et al., 2013; Chiou, Riegelman, 1971).
One common method in preparing solid dispersions is the melt-congealing or solvent evaporation method (Al-Hamidi et al., 2010; Han et al., 2011). The transformation
of drugs in solid dispersions from amorphous form to crystalline form is a critical obstacle in making solid dispersions and a practical approach in the pharmaceutical industry. However, the utilization of surface adsorbents can be a useful approach to tackle this problem (Li et al., 2011; Patil, Gaikwad, 2011; Leuner, Dressman, 2000; Adeli, Mortazavi, 2014). It involves the formation of eutectic mixtures of drug with water-soluble carriers, by melting their physical mixtures. After dissolving the carrier, the drug precipitates in a inely divided state in water. Different mechanisms are considered for drug solubility and dissolution rate enhancement, using solid dispersions. Particle size reduction of drug to submicron size and the consequent increase in surface area seem to be the most important (Okonogi, Puttipipatkhachorn, 2006; Mura et al., 2005; Craig, 2002).
The solid dispersion technique has been used for a wide variety of poorly water-soluble drugs such as irbesartan (Adeli, 2015), nimesulide (Babu et al., 2003)
and ursodeoxycholic acid (Okonogi et al., 1997). One major problem associated with azithromycin is its very poor solubility (belongs to BCS class II) in biological luids which accounts for the poor bioavailability, upon its oral administration. In this study, the solid dispersion method was utilized in order to increase the dissolution rate and solubility of azithromycin. Although there have been previous studies on this technology for over half-a-century, its application in drug development has attained greater importance since early 1990s owing to the widespread application of combinatorial chemistry and high-throughput screening in drug discovery, which favors the selection of poorly water-soluble new chemical entities (NCEs) (Vasanthavada et al., 2008; Pudipeddi et al., 2006).
MATERIAL AND METHODS
Material
Azithromycin dihydrate, PEG 4000, PEG 6000,
PEG 8000, PEG 12000 and PEG 20000 were purchased from Fluka, USA. Sodium hydrogen phosphate, sodium hydroxide and ethanol 96% were purchased from Merck, USA. All the chemical reagents used were of analytical grade.
Methods
Preparation of physical mixtures
With great precision, 100 mg of pure azithromycin and appropriate amounts of PEG (4000, 6000, 8000, 12000 and 20000) in various drug-to-carrier weight ratios were weighed and thoroughly blended in a glass mortar for 5 min (as an example, PM1 (1:1) was prepared by 100 mg of azithromycin and 100 mg of PEG 4000, PM9 (1:7) was prepared by 100 mg of azithromycin and 700 mg of PEG 6000, similarly to PM25 (1:9), which was prepared by 100 mg of azithromycin and 900 mg of PEG 20000). The composition of various batches is shown in Table I. The physical mixtures were prepared by weighing the calculated amounts of azithromycin, followed by trituration mixture of the carrier (PEG) with the drug in a glass mortar. The samples prepared were kept for further studies.
Preparation of solid dispersions
Solid dispersions of azithromycin were prepared in drug: carrier weight ratios as 1:1, 1:3, 1:5, 1:7 and 1:9, using the solvent evaporation method. 100 mg of azithromycin dihydrate was dissolved in 10 mL of 96% ethanol and the carrier was then added and dissolved at 40 °C, following continuous mixing on a hot plate to obtain a clear solution. Afterwards, the solvent was allowed to evaporate. The prepared solid dispersions (Table I) were collected, sieved, and stored in desiccators until subsequent analysis. The process of evaporation was opted until a constant weight was obtained. Overall, the yield was approximately 98%.
Analysis of azithromycin dihydrate
Azithromycin was analyzed at 215 nm (USP, 2007; IP, 2007) using a UV spectrophotometer. The standard curve for the determination of drug was constructed by dissolving it in phosphate bufer pH = 6.0, in concentration range of 2 to 30 μg/mL. In this concentration range, good linearity was observed (R2 = 0.9998). The graph obeyed the Beer-Lambert’s law in the selected concentration range.
Determination of drug content
Drug content was determined by dissolving accurately weighed quantities of binary systems of drug,
carrier, and adsorbent in pH = 6.0 bufer. The solutions were filtered and diluted appropriately followed by a spectrophotometrical measurement of samples at 215 nm using SHIMADZU-UVmini 1240 Spectrophotometer, Japan (USP, 2007; IP, 2007).
Saturation solubility studies
To evaluate the increase in drug solubility, solid dispersions and the physical mixtures, saturation solubility test was carried out. Excess amounts (approximately 100 mg) of the drug was added to 100 mL of phosphate bufer (pH = 6.0). Samples were stirred at 200 RPM at 25 °C for 24 h, iltered, suitably diluted and analysed by a UV spectrophotometer at 215 nm.
Dissolution studies
In vitro release studies of azithromycin, solid dispersions, and the physical mixtures were carried out in a USP Apparatus 2 (Erweka DT6R, Germany) at 100 rpm in 900 mL of phosphate bufer (pH = 6.0) maintained at 37.0 ± 0.5 °C (USP, 2007). Dissolution studies were carried out using 100 mg of the pure drug and an equivalent amount of individual sample preparations. Aliquots of 5 mL were withdrawn at speciied time intervals of 5, 10, 15, 20, 30, 45 and 60 min and replaced with equal volumes of fresh medium. The resultant samples were filtered through
Whatman ilter paper and analyzed spectrophotometrically
at 215 nm, for the determination of dissolved drug. The dissolution studies were carried out in triplicate (Deepti, Madan, 2007).
Dissolution Efficiency (DE)
Dissolution efficiency (DE) is a parameter for evaluation of in vitro dissolution data. It is the area under the dissolution curve divided by the rectangular area that shows 100% of the solute at a certain time. This parameter is equal to the total area under the curve of the dissolution curve, at time “t” (between two time-points, expressed as a percentage of the curve at maximum dissolution). DE can also be expressed as percentage of the area of the rectangle described by 100% dissolution at the same time. Dissolution eiciency (DE%) was calculated to compare the dissolution data (Anderson et al., 1998). Where:”y” is
the percent drug dissolved at the time “t”.
Infrared (IR) spectroscopy
and the physical mixture were obtained using an IR spectrometer (PerkinElmer 843 System, USA). About 2 to 3 mg of the test sample was mixed with dry KBr and the spectra were obtained over a wavenumber range of 4000 to 200 cm-1. An average of 20 scans was taken.
Differential scanning calorimetry (DSC)
Differential scanning calorimetry thermograms of pure the pure drug, PEG 6000, solid dispersions and all the other preparations were obtained using a SHIMADZU DSC-60instrument (Japan). The calorimeter was calibrated using Indium as standard at 156.6±1 °C.
Accurately weighed samples (6.00 mg) were crimped in aluminum pans and heated from 20.0 to 200.0°C at a heating rate of 10°C/min in nitrogen atmosphere. An empty sealed aluminum pan was used as the reference.
Powder X-Ray Diffraction (PXRD)
Powder X-ray diffraction patterns of plain azithromycin, pure PEG 6000, solid dispersions of Azithromycin and the physical mixtures were recorded using a powder X-ray difract meter (PHILIPS PW 1800 X-Ray Diffraction Machine, The Netherlands) with a copper tube anode over the interval 5-90° 2θ-1. The
TABLE I - Drug content and saturation solubility studies of pure Azithromycin, solid dispersions and physical mixtures (n = 3,
mean ± SD)
Carrier Formulation
code Preparation
Drug: Carrier (w/w)
Theoretical drug content Assayed drug content Saturation solubility
(μg/mL)
Amount (mg) Expressed (%) Amount (mg) Expressed (%)
- Azithromycin Pure drug 1:0 100 100 99.92 ± 1.27 99.92 85 ± 1.08
PEG 4000
SD1 Solid dispersion 1:1 50 100 49.82 ± 0.33 99.64 185 ± 1.24
SD2 Solid dispersion 1:3 25 100 24.77 ± 0.22 99.08 227 ± 2.04
SD3 Solid dispersion 1:5 16.67 100 16.44 ± 0.13 98.62 235 ± 1.91 SD4 Solid dispersion 1:7 12.5 100 12.26 ± 0.07 98.08 241 ± 1.45
SD5 Solid dispersion 1:9 10 100 9.76 ± 0.07 97.57 243 ± 1.88
PM4 Physical
mixture 1:7 12.5 100 12.12 ± 0.16 96.96 126 ± 1.62
PEG 6000
SD6 Solid dispersion 1:1 50 100 49.81 ± 0.38 99.62 188 ± 1.43
SD7 Solid dispersion 1:3 25 100 24.77 ± 0.10 99.08 229 ± 1.22
SD8 Solid dispersion 1:5 16.67 100 16.43 ± 0.11 98.56 237 ± 1.60 SD9 Solid dispersion 1:7 12.5 100 12.25 ± 0.04 98.00 253 ± 0.95
SD10 Solid dispersion 1:9 10 100 9.75 ± 0.04 97.50 249 ± 1.14
PM9 Physical
mixture 1:7 12.5 100 12.37 ± 0.20 98.96 127 ± 2.06
PEG 8000
SD11 Solid dispersion 1:1 50 100 49.83 ± 0.37 99.66 170 ± 1.25 SD12 Solid dispersion 1:3 25 100 24.81 ± 0.19 99.24 195 ± 1.50 SD13 Solid dispersion 1:5 16.67 100 16.46 ± 0.09 98.74 209 ± 1.18 SD14 Solid dispersion 1:7 12.5 100 12.27 ± 0.06 98.16 235 ± 1.56
SD15 Solid dispersion 1:9 10 100 9.77 ± 0.06 97.70 228 ± 1.05
PM14 Physical
Mixture 1:7 12.5 100 12.37 ± 0.20 98.96 131 ± 2.08
PEG 12000
SD16 Solid dispersion 1:1 50 100 49.82 ± 0.52 99.64 181 ± 1.88 SD17 Solid dispersion 1:3 25 100 24.80 ± 0.20 99.20 202 ± 1.63 SD18 Solid dispersion 1:5 16.67 100 16.45 ± 0.09 98.68 217 ± 1.21 SD19 Solid dispersion 1:7 12.5 100 12.27 ± 0.11 98.16 233 ± 1.70
SD20 Solid dispersion 1:9 10 100 9.77 ± 0.07 97.70 230 ± 1.97
PM19 Physical
mixture 1:7 12.5 100 12.36 ± 0.17 98.88 141 ± 1.99
PEG 20000
SD21 Solid dispersion 1:1 50 100 49.85 ± 0.51 99.70 152 ± 1.55 SD22 Solid dispersion 1:3 25 100 24.83 ± 0.30 99.33 167 ± 2.01 SD23 Solid dispersion 1:5 16.67 100 16.48 ± 0.14 98.86 186 ± 1.60 SD24 Solid dispersion 1:7 12.5 100 12.29 ± 0.07 98.32 207 ± 1.11
SD25 Solid dispersion 1:9 10 100 9.77 ± 0.06 97.70 228 ± 1.49
PM25 Physical
operational parameters were as follows: generational tension (voltage) of 45 kV; generator current of 40 mA; scans step time of 9 sec-1 and scan step size of 0.008° (2θ).
Scanning Electron Microscopy (SEM)
The surface morphology of samples was determined using an analytical scanning electron microscope (VEGA\\TESCAN-LMU, Czech Republic, equipped with thermo-emission cathode [Balzers Union Ltd, Balzers, Lichtenstein]). The samples were placed on a sample disc carrier carbon stub (10 mm diameter, 3 mm height) and coated with gold under vacuum (0.25 Torr). The images were generated using a 30 kV electron beam.
Statistical analysis
The data obtained from dissolution and solubility studies were statistically compared using the analysis of variance [ANOVA] (Hinkelmann, Kempthorne, 2008).
RESULTS AND DISCUSSION
Drug content and saturation solubility studies
Table I presents the results of drug content and saturation solubility test of samples. The calculated percentage of drug content for drug-PEG 6000 was between the ranges of 97.50% to 99.62%, also the drug content of the drug-PEG 4000SDs was in the range of 97.57% to 99.64%. All determinations were presented as mean ± SD of three measurements. The maximum solubility of azithromycin in phosphate bufer medium (pH = 6.0) was observed as 253 ± 0.95 μg/mL for the SD9 (azithromycin:PEG 6000; ratio weight of 1:7). Also, saturation solubility of SD4 (drug:PEG 4000) with a weight ratio of 1:7 was about 241 ± 1.45 μg/mL (Table I). Further studies showed that SD9 had the maximum drug solubility. The SD21 (azithromycin:PEG 20000) demonstrated a minimum drug solubility. Consequently, the drug-PEG 6000 or the drug-PEG 4000 solid dispersions, both with the same ratio of 1:7 (w/w) were considered as the best formulations. The probable reason for the saturation solubility improvement in their formulations was the locally imposed solubilizing activity of the carriers used (Bashiri-Shahroodi et al., 2008; Chaud et al., 2010). Reduced drug particle size,
decreased particle aggregation and higher wettability of drug in the presence of hydrophilic carrier could also be considered as the most probable mechanisms for enhanced dissolution rate of azithromycin from solid dispersion systems. The physical mixtures (PMs) were prepared as controls of solid dispersion (SDs) formulations. Based on
the Table I, SD25 (of PEG 20000) with a further saturation solubility compared to other formulations of this group, was selected, thus PM25 was prepared. In addition, prepared physical mixtures of drug-polymer having higher molecular weights, such as PEG 20000 (PM25) due to high hydrophilicity and having further -OH functional group, demonstrated higher saturation solubility (Adeli, 2014, Valizadeh et al., 2004).
In vitro dissolution studies
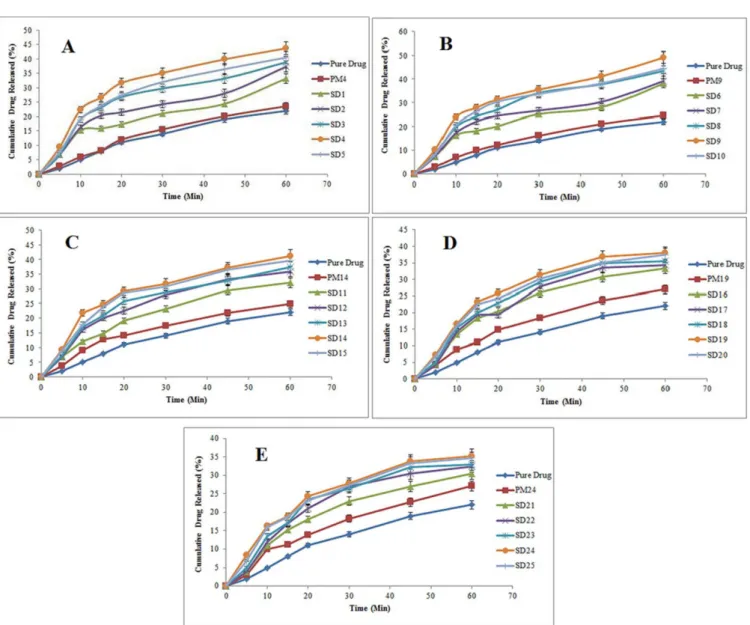
Based on these results, there was significant improvement in the dissolution proile of Azithromycin in all the prepared solid dispersions (p < 0.05). A similar trend was observed with physical mixtures, although in a smaller extent. The probable reason for the improvement in the dissolution rate in the physical mixtures was the local solubilizing efect of PEG 6000 (Patil et al., 2013).
Overall, the solubility studies showed that the solid dispersion method could help to increase the solubility of Azithromycin, particularly when used alongside PEG 6000. Consequently, the dissolution of Azithromycin solid dispersion using PEG 6000 (at a drug:polymer ratio of 1:7) experienced up to a 100% increase, in comparison to the pure drug (2.23 times more). Comparison of the efect of increasing the drug solubility, when using diferent PEGs in this study is as follows:
PEG 6000 > PEG 4000 > PEG 8000 > PEG 12000 > PEG 20000
The dissolution rate of poorly water soluble drugs included within solid dispersions is inluenced by various factors, including the carrier type, viscosity of carriers around drug particles within the dissolution medium and the drug: carrier ratio. The chemical nature of the drug is also important. Therefore, it is not possible to propose a speciic process for prediction of the increase in the dissolution rate of solid dispersion samples. The increase in solubility or dissolution can be explained by three reasons: the high hydrophilicity of the polymer, the chemical properties of drugs and a reduction in the particle size of the drug.
FIGURE 2 - In vitro dissolution release proiles of pure azithromycin, solid dispersions and the physical mixtures containing: (A)
IR studies
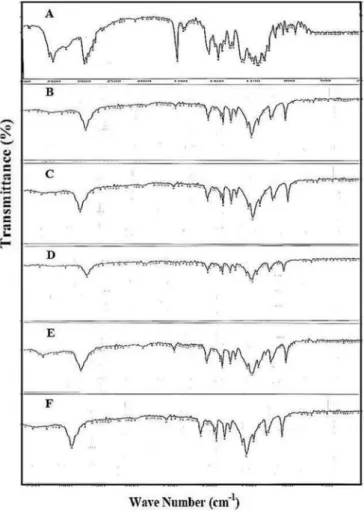
The IR spectra showed that a particular change or interaction does not occur between carriers and the drug. Figure 3 depicts the IR spectra of pure azithromycin, PEG 6000 (as the selected polymer), the physical mixture and solid dispersions. The spectrum of azithromycin (Figure 3A) shows characteristic peaks at 1724 cm-1 (C=O stretch), 1190 cm-1 (C-O-C asymmetrical stretching) and 1049 cm-1 (C-O-C symmetrical stretching). IR spectrum of the PEG 6000 also displayed characteristic peaks at 1108 cm-1
(for C-O-C stretch), 2907 cm-1 (for C-H stretch), and 3244 cm-1 (O-H stretch) (Figure 3B). On the other hand, the peak related to C-O-C stretching bond of the drug in 1049 cm-1 for samples PM9, SD9 and SD4 shifted to higher
wave numbers. This can be due to the formation of Van der Waals forces between azithromycin and carrier. There was no substantial shifting in the position of functional groups (Stuart, 2002). According to the IR spectra of solid dispersions (such as SD9, Figure 3C) and physical mixtures (such as PM9, Figure 3D). Figures 3E and 3F illustrates the IR spectra of SD4 and PM4 (as selected
TABLE II - Dissolution eiciency of pure azithromycin, solid dispersion samples and physical mixtures (n = 3, mean ± SD)
Formulation code Preparation Drug:Polymer (w/w) DE
10 (%) DE30 (%)
Azithromycin Pure Drug 1:0 4.50 ± 1.12 14.32 ± 0.95
SD1 Solid Dispersion 1:1 14.22 ± 0.93 23.07 ± 0.94
SD2 Solid Dispersion 1:3 15.45 ± 0.84 23.89 ± 0.76
SD3 Solid Dispersion 1:5 15.80 ± 0.59 27.43 ± 0.76
SD4 Solid Dispersion 1:7 20.76 ± 0.48 30.91 ± 1.38
SD5 Solid Dispersion 1:9 16.16 ± 0.83 29.22 ± 1.04
PM4 Physical Mixture 1:7 14.73 ± 0.92 14.47 ± 1.52
SD6 Solid Dispersion 1:1 14.28 ± 1.37 23.24 ± 0.93
SD7 Solid Dispersion 1:3 15.59 ± 0.39 25.03 ± 0.87
SD8 Solid Dispersion 1:5 15.65 ± 2.19 28.07 ± 0.46
SD9 Solid Dispersion 1:7 18.90 ± 1.48 31.44 ± 0.49
SD10 Solid Dispersion 1:9 17.72 ± 1.38 29.44 ± 1.04
PM9 Physical Mixture 1:7 5.03 ± 2.10 15.18 ± 1.39
SD11 Solid Dispersion 1:1 9.89 ± 1.10 20.63 ± 1.47
SD12 Solid Dispersion 1:3 13.57 ± 0.49 23.35 ± 0.69
SD13 Solid Dispersion 1:5 14.61 ± 0.38 26.78 ± 037
SD14 Solid Dispersion 1:7 19.26 ± 1.69 27.12 ± 0.36
SD15 Solid Dispersion 1:9 15.85 ± 1.46 26.39 ± 2.51
PM14 Physical Mixture 1:7 7.87 ± 1.11 15.80 ± 1.04
SD16 Solid Dispersion 1:1 11.07 ± 1.17 21.64 ± 1.36
SD17 Solid Dispersion 1:3 13.08 ± 0.84 24.17 ± 1.32
SD18 Solid Dispersion 1:5 14.26 ± 1.05 25.09 ± 2.41
SD19 Solid Dispersion 1:7 14.67 ± 1.73 26.87 ± 1.39
SD20 Solid Dispersion 1:9 14.53 ± 0.47 26.12 ± 0.59
PM19 Physical Mixture 1:7 6.48 ± 2.08 16.65 ± 0.34
SD21 Solid Dispersion 1:1 9.70 ± 1.74 20.46 ± 0.68
SD22 Solid Dispersion 1:3 9.88 ± 1.04 22.42 ± 0.37
SD23 Solid Dispersion 1:5 11.10 ± 0.49 23.08 ± 0.22
SD24 Solid Dispersion 1:7 12.84 ± 1.94 24.37 ± 0.50
SD25 Solid Dispersion 1:9 12.68 ± 1.43 25.15 ± 1.23
samples of PEG 4000), respectively. From the igures, there was no undesirable chemical interaction between the drug and polymer. The main peaks of the drug and polymer were clearly distinguished in solid dispersion samples and physical mixtures.
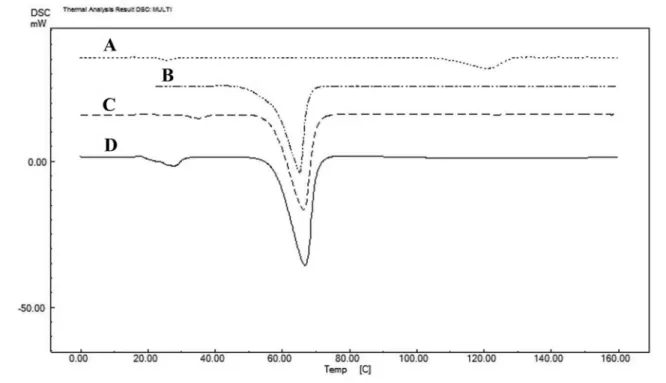
DSC studies
DSC as important thermal analyses techniques were used to determine the thermodynamic characteristics of SD samples. This test was performed for the thermodynamic behavior of anhydrous polymorphs of Azithromycin and carriers in the present study. The DSC thermogram of azithromycin, PEG 6000, SD9 (as the selected solid dispersion system) and PM9 (as the physical mixture) have been presented in Figure 4. The diferential scanning calorimetry shows a sharp endothermic fusion peak between 109.45 °C to 127.77°C, which corresponds to the melting point of azithromycin (Figure 4A and Table III). The sharp endothermic peak of PEG 6000 was exhibited at 62.14°C (Figure 4B). A melting endothermic peak
with decomposition at 144.28 °C can also be depicted. In addition, there was no interaction between the drug and the polymer according to the observed endothermic peaks. The melting peak of pure azithromycin disappeared in solid dispersion and physical mixtures, presumably due to a transformation in drug structure, from a crystalline to an amorphous form (Figure 4).
PXRD studies
Azithromycin crystals display various difraction peaks (Figure 5A) due to their crystalline structure. The PXRD pattern revealed sharp peaks at difraction angles (2θ) of 9.56°, 7.72°, 20.67°, 19.59°, 23.80°, 17.31°, 28.68° and 26.55°. For PEG 6000, the 2θ value was 19.09° (Figure 5B). In the solid dispersion samples studied, there were no azithromycin peaks, and this may be attributed to structural transformation of the drug molecule from the crystalline from into an amorphous form (Figures 5C and 5E). However, some of the smaller peaks of PXRD of the major peaks of pure azithromycin can be detected in SD9, PM9 and other samples at the same 2θ value, but with much lower intensities, which airms that azithromycin crystal do not completely change into the amorphous form in solid dispersion and physical mixtures, and some crystalline structure still remains in these samples during the preparation process (Figures 5C and 5E). Based on these results, the enhancement in azithromycin dissolution in the form of solid dispersions can be partly due to the structural changes, alongside the inluence of the carrier itself as well as a reduction in particle size.
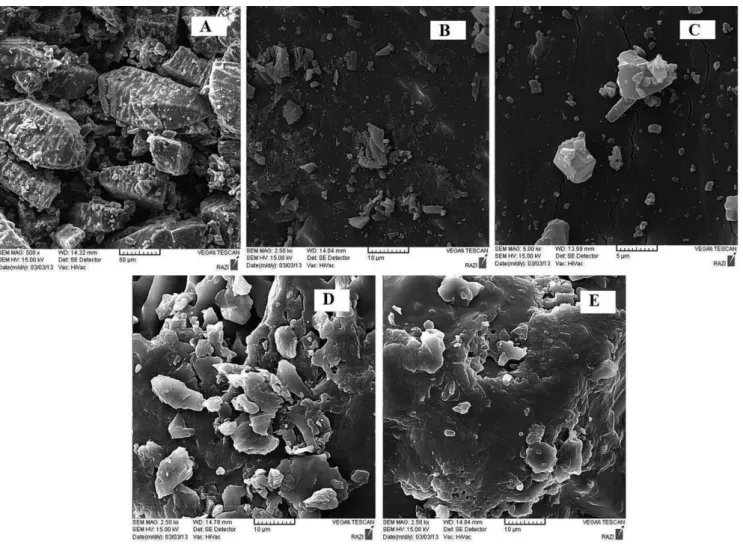
SEM studies
Surface morphological studies of the samples were carried out using SEM and illustrated in Figure 6. Cubic-shaped crystals with sharp edges constitute the morphology of crystalline Azithromycin powder. The morphology of PEG 6000 was needle-shaped. The solid dispersion process resulted in the formation of a signiicantly shorter and amorphous length of the PEG needles compared to the unaltered azithromycin alone (Figure 6). The SEM of solid dispersions reveals the existence of irregular particles with several microscopic cracks and crevices, which provides additional surface for deposition of drug particles. Drug molecules seem to be dispersed within the carrier matrix of the solid dispersions. Furthermore, a particle size reduction in drug molecules is also proposed. These events could help to enhance the release proile and dissolution rate of the drug molecules.
FIGURE 3 - IR Spectra of: (A) azithromycin, (B) PEG 6000, (C)
TABLE III - Data obtained from the DSC thermograms of
azithromycin, PEG 6000 solid dispersion, SD9 and physical mixture PM9 samples
Sample: Azithromycin PEG 6000 SD9 PM9
TOnset (°C): 22.34
109.45 21.4659.38 57.82
-31.17
57.14
FIGURE 4 - DSC thermograms of: (A) azithromycin, (B) SD9, (C) PM9 and (D) PEG 6000.
FIGURE 5 - PXRD Difractograms of: (A) azithromycin, (B)
PEG 6000, (C) SD9, (D) PM9, (E) SD4 and (F) PM4.
Physical stability studies
The selected formulations underwent accelerated stability studies, based on ICH guidelines. Study parameters were: 40 ± 2 °C and 75 ± 5% relative humidity for 120 days (Shel-Lab SMI2 Forced-Air Incubator, USA, Sheldon Manufacturing, Inc.). One hundred milligram samples were individually stored, kept in glass vials sealed with rubber plugs, followed by analysis of the drug content and physical changes of the stored samples at time intervals: 15, 30, 60, 90 and 120 days. During these time periods, the saturation solubility and dissolution rates of Azithromycin were re-examined. No signiicant change in the test samples was observed. Hence, the samples appeared to remain stable over the study period (Table IV).
Statistical analysis studies
r with alpha level of 0.05 for PEG 4000, PEG 6000, PEG
8000, PEG 12000 and PEG 20000 was calculated, the results are as follows: 0.7913, 0.8068, 0.8541, 0.8154 and 0.9309, respectively. In all the groups, solubility of the selected samples as SD4, SD9, SD14, SD19 and SD25 demonstrated signiicant diferences when compared with other samples of the same group (p < 0.05).
CONCLUSIONS
In this investigation, the solvent evaporation approach was used for the preparation of Azithromycin solid dispersions. The solubility and the dissolution rate of the drug were significantly increased in all of the solid dispersion prepared with PEG. The physical
FIGURE 6 - SEM of: (A) azithromycin [magnification: 500×], (B) azithromycin [magnification: 2500×], (C) azithromycin
[magniication: 5000×], (D) SD9 [magniication: 2500×] and (E) SD9 [magniication: 2500×].
TABLE IV - Drug content of selected formulations after undergoing stability studies based on the ICH guidelines for storage
conditions, with was 40 ± 2 °C at 75 ± 5% RH (n = 3, mean ± SD)
Time Pure azithromycin (%) SD4 (%) SD9 (%)
0 days 99.92 ± 1.27 98.08 ± 2.17 98.00 ± 1.57
15 days 99.92 ± 1.02 98.06 ± 1.98 97.95 ± 1.09
30 days 99.91 ± 2.34 97.88 ± 0.95 97.91 ± 1.95
60 days 99.90 ± 0.14 97.75 ± 1.63 97.84 ± 1.03
90 days 99.89 ± 1.22 97.53 ± 2.00 97.44 ± 2.07
mixture samples had lower dissolution rates than the solid dispersion systems. The best result was obtained from solid dispersions containing azithromycin:PEG 6000 in a ratio of 1:7. The amount of azithromycin released from this solid dispersion sample (SD9) was more than 49% in 60 min. Greater wettability of the drug by this hydrophilic carrier, as well as an increase in surface area (Adeli, 2014) seems to be the main reasons for the increase in drug dissolution rate. Hence, the solid dispersion method, using a hydrophilic carrier such as PEG 6000, could be considered as an appropriate technique for dissolution enhancement of azithromycin, which is a poorly-soluble drug.
ACKNOWLEDGMENTS
This study is part of the Pharm.D. Thesis of Ehsan Adeli, conducted in the International Branch of Shahid Beheshti University of Medical Sciences, Tehran, Iran. The author declares that he has no conlicts of interest to disclose.The author declares this article does not contain any studies with human subjects. This research received no speciic grant from any funding agency in the public, commercial, or not-for-proit sectors.
REFERENCES
ADELI, E. A comparative evaluation between utilizing SAS
supercritical fluid technique and solvent evaporation method in preparation of azithromycin solid dispersions for dissolution rate enhancement. J. Supercrit. Fluid., v.87,
p.9-21, 2014.
ADELI, E. Irbesartan-loaded electrospun nanoibers-based PVP K90 for the drug dissolution improvement: fabrication,
in vitro performance assessment and in vivo evaluation. J. Appl. Polym. Sci., v.132, n.27, art.42212, p.1-10, 2015.
ADELI, E.; MORTAZAVI, S.A. Design, formulation and
evaluation of azithromycin binary solid dispersions using
Kolliphor series for the solubility and in vitro dissolution rate enhancement. J. Pharm. Investig., v.44, n.2, p.119-131,
2014.
AL-HAMIDI, H.; EDWARDS, A.A.; MOHAMMAD, M.A.; NOKHODCHI, A. To enhance dissolution rate of poorly
water-soluble drugs: glucosamine hydrochloride as a potential carrier in solid dispersion formulations. Colloids Surf., B, v.76, n.1, p.170-178, 2010.
AMIDON, G.L.; LENNERNAS, H.; SHAH, V.P.; CRISON, J.R. A theoretical basis for a biopharmaceutic drug classiication:
the correlation of in vitro drug product dissolution and in-vivo bioavailability. Pharm. Res., v.12, n.3, p.413-420, 1995.
ANDERSON, N.H.; BAUER, M.; BOUSSAC, N.; KHAN-MALEK, R.; MUNDEN, P.; SARDARO, M. An evaluation of it factors and dissolution eiciency for the comparison of
in vitro dissolution proiles. J. Pharmaceut. Biomed. Anal.,
v.17, n.4/5, p.811-822, 1998.
BABU, G.V.; KUMAR, N.R.; HIMASANKAR, K.; SESHASAYANA, A, MURTHY, K.V. Nimesulide-modiied gum karaya solid mixtures: preparation, characterization
and formulation development. Drug Dev. Ind. Pharm., v.29,
n.8, p.855-864, 2003.
BASHIRI-SHAHROODI, A.; NASSAB, P.R.; SZABÓ-RÉVÉSZ, P.; RAJKÓ, R. Preparation of a solid dispersion
by a dropping method to improve the rate of dissolution of meloxicam. Drug Dev. Ind. Pharm., v.34, n.7, p.781-788,
2008.
BECKERS, C.J.; ROOS, D.S.; DONALD, R.G.; LUFT, B.J.; SCHWAB, J.C.; CAO, Y.; JOINER, K.A. Inhibition of
cytoplasmic and organellar protein synthesis in Toxoplasma gondii: implications for the target of macrolide antibiotics. J. Clin. Invest., v.95, n.1, p.367-376, 1995.
CHAMPNEY, W.S.; BURDINE, R. Azithromycin and clarithromycin inhibition of 50S ribosomal subunit
formation in Staphylococcus aureus cells. Curr. Microbiol.,
v.36, n.2, p.119-123, 1998.
CHAUD, M.V.; TAMASCIA, P.; LIMA, A.C.; PAGANELLI, M.O.; DAFLON GREMIÃO, M.P.; FREITAS, O. Solid
dispersions with hydrogenated castor oil increase solubility, dissolution rate and intestinal absorption of praziquantel. Braz. J. Pharm. Sci., v.46, n.3, p.473-481, 2010.
CHIOU, W.L.; RIEGELMAN, S. Pharmaceutical applications of
solid dispersion systems. J. Pharm. Sci., v.60, n.9,
p.1281-1302, 1971.
CRAIG, D.Q.M. The mechanisms of drug release from solid
dispersions in water-soluble polymers. Int. J. Pharm., v.231,
DAMIAN, F.; BLATON, N.; NAESENS, L.; BALZARINI, J.; KINGET, R.; AUGUSTIJNS, P.; VAN DEN MOOTER, G. Physicochemical characterization of solid dispersions of the antiviral agent UC-781 with polyethylene glycol 6000 and Gelucire 44/14. Eur. J. Pharm. Sci., v.10, n.4,
p.311-322, 2000.
DEEPTI, D.H.; MADAN, A.K. Solid dispersion adsorbents for
enhancement of dissolution rates of drugs. PDA J. Pharm. Sci. Technol., v.61, n.2, p.97-101, 2007.
GIORGETTI, L.; ISSA, M.G.; FERRAZ, H.G. The effect
of dissolution medium, rotation speed and compaction pressure on the intrinsic dissolution rate of amlodipine
besylate, using the rotating disk method. Braz. J. Pharm. Sci., v.50, n.3, p.513-520, 2014.
HAN, H.K.; LEE, B.J.; LEE, H.K. Enhanced dissolution and
bioavailability of biochanin A via the preparation of solid dispersion: in vitro and in vivo evaluation. Int. J. Pharm.,
v.415, n.1/2, p.89-94, 2011.
HINKELMANN, K.; KEMPTHORNE, O. Design and analysis of experiments. 2.ed. Hoboken: Wiley-Intercience, 2008.
v.1-2. (Wiley series in probability and statistics).
INDIAN Pharmacopoeia. Ghaziabad: Indian Pharmacopoeia Comission, 2007. p.140-144. [Azithromycin Monograph].
LEUNER, C.; DRESSMAN, J. Improving drug solubility
for oral delivery using solid dispersions. Eur. J. Pharm. Biopharm., v.50, n.1, p.47-60, 2000.
LI, S.; LIU, Y.; LIU, T.; ZHAO, L.; ZHAO, J.; FENG, N.
Development and in vivo assessment of the bioavailability of oridonin solid dispersions by the gas anti solvent technique. Int. J. Pharm., v.411, n.1/2, p.172-177, 2011.
MOFFAT, A.C.; OSSELTON, M.D.; WIDDOP, B. Clarke’ analysis of drug and poisons: in pharmaceuticals,
body fluids and postmortem material. 4.ed. London: Pharmaceutical Press, 2011. p.1561-1562.
MONTEJO-BERNARDO, J.; GARCÍA-GRANDA, S.; BAYOD-JASANAD, M.;LLORENTE, I.; LLAVONA, L.
An easy and general method for quantifying Azithromycin dihydrate in a matrix of amorphous Azithromycin. Arch. Org. Chem., v.2005, n.9, p.321-331, 2005.
MURA, P.; MOYANO, J.R.; GONZALEZ-RODRIGUEZ, M.L.; RABASCO-ALVAREZ, A.M.; CIRRI, M.; MAESTRELLI, F. Characterization and dissolution properties of ketoprofen
in binary and ternary solid dispersions with polyethylene glycol and surfactants. Drug Dev. Ind. Pharm., v.31, n.4/5,
p.425-434, 2005.
NARASAIAH, L.; JIMIDI, B.; GOLI, V.; KANAKAM, V.B.
Enhancement of dissolution rate of atorvastatin calcium using solid dispersions by dropping method. Int. J. Pharm. Tech. Res., v.3, n.2, p.652-659, 2011.
OKONOGI, S.; YONEMOCHI, E.; OGUCHI, T.; PUTTIPIPATKHACHORN, S.; YAMAMOTO, K.
Enhanced dissolution of ursodeoxycholic acid from the solid dispersion. Drug Dev. Ind. Pharm., v.23, n.11,
p.1115-1121, 1997.
OKONOGI, S.; PUTTIPIPATKHACHORN, S. Dissolution
improvement of high drug loaded solid dispersion. AAPS PharmSciTech., v.7, n.2, p.E148-E153, 2006.
PALANISAMY, M.; KHANAM, J. Solid dispersion of
prednisolone: solid state characterization and improvement
of dissolution proile. Drug Dev. Ind. Pharm., v.37, n.4,
p.373-386, 2011.
PATIL, A.; PAYGHAN, S.; DISOUZA, J. Formulation and
evaluation of enteric coated tablets of Azithromycin dihydrate. Int. J. Chem. Tech. Res., v.3, n.3, p.1479-1484,
2011.
PATIL, M.P.; GAIKWAD, N.J. Characterization of
gliclazide-polyethylene glycol solid dispersion and its effect on dissolution. Braz. J. Pharm. Sci., v.47, n.1, p.161-166, 2011.
PATIL, P.H.; BELGAMWAR, V.S.; PATIL, P.R.; SURANA, S.J.
Enhancement of solubility and dissolution rate of poorly water soluble raloxifene using microwave induced fusion method. Braz. J. Pharm. Sci., v.49, n.3, p.571-578, 2013.
PUDIPEDDI, M.; SERAJUDDIN, A.T.M.; MUFSO, D.
Integrated drug product development- from lead candidate
SEKIGUCHI, K.; OBI, N. Studies on absorption of eutectic
mixture I.A comparison of the behavior of eutectic mixture of sulfathiazole and that of ordinary sulfathiazole in man. Chem. Pharm. Bull., v.9, n.11, p.866-872, 1961.
STUART, B.-H. Polymer analysis. Chichester: John Wiley,
2002. p.37. (Analytical techniques in the science).
SWEETMAN, S.C., (Ed.). Martindale: the complete drug
reference. 36.ed. London: Pharmaceutical Press, 2009. p.207.
UNITED States Pharmacopeia. USP 30. National Formulary: NF 25. Rockville: United States Pharmacopeial Convention, 2007. p.3179-3180.
VALIZADEH, H.; NOKHODCHI, A.; QARAKHANI, N.; ZAKERI-MILANI, P.; AZARMI, S.; HASSANZADEH, D.; LÖBENBERG, R. Physicochemical characterization of solid dispersions of indomethacin with PEG 6000, Myrj 52, lactose, sorbitol, dextrin, and Eudragit E100. Drug Dev. Ind. Pharm. v.30, n.3, p.303-317, 2004.
VASANTHAVADA, M.; TONG, W.Q.; SERAJUDDIN, A.T.M.
Development of solid dispersions for poorly water-soluble
drug. In: LIU, R., (Ed.). Water-insoluble drug formulations.
2.ed. Boca Raton: CRC Press, 2008. p.149-184.
WIPO. The World Intellectual Property Organization.
Azithromycin: a world best-selling antibiotic. Available at:
<http://www.wipo.int/ipadvantage/en/details.jsp?id=906>. Access: Febr. 2015.
Received for publication on 18th February 2015