www.atmos-chem-phys.net/12/5841/2012/ doi:10.5194/acp-12-5841-2012
© Author(s) 2012. CC Attribution 3.0 License.
Chemistry
and Physics
In situ measurements of aerosol optical properties and number size
distributions in a coastal region of Norway during the summer of
2008
S. Mogo1,2,3, V. E. Cachorro1, J. F. Lopez1, E. Montilla1,*, B. Torres1, E. Rodr´ıguez4, Y. Bennouna1, and
A. M. de Frutos1
1Universidad de Valladolid, Grupo de ´Optica Atmosf´erica, Spain
2Universidade da Beira Interior, Faculdade de Ciˆencias, Covilh˜a, Portugal 3Instituto Dom Luis, Portugal
4Finnish Meteorological Institute, Climate Change Unit, Helsinki, Finland *now at: Universidad de Concepci´on, Center for Optics and Photonics, Chile
Correspondence to: S. Mogo (sipmogo@gmail.com)
Received: 30 September 2011 – Published in Atmos. Chem. Phys. Discuss.: 13 December 2011 Revised: 4 June 2012 – Accepted: 11 June 2012 – Published: 6 July 2012
Abstract. In situ measurements of aerosol optical properties
and particle size distributions were made in the summer of 2008 at the ALOMAR station facility (69◦160N, 16◦000E), located in a rural site in the north of the island of Andøya (Vester˚alen archipelago), approximately 300 km north of the Arctic Circle. The extended three-month campaign was part of the POLARCAT Project (Polar Study using Aircraft, Re-mote Sensing, Surface Measurements and Models, of Cli-mate, Chemistry, Aerosols, and Transport) of the Interna-tional Polar Year (IPY-2007-2008). Our goal was to char-acterize the aerosols of this sub-Arctic area, which are fre-quently transported to the Arctic region.
Data from 13 June to 26 August 2008 were available and the statistical data for all instruments were calculated based on the hourly averages. The overall data coverage was approximately 72 %. The hourly mean values of the light-scattering coefficient, σs, and the light-absorption
co-efficient, σa, at 550 nm were 5.41 Mm−1(StD = 3.55 Mm−1)
and 0.40 Mm−1(StD = 0.27 Mm−1), respectively. The scat-tering/absorption ˚Angstr¨om exponents, αs,a, were used in
a detailed analysis of the variations of the spectral shape of
σs,a. While αs indicates the presence of two particle sizes
corresponding to two types of aerosols, αa indicates only
one type of absorbing aerosol particle. αa values greater
than 1 were not observed. The single-scattering albedo,
ω0, ranged from 0.62 to 0.99 (mean = 0.91, StD = 0.05),
and the relationships between this parameter and the ab-sorption/scattering coefficients and the ˚Angstr¨om exponents are presented. Any absorption value may lead to the low-est values of ω0, whereas only the lowest scattering
val-ues were observed in the lowest range of ω0. For a given
absorption value, lower ω0 were observed for smaller αs.
The submicrometer, micrometer and total concentrations of the particles presented hourly mean values of 1277 cm−3
(StD = 1563 cm−3), 1 cm−3(StD = 1 cm−3) and 2463 cm−3
(StD = 4251 cm−3), respectively, and the modal correlations
were also investigated. The optical and microphysical param-eters, as well as their relationship with each other, are re-ported. σscorrelated strongly with the number concentration
of accumulation mode particles and more strongly with the micrometer fraction of particles, but weak correlations were observed for the Aitken and nucleation modes. The origins and pathways of the air masses were examined, and based on sector classification, a relationship between the air mass origin, the optical parameters and the size distributions was established.
The low values of the optical and microphysical parame-ters indicate that the predominant regional aerosol is mostly clean and the shape of the size distribution is characterized by bimodal median size distributions. However, the relation-ships between the air mass origins and the parameters stud-ied allow us to describe two characteristic situations: the one
of the northern and western air masses, which were predomi-nantly composed of marine aerosols and presented the lowest optical and microphysical values observed, indicating pre-dominantly non-absorbent and coarser particles; and the one of the eastern and southern air masses, in which continental aerosols were predominant and exhibited higher values for all parameters, indicating the presence of smaller absorbent particles. The north-northeastern air masses presented the strongest Aitken mode, indicating more recently formed par-ticles, and the southeastern air masses presented the strongest accumulation mode (however, the southeastern air masses were the least common, accounting for only 3 % of occur-rences).
1 Introduction
The net effect of aerosols on global climate change is uncer-tain, since the particles involved can cause cooling or warm-ing, depending on their optical properties. The reduction in the intensity of a direct solar beam during its propagation through the atmosphere is determined by both absorption and scattering processes. The aerosol single-scattering albedo,
ω0, is defined as the ratio between the aerosol light scattering
and the extinction, ω0=σs/(σs+σa), where σsand σaare the
aerosol scattering and absorption coefficients, respectively.
ω0is one of the most relevant optical properties of aerosols,
because the direct radiative effect of aerosols is very sensi-tive to this parameter. The optical properties of aerosol par-ticles suspended in the atmosphere are determined by their chemical composition, size, shape, concentration and state of mixing and generally exhibit large spatial and temporal variability (Kokhanovsky, 2008).
Sulfate and nitrate aerosols from anthropogenic sources are thought to be the primary particles responsible for net cooling. These particles scatter solar radiation and are effec-tive as cloud condensation nuclei that affect cloud longevity and the hydrological cycle and result in a negative radiative forcing that leads to a cooling of the Earth’s surface. To some extent, sulfate and nitrate aerosols are thought to counteract global warming caused by greenhouse gases such as carbon dioxide (Boucher and Haywood, 2001). Sea-salt and non-sea-salt sulfate have been reported as dominating the light scattering effect in the Arctic (Quinn et al., 2002). Previous studies have also reported on the occurrence of large con-centrations of biogenic scattering aerosols in the Arctic re-gion, derived from the oxidation of atmospheric dimethyl-sulfide, which results from oceanic phytoplankton processes (Quinn et al., 2002). It has also been suggested that the or-ganic species play important roles in aerosol light scatter-ing (Quinn et al., 2002) and are an important component of Arctic aerosols in general (Quinn et al., 2002; Ricard et al., 2002a,b; Leck and Bigg, 2005).
On the other hand, light-absorbing particles, mainly formed by black carbon produced by the incomplete com-bustion of carbonaceous fuels, are effective absorbers of so-lar radiation and therefore contribute to warming the atmo-sphere. Absorption of solar radiation by aerosols causes heat-ing of the lower troposphere, which may lead to altered ver-tical stability and has implications for the hydrological cy-cle (Ramanathan et al., 2001). In addition, the deposition of light-absorbing particles onto snow and ice reduces the sur-face albedo, which, in turn, affects the snow pack and the Earth’s total albedo (Law and Stohl, 2007; IPCC, 2007). A recent study (Hadley and Kirchstetter, 2012) generated and characterized pure and black carbon-laden snow in the labo-ratory and verified that black carbon contamination apprecia-bly reduces the snow albedo, at levels that have been found in natural settings (Forsstr¨om et al., 2009; Aamaas et al., 2011). Clarke and Noone (1985) found that for a mass fraction of 10–40 ng g−1soot, the snow albedo is reduced by 1–3 % in
fresh snow and by a factor of 3 as the snow ages and the light-absorbing particles become more concentrated. Doherty et al. (2010) estimated the black carbon concentrations in snow for regions near the Arctic at 4–20 ng g−1, with an expected albedo reduction of 1–2 %.
The determination of optical parameters as a function of wavelength has been recently recognized as an efficient way to distinguish between various aerosol types. For ex-ample, Rosen et al. (1979) measured αa=1.0 for urban
aerosol, Bond (2001) studied the spectral dependence of vis-ible light absorption by carbonaceous particles emitted from coal combustion and found a strong spectral dependency, 1.0 < αa<2.9, and Mogo et al. (2005) made similar
mea-surements in a coastal site in Southern Spain and found that 0.2 < αa<2.0 for the visible range of the spectrum and that
0.2 < αa<2.5 for the UV range. High spectral resolution
data are also presented for this campaign in ALOMAR by Montilla et al. (2011). αs can be used to infer information
regarding the size of the particles as it relates inversely to particle size (Russell et al., 2010). Pereira et al. (2011) ob-served αs=1.4 for aerosols dominated by sub-micrometer
particles, and Collaud Coen et al. (2004) observed αs to
be lower than 0.5 during Saharan dust events measured at Jungfraujoch. The wavelength dependence of ω0is also
in-fluenced by various aerosol species. Dubovik et al. (2002) found that for urban-industrial aerosols and biomass burning,
ω0decreases with increasing wavelength, whereas for desert
dust, ω0increases with increasing wavelength (Collaud Coen
et al., 2004). This wavelength dependence inversion can be explained by the greater size of the particles of desert dust, causing the scattering process to be dominated by geomet-ric processes that are wavelength independent. Furthermore, some dust particles (such as hematite) are strong absorbers, and the increase of absorption together with the decrease of scattering can also contribute to the change of the slope of ω0
In addition, measurement of the number size distribution can be used to infer the aerosol sources. For example, the presence of coarse modes can be due to mechanical gener-ation processes, and the presence of ultrafine modes can be due to the formation of new particles. For a given location, this information is useful for understanding the local aerosol and its relation to the sampled air mass. Previous works (Bir-mili et al., 2001; Tunved et al., 2005) have observed that dif-ferent size distribution properties can be related to the ori-gin of the air masses, with similar distributions often arriving from the same origin.
The present work was conducted within the framework of a larger intensive aerosol characterization campaign con-ducted at Andenes, a remote site located in northern Nor-way, during the summer of 2008. During the summer, the re-gion provides an excellent environment for studying remote background aerosols (those containing natural compounds, such as sea salt and sulfuric acid, and anthropogenic pollu-tants, such as soot, resulting from transport to the region), as there are few local sources of anthropogenic particles. The campaign was conducted by the Atmospheric Optics Group of Valladolid University as part of the International Polar Year through the POLARCAT project, and the main goal of the campaign was to comprehensively characterize the lo-cal aerosols. Several instruments for aerosol characterization were employed simultaneously, and the results from aerosol absorption and scattering measurements, as well as the num-ber size distributions, are presented. We analyzed also the absorption/scattering coefficients, σa,s, and their ˚Angstr¨om
exponents, αa,s, together with the single-scattering albedo.
The main purpose of this paper is to present an analysis of the collected optical and microphysical data. The parti-cle number size distributions were used to study some basic relationships with the optical properties. Source areas were assessed by identifying the origins of air masses that relate to different levels of scattering, absorption and number size distributions in Andenes.
Whereas columnar aerosol properties are presented in Toledano et al. (2006), Rodr´ıguez et al. (2011) and Rodr´ıguez et al. (2012), no surface measurements appear to have been reported for the in situ properties of aerosols in our study area. The site belongs to the AERONET network, and there-fore, the columnar aerosol data are also readily available (Rodr´ıguez et al., 2011) and were used as complementary information.
2 Methods
2.1 Site description
The ALOMAR (Arctic Lidar Observatory for Middle Atmo-sphere Research) station is located in Andøya island close to the town of Andenes (69◦160N, 16◦000E, 380 m a.s.l.) on the Atlantic coast of Norway, approximately 300 km north
of the Arctic Circle, Fig. 1. The facility is managed by the Andøya Rocket Range, and the site is well-suited for mea-surements of remote background aerosols due to the absence of large regional pollution sources. From the end of May to the end of July, the sun is above the horizon for 24 h each day, with a maximum elevation during the solstice of 42◦at noon and 2◦at midnight. Despite being located north of the Arctic Circle, the station is considered sub-arctic due to the climate of the region. The climate is strongly influenced by the Gulf Stream, which provides mild temperatures during the entire year; average temperatures are −2◦C in January and 11◦C in July. Rapid variations in temperature can occur in the summer months, from 4◦to 30◦C. During our mea-surement period, the daily average temperature was 7.1◦C, with a minimum of 2.5◦C (15 June), a maximum of 15.4◦C (20 July) and a standard deviation of 2.9◦C. The relative
hu-midity level was high across the study period, with an aver-age of 92.8 %. The minimum humidity level was 62 %, the maximum humidity level was 100 % and the standard de-viation was 9.0 %. The surface wind pattern was oriented mainly south-southwest (27 % of occurrences), but an east-northeast component was also frequently registered (22 %). Other frequent wind directions were south-southeast (16 %), west-southwest (15 %) and east-southeast (13 %). The aver-age wind speed was 5.6 km h−1(with a minimum, maximum and standard deviation of 2.1, 13.1 and 2.4 km h−1, respec-tively). Further details regarding the measurement station can be found in Skatteboe (1996) and Toledano et al. (2006).
2.2 Instrumentation
Aerosol samples were obtained from a stainless steel inlet protected with a rain cap and a metal screen designed to ex-clude insects. The inlet of the sampling line was approxi-mately 2 m above the roof of the measurement station build-ing, which was approximately 7 m above the ground. The cut-off diameter of the inlet nozzle and sample transport line was approximately 10 µm. The sampled air was heated when necessary to achieve a low relative humidity of 40 % prior to entering the instruments. Airflow through the sampling line was divided into several separate flows and directed toward individual instruments. The flow into each instrument was measured once a day using an electronic bubble flowmeter (Gilibrator system, Gilian).
The light absorption coefficients were measured at three wavelengths (470, 522 and 660 nm) using a particle soot ab-sorption photometer (PSAP, Radiance Research) at a flow set to 1.5 l min−1. The instrument uses a filter-based technique in
which aerosols are continuously deposited onto a glass fiber filter at a known flow rate. The change in the transmitted light is related to the optical absorption coefficient using Beer’s law. The instrument is an improved version of the integrat-ing plate method (Lin et al., 1973) and is described in detail by Bond et al. (1999) and Virkkula et al. (2005). The detec-tion limit of the instrument was investigated by Springston
Pallas Birkenes Zeppelin Hyytiälä ALOMAR 1 2 3 4 5 6
Fig. 1. Location of the ALOMAR station in Northern Norway. The
classification sectors of back trajectory air masses are displayed and also the typical trajectories for each air mass origin classification (colored lines).
and Sedlacek III (2007) and M¨uller et al. (2011) and for an averaging time of 60 s, the expected value approaches 0.05 Mm−1.
The scattering and backscattering coefficients were mea-sured at three wavelengths (450, 550 and 700 nm) using an integrating nephelometer (model 3563, TSI) at a flow rate of 46 l min−1. The instrument is described in detail by Ander-son et al. (1996) and AnderAnder-son and Ogren (1998). Calibra-tion was conducted twice per month using CO2as the
high-span gas and filtered air as the low-high-span gas. The averaging time was set to 1 min. The zero signal was measured once per hour. The data was corrected for truncation errors according to Anderson and Ogren (1998). For the 1-min averages, the detection limits for the scattering coefficients were 0.65, 0.25 and 0.38 Mm−1for 450, 550 and 700 nm, respectively (An-derson et al., 1996).
The number size distributions of dry particles were mea-sured separately for the fine and coarse fractions using a scanning mobility particle sizer (SMPS) and an aerody-namic particle sizer (APS, model 3321, TSI), respectively. The SMPS consists of a differential mobility analyzer (model 3080, TSI) and a condensation particle counter (CPC model 3022A, TSI) and was operated at a flow rate of 1.5 l min−1. The size range for particle number detection was set to ∼ 10– 390 nm (mobility diameter). The quality of the SMPS mea-surements depends essentially on the stability of the air flow rates and the performance of the CPC (Wiedensohler et al., 2012). According to the manufacturer, the latter has a count-ing efficiency of 100 % for particles above 50 nm and above 80 % for particles above 10 nm. An intercomparison of our instrumental system was carried out before the campaign and the SMPS distributions obtained remained within the manufacturer uncertainties (±10 %). The APS was operated at a flow rate of 5 l min−1, and it was set up to detect the number concentration of particles in the size range from
0.5 up to 20 µm (aerodynamic diameter). However, our in-let system had a cut-off diameter of 10 µm. The APS low-est detectable concentration is 0.001 cm−3and for solid
par-ticles, counting efficiencies range from 85 % to 99 % (Vol-ckens and Peters, 2005). The total particle concentration in the range 3–10 000 nm was monitored using an ultrafine con-densation particle counter (model 3776, TSI). According to the manufacturer, this instrument detects particles as small as 2.5 nm with counting efficiency of 100 % for particles above 3 nm (accuracy ±10 %). It was operated in high-flow mode (1.5 l min−1) to minimize diffusion losses.
The upper boundary of the size range for the SMPS data was selected to be 390 nm to achieve a better resolution for the lower particle size channels, allowing us to study possible new particle formation events. This decision, together with the low concentration of particles registered by the APS, pre-vented us from merging the SMPS and APS data because the gap between the upper channel of the SMPS, 390 nm, and the lower channel of the APS, 500 nm, would require inter-polation between these sizes and a conversion of the aerody-namic diameters provided by the APS to the mobility diam-eters provided by the SMPS, with associated errors resulting from both procedures.
2.3 Data processing
The averaging time used for the PSAP was 60 s, and the fil-ter was replaced whenever the amount of transmitted light reached 70 % of the initial intensity. The response of the in-strument depends on the loading of particles on the filter, the amount of light scattered by the particles, the flow rate and the spot size (Bond et al., 1999; Virkkula et al., 2005). The data were corrected for these dependencies using the proce-dure described by Bond et al. (1999) since the algorithms presented by Bond et al. (1999) and Virkkula et al. (2005) agreed with the high ω0and small σavalues and as no other
values of σa>6 Mm−1were observed at the ALOMAR
sta-tion during the measurement period. The corrected aerosol absorption coefficients at 470, 522 and 660 nm were extrap-olated to the working wavelengths of the nephelometer, i.e., 450, 550 and 700 nm, using the ˚Angstr¨om exponent.
The values obtained for backscattering turned out to be below the error threshold and are not presented.
To investigate the wavelength dependence of σa,s, we
cal-culated the absorption/scattering ˚Angstr¨om exponent. This parameter is commonly used when conducting a more de-tailed analysis of the variations of the spectral shape of σa,s
and is defined as the negative slope of the logarithm of the absorption coefficient as a function of wavelength. It is given by:
σa,s=Kλ−αa,s. (1)
In practice, we calculated αa,s(λ1,λ2,...,λn) for more than two
wavelengths through the logarithmic fit of Eq. (1), and we calculated αa,s(λ1,λ2) for a pair of wavelengths, λ1, λ2,
according to the following simplified formula:
αa,s= −
log(σa,s(λ2)/σa,s(λ1))
log(λ2/λ1)
. (2)
The aerosol size distribution observations were made on the timescale of minutes, and twelve measurements were conducted per hour. For the SMPS, we describe the to-tal concentration and the concentrations N30−50=P5030ni, N50=P39050 ni and N100=P390100ni, where ni is the
mea-sured aerosol number concentration in the size interval con-sidered. The cut-off diameters of 30, 50 and 100 nm were selected according to the criteria presented by Asmi et al. (2011). The nucleation, Aitken and accumulation modes are also fully described. For the APS, we describe the shape of the distribution and the total concentration. For the UCPC instrument, the total concentration is presented.
Data from 13 June to 26 August 2008 were available. The statistical data for all instruments were calculated based on the hourly averages, which appeared reasonable given the low values observed. The hourly averages were preferred over the daily averages because they were more sensitive to local effects, whereas the daily averages were more useful in identifying external long-range effects. The hourly value was accepted when six or more 5-min values were available. The overall data coverage was approximately 72 % due to the weather conditions (measurements taken during rainfall were typically below the detection limit of the instruments and were thus eliminated), and this value is considered ade-quate for determining the main features of optical properties and concentrations of the aerosols.
For the derived optical quantities, a quadrature sum of errors yielded relative uncertainties at the 95 % confidence level of ±15 %, ±45 %, ±10 %, and ±34 %, respectively for
ω0, αa, αsand αω0.
2.4 Determination of air mass origins by back
trajectory analysis
To analyze the source and transport pathways of the air masses arriving at ALOMAR, a back trajectories analysis was conducted covering the period of measurement using NOAA’s HYSPLIT model (Draxler and Rolph, 2003; Rolph, 2003). The back trajectories were calculated typically 120 h backwards in time at an arrival height of 500 m above ground level at 12:00 UTC. The model runs were constructed using the GDAS (Global Data Assimilation System) meteorologi-cal archive, and the vertimeteorologi-cal velocity of the model as verti-cal motion (3-dimensional) was selected. The altitude level of 500 m was used for the classification because it is within the boundary layer, where most of the particles are confined. However, higher altitude trajectories were also used in the investigation of the long-range transport episodes. To relate the air masses to the source of the newly formed particles, the mixed layer depth was also obtained from the HYSPLIT model, and the air mass for new particle formation event days
was considered as a source of the aerosol particles that ar-rived and formed close to the measurement point if the 500 m air mass was inside the boundary layer for the majority of the time.
Figure 1 shows the demarcation of six geographical sec-tors of different air mass types influencing the measurement site: 1(S), 2(SE), 3(E), 4(NNE), 5(NW) and 6(W). The air mass sector classification is based on the longest residence time of the trajectories in each geographical sector. This methodology has been described in detail in previous stud-ies (Rodr´ıguez et al., 2011; Toledano et al., 2009), and a full study on back trajectories in Andenes was conducted by Rodr´ıguez et al. (2011) and Rodr´ıguez et al. (2012). In Fig. 1, we also present typical trajectories for each air mass origin classification. The purpose is to provide visualization of the source region and to display the distance that the air mass traveled during the 120 h prior to the measurement.
To study the influence of the transport pathways of the air masses on the aerosol properties observed at the ALO-MAR station, the data were divided in six separate groups according to the origin sector of the air mass, and the aerosol data were then correlated with each sector membership. The most common air masses were those from the north, sectors 4 (31 %) and 5 (27 %), and from the west, sector 6 (22 %), ar-riving from the ocean. The other air masses originated in the south, sectors 1 (5 %) and 2 (3 %), and in the east, sector 3 (12 %), which arrived from Great Britain, Scandinavia, east-ern Europe and Russia in most cases. Rodr´ıguez et al. (2011) found that sectors 1, 2 and 3 were related to high-pressure systems that had been located over the Scandinavian Penin-sula and Siberia, resulting in sunny and dry weather over the region. Sector 4 was characterized by cold and dry air masses from the Arctic sea. Sectors 5 and 6 were associated with low-pressure systems, and precipitation was frequent when air masses arrived from these sectors. Rodr´ıguez et al. (2011) and Rodr´ıguez et al. (2012) also concluded that the most fre-quent air mass origin was the northwest and west (North At-lantic Ocean). These works suggested that the site location and the local aerosols largely determined the aerosol type, with low aerosol concentration dominated by fine particles. They observed that the low aerosol background is episodi-cally altered by turbid air masses, which mainly originate in central and eastern Europe, with transport of anthropogenic pollution, smoke from biomass burning and in some cases Saharan dust.
Based on the sector classification of each identified trans-port pathway, we established a relationship between the air mass origin and the parameters we measured. The mean fre-quency of occurrence of the transport sectors and its relation-ship with the aerosol parameters are summarized in Fig. 8.
Table 1. Evaluation of the overall ranges and arithmetic mean values of the absorption/scattering coefficients, the ˚Angstr¨om exponents, the
single scattering albedo and the concentrations in each size section obtained from the data set measured at ALOMAR. Pxvalues are the x-th
percentage of the considered parameter. The median value (P50) is listed in bold.
Mean StD Range P16 P25 P50 P75 P84 450 nm 7.31 4.79 0.29–31.24 3.08 3.63 6.58 9.55 11.68 σs(Mm−1) 550 nm 5.41 3.55 0.25–23.21 2.23 2.76 4.75 7.12 8.54 700 nm 4.08 2.84 0.19–18.95 1.54 2.09 3.39 5.32 6.49 αs(450–750) 1.37 0.61 0.20–3.07 0.68 0.82 1.36 1.90 2.06 450 nm 0.45 0.33 0.14–2.72 0.22 0.24 0.35 0.53 0.64 σa(Mm−1) 550 nm 0.40 0.27 0.13–2.28 0.20 0.23 0.32 0.48 0.57 700 nm 0.36 0.23 0.12–1.92 0.19 0.21 0.30 0.43 0.51 αa(450–750) 0.40 0.21 0.01–0.97 0.19 0.25 0.39 0.55 0.61 450 nm 0.93 0.04 0.60–0.99 0.89 0.91 0.94 0.96 0.96 ω0 550 nm 0.91 0.05 0.62–0.99 0.87 0.89 0.92 0.95 0.96 700 nm 0.89 0.06 0.50–0.99 0.83 0.86 0.90 0.94 0.96 αω0 (450–750) 0.09 0.09 −0.11–0.95 0.01 0.02 0.07 0.14 0.17 N30−50 258 355 3–2970 27 45 127 315 449 N50 469 516 2–4001 81 126 266 615 892 N100(accumulation) (#/cm3) 183 209 0–2226 34 61 114 224 317 NAitken(30–100 nm) 545 647 5–4460 68 111 308 711 1023 Nnucleation(10–30 nm) 549 1070 1–10 131 29 53 185 488 881 Nsubmicrometer(10–390 nm) 1277 1563 15–14 111 190 291 710 1635 2376 Nmicrometer(> 500 nm) (#/cm3) 1 1 0–12 0 1 1 2 3 Ntotal(> 3 nm) (#/cm3) 2463 4251 5–66 772 293 500 1175 2895 4113
3 Results and discussion
3.1 Temporal variations in aerosol optical properties
During our observations, the hourly mean σs at 450, 550
and 700 nm ranged from 0.29 to 31.24 Mm−1, 0.25 to 23.21 Mm−1 and 0.19 to 18.95 Mm−1 (average 7.31, 5.41 and 4.08 Mm−1 with standard deviations of 4.79, 3.55 and 2.84 Mm−1), respectively. The hourly mean values of σaat
450 nm, 550 nm and 700 nm ranged from 0.14 to 2.72 Mm−1, 0.13 to 2.28 Mm−1 and 0.12 to 1.92 Mm−1 (average 0.45, 0.40 and 0.36 with standard deviations of 0.33, 0.27 and 0.23 Mm−1), respectively. For both parameters, the median value was lower than the mean. The range of the values of
σs was ten times larger than the range of the values of σa.
Statistical data regarding the σsand σavalues are presented
in Table 1, and a time series representing over 70 days of measurement is shown in Fig. 2.
1166 hourly means were available for σs, and 1046 were
available for σa, which allowed for the calculation of 883
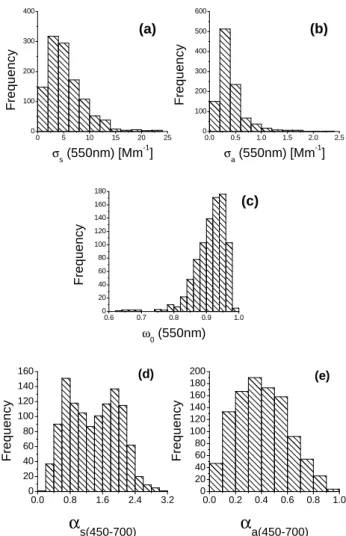
hourly values of ω0. The frequency histogram of σs, σa and
ω0at 550 nm, shown in Fig. 3, presents only one frequency
mode, centered at 3 Mm−1, 0.3 Mm−1and 0.95, respectively, for each parameter. Although the magnitude of σsand σa
de-pend on many factors, our results, when compared with the
literature values for other areas and Table 1, suggest that the magnitude of the aerosol scattering/absorption coefficients at ALOMAR were comparable to those in other polar regions, such as those presented by Delene and Ogren (2002) and Quinn et al. (2007) at Barrow and Aaltonen et al. (2006) at Pallas.
Correspondingly, the hourly mean values of the ω0
param-eter measured at ALOMAR presented average values of 0.93, 0.91 and 0.89 at 450 nm, 550 nm and 700 nm, respectively. Values ranged from 0.60 to 0.99, 0.62 to 0.99 and 0.50 to 0.99, respectively (see Fig. 2 and Table 1). The lowest value registered was 0.62 (550 nm); but, in fact, ω0was observed
to vary mainly between 0.80 and 0.99, as seen in Fig. 2 and confirmed by the value of the median, 0.92, and the first quar-tile, P25, 0.89 (550 nm) (see also Fig. 3). These values lie in
the range presented for polar regions by several authors as compiled by Tomasi et al. (2007).
The measured spectral series of σsand σawere used to
de-rive the corresponding values of the scattering and absorp-tion ˚Angstr¨om exponents following the best-fit procedure based on Eq. (1). The ˚Angstr¨om exponents calculated for the 450 nm/700 nm wavelength pairs lay in the range between 0.20 and 3.07 for scattering and in the range between 0.01 and 0.97 for absorption. The observation of αavalues below 1
( f ) ( e ) ( d ) ( c ) ( b ) 1 0 4 1 0 2 1 0 0 1 0 2
0
1
2
3
0
1 0
2 0
3 0
0 . 6
0 . 7
0 . 8
0 . 9
1 . 0
0
2
4
J u n 1 30 J u n 2 8 J u l 1 3 J u l 2 8 A u g 1 2 A u g 2 7 4 0 0 0 8 0 0 0 1 2 0 0 0 σa( 5 5 0 n m )
σ
a[
M
m
-1]
σs( 5 5 0 n m )
σ
s[
M
m
-1]
ω0( 5 5 0 n m )
ω
0 αa αsα
45 0 -7 0 0 N [ # /c m 3 ] n u c l e a t i o n m o d e ( 1 0 - 3 0 n m ) A i t k e n m o d e ( 3 0 - 1 0 0 n m ) a c c u m u l a t i o n m o d e ( 1 0 0 - 3 9 0 n m ) 1 0 1d
P[
n
m
]
d n / d l o g 1 0d P ( a )Fig. 2. (a, b, c, d) Time-series of hourly average values of the σs, σa, ω0, αsand αa. (e) Particle number size distributions measured for the
submicrometer particles. Color scale indicates the number of particles in each size. (f) Temporal variation of the concentration of nucleation, Aitken and accumulation modes. The arrows indicate the occurrence of new particle formation events (periods of kind (3) as described in the text). All other concentration increases, not marked with arrows, correspond to periods of type (2). The remaining situations are clean conditions, situation (1).
is an interesting characteristic of the local absorbent particles and has previously been presented by Montilla et al. (2011), who measured continuous spectra of aerosol absorption co-efficients in the wavelength range of 320–800 nm and ob-tained the αaexponents for different spectral ranges,
includ-ing the UV range. Statistical properties of the hourly mean values of αs,a are presented in Table 1 and show mean
val-ues of 1.37 and 0.40, respectively. In both cases, the median value is lower than the mean. The standard deviations are 0.61 and 0.21, respectively. Figure 2d shows the hourly mean
˚
Angstr¨om exponent values for the 450 nm/700 nm wave-length pair covering the entire measurement period.
The frequency histograms of αs and αa are shown in
Fig. 3d, e. The histogram for αapresents only one frequency
mode, centered at 0.35, whereas the histogram for αspresents
two modes, centered at 0.7 and 1.9. Whereas the absorption ˚
Angstr¨om exponent lies in the range presented for other polar
regions (Tomasi et al., 2007; Aaltonen et al., 2006), the scat-tering ˚Angstr¨om exponent presents a few high values that are more typical of sites affected by urban or continental pollu-tion (Vrekoussis et al., 2005; Lyamani et al., 2008). These values may be due to long-range transport episodes from Central Europe and Russia. In Fig. 1, the trajectory of the air mass arriving from sector 3 (day 14 July – black line) is presented as an example of transport from Russia. The σs
and σa values at 550 nm were 8.36 Mm−1 and 0.67 Mm−1,
respectively, while the αsand αavalues were 2.10 and 0.37,
respectively. For the sample trajectory arriving from sector 2 (blue line), σs and σa reached values of 9.53 Mm−1 and
0.61 Mm−1, respectively, and the αsand αavalues were 2.01
and 0.44, respectively. A sample trajectory arriving from Bel-gium (day 2 June – magenta line) is presented for sector 1. The σs and σaparameters reached values of 11.48 Mm−1
0 . 0 0 . 5 1 . 0 1 . 5 2 . 0 2 . 5 0 1 0 0 2 0 0 3 0 0 4 0 0 5 0 0 6 0 0 F re q u e n c y σa ( 5 5 0 n m ) [ M m - 1] ( b ) 0 5 1 0 1 5 2 0 2 5 0 1 0 0 2 0 0 3 0 0 4 0 0 F re q u e n c y σs ( 5 5 0 n m ) [ M m - 1] ( a ) ( c ) 0 . 6 0 . 7 0 . 8 0 . 9 1 . 0 0 2 0 4 0 6 0 8 0 1 0 0 1 2 0 1 4 0 1 6 0 1 8 0 F re q u e n c y ω0 ( 5 5 0 n m ) 0 . 0 0 . 8 1 . 6 2 . 4 3 . 2 0 2 0 4 0 6 0 8 0 1 0 0 1 2 0 1 4 0 1 6 0 ( e ) ( d ) F re q u e n c y
α
s ( 4 5 0 - 7 0 0 ) 0 . 0 0 . 2 0 . 4 0 . 6 0 . 8 1 . 0 0 2 0 4 0 6 0 8 0 1 0 0 1 2 0 1 4 0 1 6 0 1 8 0 2 0 0 F re q u e n c yα
a ( 4 5 0 - 7 0 0 )Fig. 3. Frequency histogram for the (a) σs, (b) σa, (c) ω0, (d) αsand
(e) αa.
1.88 and 0.33, respectively. The sample events presented for sectors 1, 2 and 3 are characterized by small particles with higher absorption and scattering than the average. These events confirm the transport of anthropogenic aerosols from the mid-latitudes into the sub-Arctic area, as already regis-tered by Rodr´ıguez et al. (2012).
The maximum mean values of σa and σs were observed
for sector 2 (SE) and were 0.61 and 9.53 Mm−1, respec-tively. The minimum mean values of σaand σswere observed
for sector 4 (NNE) and were 0.29 and 3.90 Mm−1,
respec-tively. The mean ω0parameter ranges from 0.89 (when the
air masses came from sector 3 (E)) to 0.94 (when the air masses came from sector 2 (SE)). A similar behavior is pre-sented by αa and αs, for which the maximum mean values
were observed in sector 2 (0.44 and 2.01, respectively). The minimum mean value of αa, 0.24, was observed for sector 5
(NW), whereas the minimum mean αs, 0.79, was observed
for sector 4 (NNE). The mean value of αω0 ranges from 0.03 for sector 4 to 0.13 for sector 1 (S). See Fig. 8.
We also analyzed the spectral dependence of the single-scattering albedo because this parameter, αω0, is known to be very sensitive to the composition of the particles. For the 450 nm/700 nm wavelength pair, αω0 was found to range be-tween −0.11 and 0.95 (with a mean value and a standard de-viation of 0.09). The high standard dede-viation of this parame-ter within its range of values indicates that a large variety of aerosol types is present at ALOMAR during the summer. The observed negative values are due to desert aerosol air masses that reach the ALOMAR station. These rare events, arriving from North Africa, are usually weak and of short duration, since desert aerosols have to travel across Europe to reach the ALOMAR station. One or two of these events, of 1–2 days in duration, are observed every summer (Rodr´ıguez et al., 2011). These events were confirmed by data from the CIMEL sun photometer (part of the AERONET network) located at the station. If the daily aerosol optical depth exceeds a threshold value (given by the annual mean plus one standard deviation) and the extinction ˚Angstr¨om exponent is lower than 1.1, the day is classified as possible aerosol dust event (Rodr´ıguez et al., 2011). The back trajectories and MODIS images are then analyzed to confirm the dust events. Unfortu-nately, only very weak dust events were observed during the period reported in this paper and the potential dust that ar-rived at the station was always mixed with pollution or other particles making it difficult to track down the exact source. However, in August 2007 our group detected the presence of coarse dust aerosol particles in Andenes and that event is reported and fully analyzed in Rodr´ıguez et al. (2012) (the dust aerosol optical depth provided by the NAAPS model, the aerosol optical depth and the ˚Angstr¨om exponent pro-vided by the Cimel sun photometer and the MODIS-Terra sensor are presented in that work for the days of the event).
3.2 Particle number concentrations in various size
ranges
In this section, we first independently present the characteris-tics of each particle size range and then analyze the relations between these ranges.
The average hourly concentration for the submicrome-ter particles (10–390 nm) was 1277 cm−3, with a standard deviation of 1563 cm−3. The average value for the con-centration of micrometer-sized aerosols (0.5–10 µm) was 1 cm−3, with a standard deviation of 1 cm−3. The aver-age number concentration measured for the total range (3–10 000 nm) is 2463 cm−3, with a standard deviation of
4251 cm−3. The submicrometer range is further investigated
for the ranges 30–50, 50–390 and 100–390 nm. The aver-age number concentrations and their standard deviations are 258 cm−3(355 cm−3), 469 cm−3(516 cm−3) and 183 cm−3 (209 cm−3), respectively. The concentration percentiles are tabulated with their respective mean values in Table 1. ALO-MAR has slightly higher results for the aerosol number con-centration in the size sections N30−50 and N50 but slightly
smaller concentrations for N100 than those measured in the
sampling study of Asmi et al. (2011) conducted at the Pal-las station, which is located at almost the same latitude as ALOMAR but in a remote continental area in Northern Fin-land. It should be stressed however, that our concentration
N100comprises the size range 100–390 nm, whereas that of
Asmi’s comprises a broader size range (100–500 nm). The number size distribution level exhibits the same range of values for the section N30−50 at ALOMAR as at Birkenes,
which is located in Southern Norway, but the values recorded at Birkenes for N50 and N100 are almost twice those
regis-tered at ALOMAR. However, the number size distributions across all sections at the Arctic station of Zeppelin, located in the Svalbard Islands, are half of the values recorded at ALO-MAR.
A plot of the particle number size distributions measured for the submicrometer particles is presented in Fig. 2e,f and illustrates the temporal evolution for all campaign days. On the same figure, we also show the aerosol number concentra-tions of nucleation, Aitken and accumulation mode particles (30 nm and 100 nm are used as the cut-off values of the diam-eters between the modes). It is possible to identify three types of periods that are connected to the weather conditions: (1) clean conditions with very low concentrations of particles, usually associated with periods after rain; (2) periods with a small increase in the total concentration and rapid varia-tions of the concentravaria-tions; and (3) periods when new parti-cle formation events occur, typically associated with sunny days with higher temperature and lower humidity.
The six-day period from 27 June to 2 July was selected for further analysis because it exemplifies the first situation, “clean conditions”. In the days preceding this period, it had rained, and after the rain stopped, the nucleation, Aitken and accumulation mode concentrations presented average val-ues of 176, 443 and 239 cm−3, respectively. Those measures were taken as background values for the ALOMAR station.
The period from 28 July to 1 August corresponds to the second situation described. Very rapid variations in the num-ber concentrations were observed during this period, with the three modes maintaining the high mean values of 1186, 647 and 460 cm−3, respectively.
The observed new particle formation events caused the to-tal particle concentration to increase from several hundred particles cm−3 to over 1000 particles cm−3. The criteria for identifying new particle formation events are based upon ob-servations of the rapid growth of particles from 10 nm to larger sizes in a relatively short time, forming a banana-shaped growth curve in the surface plot. An example of a typ-ical particle formation event measured at ALOMAR took place on 20 July. At 07:00 UTC, newly formed particles with diameters of less than 30 nm increased in number concen-tration until the nucleation mode reached 3912 cm−3. After that value had been achieved, the particles grew at a rate of a few nm h−1, reaching sizes of between 30 and 100 nm by evening and sizes larger than 100 nm by nightfall. The Aitken
mode reached a maximum of 2580 cm−3at 17:00 UTC, and
the accumulation mode reached a maximum of 928 cm−3at
01:00 UTC on 21 July.
In Fig. 1, the trajectory arriving from sector 4 (day 3 Au-gust – red line) is presented as an example of the most com-mon air mass associated with the occurrence of new particle formation events. Thirteen cases were identified as poten-tial new particle formation events; 54 %, 23 % and 15 % of those events corresponded to air masses arriving from sec-tor 4 (NNE), secsec-tor 6 (W) and secsec-tor 5 (NW), respectively. These results are in agreement with the results published by Kulmala et al. (2005) for the Hyyti¨al¨a station and with those of Maso et al. (2007) for four Nordic stations (Hyyti¨al¨a, As-pvreten, V¨arri¨o and Pallas), which established the Arctic and North Atlantic areas as the sources of air masses leading to new particle formation. The trajectories arriving from sectors 5 (yellow line) and 6 (green line) refer to the days 15 August and 25 July, respectively. The trajectory presented for sec-tor 5 is also an example of a new particle formation event day. The air masses arriving from sectors 4 and 5 are similar in the values registered for the optical and the microphysi-cal parameters of the particles. The air masses arriving from sector 6 present higher concentration of particles and with higher optical parameters than those arriving from sectors 4 and 5.
The median size distribution for all campaign days is pre-sented in Fig. 4, showing the median, 16th and 84th per-centiles of each measured size section. The thicker line indi-cates the median size distribution collected for all campaign days, and the colored lines indicate the size distribution as-sociated with each of the 6 sectors considered. A bimodal shape is observed for the submicrometer fraction. The Aitken mode, which is rather flat for diameters from 40 to 50 nm, has a maximum concentration of 627 cm−3. The accumula-tion mode occurs for diameters from 140 to 170 nm and has a maximum concentration of 260 cm−3. The APS data show a small mode at 2300 nm for the coarse fraction, Fig. 4b. Sec-tor 2 (SE) presents the most distinct shape and has the highest concentration of particles, with a peak near 100 nm. Sectors 1 and 3 (S and E), present similar shapes, but higher concentra-tions are observed for sector 1. The submicrometer fracconcentra-tions for these three air masses are distributed monomodally. The submicrometer fractions for sectors 4, 5 and 6 (NNE, NW and W) present a bimodal shape; higher concentrations are observed for sector 6, and lower concentrations are observed for sector 5.
During all the field campaign, the nucleation mode oc-curred more often in sectors 1 and 6 (S and W), whereas the Aitken and accumulation modes presented the highest con-centrations in sectors 1, 2 and 3 (S, SE and E). The microme-ter fraction was present at very low concentrations in all sec-tors, with the highest concentration in sector 2 (SE) and the lowest concentration in sector 5 (NW). Particles in the total size range, from 3 to 10 000 nm, were present in sectors 1 and
1 0 1 0 0 1 0 0 0 0 4 0 0 8 0 0 1 2 0 0 1 6 0 0 2 0 0 0 2 4 0 0 2 8 0 0 3 2 0 0 3 6 0 0 d n / d l o g10 dp [ # /c m 3] P a r t i c l e d i a m e t e r [ n m ] ( a ) 5 0 0 1 0 0 0 1 0 0 0 0 0 . 0 0 . 5 1 . 0 1 . 5 2 . 0 2 . 5 3 . 0 3 . 5 4 . 0 4 . 5 5 . 0 5 . 5 6 . 0 S e c t o r s : 1 ( S ) 2 ( S E ) 3 ( E ) 4 ( N N E ) 5 ( N W ) 6 ( W ) A l l ( m e d i a n ) A l l ( P1 6) A l l ( P8 4) d n / d l o g10 dp [ # /c m 3] P a r t i c l e d i a m e t e r [ n m ] ( b )
Fig. 4. Median size distributions (thicker black line) and
16th and 84th percentile distributions (shaded areas) for the:
(a) submicrometer particles, (b) micrometer particles. The colored
lines represent the median size distributions observed in different air masses.
2 (S and SE) at higher concentrations; sector 3 (E) presented lower concentrations, see Fig. 8c.
The relationship between the Aitken and accumulation modes, N30−100/N100, was investigated by examining the
concentration of particles with sizes between 30 and 100 nm as a function of N100 concentrations (a scatter plot of
N30−100versus N100is available as Supplement
accompany-ing this paper, Supplement). The N values are concentrated mainly in a grouping between 100 and 1000 cm−3, and the
N30−100/N100ratio remained mostly above 1 throughout the
campaign (range: 0.15 to 161.52; average: 4.47; StD: 7.67). Based on the bimodal shape of the median size distribu-tion, on the particle concentrations for each size range and on the shape of the area with the greatest density of points in the N30−100 versus N100 scatter plot, we conclude that
the ALOMAR station is sufficiently similar to other Nordic stations and can be included in the group “Northern Euro-pean Aerosol”. This classification was presented by Asmi et al. (2011) (including the stations of Birkenes, Vavihill, As-pvreten, Hyytial¨a and Pallas), which refers to stations that are sufficiently similar, with regard to these parameters, to be de-scribed as the same type dominated by clean continental and Atlantic aerosols but with the occasional influence of more polluted air masses.
3.3 Relationships between the aerosol parameters
In Fig. 5a, c, we present the correlation between scatter-ing/absorption in the various channels. The relation between channels describes the proportion of the measurements at dif-ferent wavelengths, and each pair of measurements should obey Eq. (1). In this way, the slope of the linear fit for each correlation between the channels is the respective ˚Angstr¨om exponent. For the absorption coefficients, one line is suffi-cient to correlate the different channels, but two lines with different slopes are observed for the scattering coefficients. Since the slopes of the lines depend on the particle size, those two lines appear to represent different aerosol types, and the ˚Angstr¨om exponent can be used to help identify the aerosol types, that can be the result of transport from
differ-0 5 1 0 1 5 2 0 2 5 0 1 2 3 4 0 . 0 0 . 5 1 . 0 1 . 5 2 . 0 2 . 5 0 . 0 0 . 5 1 . 0 1 . 5 0 . 0 0 . 5 1 . 0 1 . 5 2 . 0 2 . 5 0 . 0 0 . 5 1 . 0 1 . 5 2 . 0 2 . 5 3 . 0 0 5 1 0 1 5 2 0 2 5 0 5 1 0 1 5 2 0 2 5 3 0 3 5 0 . 0 0 . 5 1 . 0 1 . 5 2 . 0 2 . 5 0 5 1 0 1 5 2 0 2 5 0 . 0 0 . 5 1 . 0 1 . 5 0 . 0 0 . 5 1 . 0 1 . 5 2 . 0 2 . 5 3 . 0 3 . 5 αs ( 4 5 0 - 5 5 0 ) αs ( 4 5 0 - 7 0 0 ) αs ( 5 5 0 - 7 0 0 ) αs ( 4 5 0 - 5 5 0 - 7 0 0 ) αs σs( 5 5 0 n m ) [ M m - 1 ] ( b ) αa ( 4 5 0 - 5 5 0 ) αa ( 4 5 0 - 7 0 0 ) αa ( 5 5 0 - 7 0 0 ) αa ( 4 5 0 - 5 5 0 - 7 0 0 ) αa σa( 5 5 0 n m ) [ M m - 1 ] ( d ) σa ( 4 5 0 n m ) [M m -1] σa ( 5 5 0 n m ) [ M m - 1 ] ( c ) σs ( 4 5 0 n m ) [M m -1] σs ( 5 5 0 n m ) [ M m - 1 ] ( a ) σs ( 5 5 0 n m ) [M m -1] σa ( 5 5 0 n m ) [ M m - 1 ] ( e ) αs(4 5 0 -7 0 0 ) αa ( 4 5 0 - 7 0 0 ) r e g i o n A r e g i o n B ( f )
Fig. 5. (a, c) Hourly average values of the scattering and absorption
for different wavelengths. (b, d) Hourly average values of the σsand
σaas a function of the respective ˚Angstr¨om exponents. Relationship
between the coefficients σsand σa(e) and between the slopes αsand
αa(f).
ent regions. The line with smaller slope is associated with larger particles, most likely marine aerosols (also dust par-ticles during desert events). The data that contribute to this line have a strong correlation with the number concentrations of the coarse particles Nmicrometer (> 500 nm) as
demon-strated by the value R = 0.9. The line with the higher slope is associated with smaller particles, i.e., continental or pol-luted aerosols, and its data present a correlation of R = 0.6 with the concentration of particles in the accumulation mode,
N100.
Additionally, in Fig. 5b, d, we present the rela-tion between the scattering/absorprela-tion coefficients and the respective ˚Angstr¨om exponents. The ˚Angstr¨om ex-ponents were calculated for the pairs of wavelengths 450 nm/550 nm (αa,s(450–550)), 550 nm/700 nm (αa,s(550–
700)) and 450 nm/700 nm (αa,s (450–700)), and for the
three wavelengths 450 nm/550 nm/700 nm (αa,s (450–550–
˚
Angstr¨om exponents are higher for the pair of wavelengths 450 nm/550 nm and smaller for the pair 550 nm/700 nm, thereby defining the shape of the scattering and absorp-tion spectra in the following way: decreases quickly in the 450 nm/550 nm range and decreases less abruptly in the 550 nm/700 nm range. Thus, both coefficients are more sen-sitive to spectral variations at low wavelengths than at high wavelengths of the visible spectrum. For the ˚Angstr¨om ex-ponents, we determined the fit error, e, and the quality of the fit using the R parameter. The fit error was calculated as the standard error of the slope of the best-fit line for the observed data σ × λ – its mean value is 23 %. The R parameter was computed as the fraction of the total variation of the σ values of data points that are attributable to the assumed fitting line and was only used qualitatively to evaluate the fit. Both e and
Rwere used to evaluate and filter the data set.
Figure 5e illustrates the relationship between the scatter-ing and absorption coefficients. This represents another way to analyze the single-scattering albedo parameter, and the low values of σa compared to those of σs are responsible
for the high ω0values observed. In Fig. 5f, the relationship
between the ˚Angstr¨om exponents is also presented, and two regions can be identified as exhibiting a higher density of data. Region A, with higher αaand αsvalues, indicates light
absorption by smaller particles, and region B, with lower
αa and αs values, indicates light absorption by larger
parti-cles. These two regions represent the two modes that were observed in the frequency histogram of the αs parameter
(Fig. 3d). In Fig. 3d, the higher density near αs=0.7 and
αs=1.9 and the lower density near αs=1.3 should be noted.
The αsvalues can be explained by the aerosol size
distribu-tions measured by the APS, as the count mean diameter of the size distribution (see Fig. 7c and its explanation in the text) presents a correlation of −0.70, with smaller particles associ-ated with higher αsvalues. Because αadepends on the
chem-ical composition of the particles (as mentioned before, differ-ent aerosol species presdiffer-ent differdiffer-ent λ dependencies on light absorption), we conclude that region A, which has higher ex-ponents due to the presence of smaller particles, presents the characteristics of continental polluted aerosols, which may originate from continental urban sources. Region B, which has lower exponents due to the presence of coarse particles, which are clean and less absorbent, may be of marine ori-gin. This conclusion is further supported by the frequency of occurrence of the trajectories for each region. 75 % of the data contributing for region A arrived from sectors 1, 2 and 3 and 95 % of the data contributing for region B arrived from sectors 4, 5 and 6.
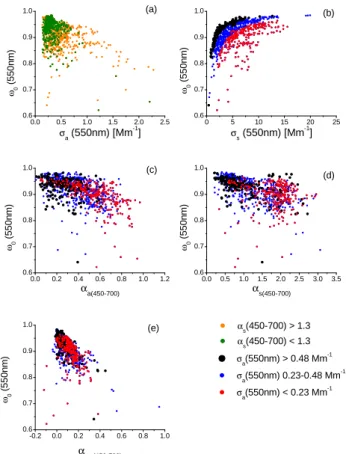
Figure 6 displays the value of ω0 as a function of the
scattering/absorption coefficients and the ˚Angstr¨om expo-nents. A comparison of ω0 with σa and σs was performed
in order to identify the darkest and the whitest aerosols. The data are classified according to σainto three groups, namely
<0.23 Mm−1, 0.23–0.48 Mm−1 and > 0.23 Mm−1 (corre-sponding to the first quartile, second + third quartiles and
0 . 0 0 . 5 1 . 0 1 . 5 2 . 0 2 . 5 0 . 6 0 . 7 0 . 8 0 . 9 1 . 0 0 5 1 0 1 5 2 0 2 5 0 . 6 0 . 7 0 . 8 0 . 9 1 . 0 0 . 0 0 . 2 0 . 4 0 . 6 0 . 8 1 . 0 1 . 2 0 . 6 0 . 7 0 . 8 0 . 9 1 . 0 0 . 0 0 . 5 1 . 0 1 . 5 2 . 0 2 . 5 3 . 0 3 . 5 0 . 6 0 . 7 0 . 8 0 . 9 1 . 0 - 0 . 2 0 . 0 0 . 2 0 . 4 0 . 6 0 . 8 1 . 0 0 . 6 0 . 7 0 . 8 0 . 9 1 . 0 α s( 4 5 0 - 7 0 0 ) > 1 . 3 αs( 4 5 0 - 7 0 0 ) < 1 . 3 ω0 ( 5 5 0 n m ) σa ( 5 5 0 n m ) [ M m - 1 ] ( a ) ω0 ( 5 5 0 n m ) σs ( 5 5 0 n m ) [ M m - 1 ] ( b ) σa( 5 5 0 n m ) > 0 . 4 8 M m - 1 σa( 5 5 0 n m ) 0 . 2 3 - 0 . 4 8 M m - 1 σa( 5 5 0 n m ) < 0 . 2 3 M m - 1 ω0 ( 5 5 0 n m ) αa ( 4 5 0 - 7 0 0 ) ( c ) ω0 ( 5 5 0 n m ) αs ( 4 5 0 - 7 0 0 ) ( d ) ω0 ( 5 5 0 n m ) αω 0 ( 4 5 0 - 7 0 0 ) ( e )
Fig. 6. Hourly average values of the single scattering albedo as
a function of the (a) absorption coefficient, (b) scattering
coeffi-cient, (c) absorption ˚Angstr¨om exponent, (d) scattering ˚Angstr¨om
exponent and (e) exponent αω0.
fourth quartile, respectively). Any absorption value may lead to the lowest values of ω0, whereas for scattering, the lowest
ω0values are observed in the lowest σsrange (< 5 Mm−1). A
comparison between ω0and αa is also of interest, since the
wavelength dependency of the absorption is related to the composition of the aerosols. This is shown in Fig. 6c. The most absorbent particles exhibit αavalues below 0.6, while
the less absorbent particles present higher αa values,
reach-ing near unity. In Fig. 6d, ω0 is compared to αs to search
for information on the size of the aerosols and to examine whether the optical data can provide support for the size dis-tribution measurements. The joint analysis of Fig. 6a and Fig. 6c shows that, for a given σa value, lower ω0 values
correspond to higher αs values, and higher ω0 values
cor-respond to smaller αs values. This result agrees with that
obtained by Clarke et al. (2007) and, considering that αs
is higher for smaller particles (see Fig. 7c and its expla-nation in the text), one can conclude that, for a given σa
value, lower ω0 values correspond to smaller particles, and
higher ω0 values correspond to larger particles. In Fig. 6e,
the single-scattering albedo, ω0, is plotted against its own
0 . 6 0 . 7 0 . 8 0 . 9 1 . 0 1 0 1 0 0 1 0 0 0 1 0 0 0 0 N 1 0 - 3 9 0 C M D [ n m ] ω0 N > 5 0 0 0 . 6 0 . 7 0 . 8 0 . 9 1 . 0 0 2 0 0 0 4 0 0 0 6 0 0 0 8 0 0 0 1 0 0 0 0 1 2 0 0 0 1 4 0 0 0 0 2 4 6 8 1 0 1 2 1 4 N 1 0 - 3 9 0 Ns u b m ic ro m e tr ic [ # /c m 3 ] ω0 N > 5 0 0 Nm ic ro m e te r [ # /c m 3 ] 0 . 0 0 . 5 1 . 0 1 . 5 2 . 0 2 . 5 3 . 0 1 0 1 0 0 1 0 0 0 1 0 0 0 0 N 1 0 - 3 9 0 V M D [ n m ] αs ( 4 5 0 - 7 0 0 ) N > 5 0 0 0 . 0 0 . 5 1 . 0 1 . 5 2 . 0 2 . 5 3 . 0 1 0 1 0 0 1 0 0 0 1 0 0 0 0 N 1 0 - 3 9 0 C M D [ n m ] αs ( 4 5 0 - 7 0 0 ) N > 5 0 0 0 5 1 0 1 5 2 0 2 5 0 2 0 0 0 4 0 0 0 6 0 0 0 8 0 0 0 1 0 0 0 0 1 2 0 0 0 N n u c l e a t i o n N A i t k e n N a c c u m u l a t i o n Ns u b m ic ro m e tr ic [ # /c m 3 ] σs [ M m - 1] 0 5 1 0 1 5 2 0 2 5 0 2 0 0 0 4 0 0 0 6 0 0 0 8 0 0 0 1 0 0 0 0 1 2 0 0 0 1 4 0 0 0 0 2 4 6 8 1 0 1 2 1 4 N 1 0 - 3 9 0 Ns u b m ic ro m e tr ic [ # /c m 3 ] σs [ M m - 1] N > 5 0 0 Nm ic ro m e te r [ # /c m 3 ] ( a ) ( b ) ( c ) ( d ) ( e ) ( f )
Fig. 7. Relation between σsand (a) micrometer and submicrometer
concentrations, (b) nucleation, Aitken and accumulation modes. (c)
Relation between the size of the particles (CMD) and αs. (d)
Rela-tion between the size of the particles (VMD) and αs. (e) Relation
between ω0and the micrometer and submicrometer concentrations.
(f) Particle size (CMD) as a function of ω0.
wavelength, αω0>0, but in some cases the single scattering albedo increases with the wavelength (αω0<0). This situa-tion has been reported in previous studies to be a result of the arrival of dust (Rodr´ıguez et al., 2011). Only a few such oc-currences (very weak) took place during our measurements, and these cases were characterized by higher total particle number concentrations, such as 3919 cm−3.
According to Cappa et al. (2009), the relationship between
ω0, an intensive aerosol optical property, and σa, an extensive
property, can be used to differentiate between background aerosols and the inputs of primary aerosols. Applying this methodology at the ALOMAR station, we observe predomi-nantly high values of ω0caused by very low σavalues. This
fact, together with the αs values registered, allows us to
de-scribe the local air as extremely clean and only episodically influenced by small particles resulting from long-range trans-port. This conclusion is also supported by results obtained by other techniques, such as the analysis of the air mass origins (see Sect. 3.4) and the use of MODIS images and columnar data from the CIMEL photometer (shown in Rodr´ıguez et al., 2011).
Figure 7a, b illustrates the particle number concentration in different size fractions and modes as a function of the
scat-0 . 6 scat-0 0 . 6 5 0 . 7 0 0 . 7 5 0 . 8 0 0 . 8 5 0 . 9 0 0 . 9 5 1 . 0 0 0 . 0 0 . 2 0 . 4 0 . 6 4 5 6 7 8 9 1 0 0 . 0 0 0 . 0 5 0 . 1 0 0 . 1 5 0 . 2 0 0 . 2 0 . 3 0 . 4 0 . 5 0 . 6 1 . 0 1 . 2 1 . 4 1 . 6 1 . 8 2 . 0 2 . 2 0 5 0 0 1 0 0 0 1 5 0 0 2 0 0 0 2 5 0 0 3 0 0 0 3 5 0 0 0 . 0 0 . 5 1 . 0 1 . 5 2 . 0 2 . 5 3 . 0 T T T T T T 1 2 3 4 5 6 A i r m a s s o r i g i n s e c t o r 5 % 3 % 1 2 % 3 1 % 2 7 % 2 2 % ω0 ω0 ( 5 5 0 n m ) σ a σs σa,s ( 5 5 0 n m ) [M m -1] ( a ) 1 2 3 4 5 6 ( b ) A i r m a s s o r i g i n s e c t o r 5 % 3 % 1 2 % 3 1 % 2 7 % 2 2 % αω 0 αω (0 4 5 0 -7 0 0 ) αa α s αa,s ( 4 5 0 -7 0 0 ) 1 2 3 4 5 6 ( c ) A i r m a s s o r i g i n s e c t o r 5 % 3 % 1 2 % 3 1 % 2 7 % 2 2 % N 1 0 - 3 0 N 3 0 - 5 0 N5 0 - 1 0 0 N1 0 0 - 3 9 0 s u b m i c r o m e t e r ( N1 0 - 3 9 0) N [ # /c m 3 ] T t o t a l m i c r o m e t e r Nm ic ro m e te r [ # /c m 3 ]
Fig. 8. Classification of air masses according to their origin.
Per-centage values refer the frequency of each air mass origin. (a, b) Summarizes the main characteristics of the optical properties of the
aerosols for the six air-mass types. The mean values of σa, σsand
ω0for 550 nm and αa, αsand αω0for the pair of wavelengths 450–
700 nm are shown for each sector. (c) Number concentrations ob-served in each situation.
tering coefficient (550 nm). Based on the Mie theory, only the supra-micrometer fraction and the accumulation mode are expected to present strong correlations with σs, whereas
the scattering coefficient is expected to be unresponsive to the nucleation and Aitken modes. In our results, no clear connec-tion between the total particle number concentraconnec-tion and the scattering coefficient can be seen. However, if we look at spe-cific size ranges, we see that aerosol particle concentration in the coarse mode is strongly correlated (R = 0.9) with the scattering coefficient. This correlation is lower for the num-ber concentration of accumulation mode particles (R = 0.5). No correlation can be seen for the Aitken and nucleation modes. These results are consistent with those presented by Aaltonen et al. (2006) at the Pallas station, who reported cor-relations of 0.71 for the coarse fraction and 0.60 for the ac-cumulation mode. However, care should be taken when di-rectly comparing the accumulation mode results, as Aaltonen et al. (2006) considered the range 95–500 nm, whereas our accumulation mode results refer to the range 100–390 nm. It was also previously shown by Virkkula et al. (1998), using results recorded in Finnish Lapland, that the correlation be-tween the total particle number concentration and σsis low,
but the correlation between the number concentration in the accumulation mode and σsis high.
The relationship between the particle size distributions and the scattering ˚Angstr¨om exponent is presented in Fig. 7c, d. The size of the particles is expressed as the count mean di-ameter of the size distribution, CMD =P (dNp)iNi, the surface mean diameter, SMD =P (dSp)iSi (not shown) and the vol-ume mean diameter, VMD =P (dVp)iVi. For the submicrom-eter fraction, the value of αs is insensitive to the size
dis-tribution. The correlation coefficients are 0.19, −0.04 and
−0.06 for CMD, SMD and VMD, respectively. For the mi-crometer fraction, the value of αsis correlated most strongly
with the CMD. The fits are −0.70, −0.12 and 0.10 for CMD, SMD and VMD, respectively. In the studies by Virkkula et al. (1998) and Garland et al. (2008), it was observed that the correlation of CMD with αs is not as strong as the
correla-tion of SMD and VMD with αs. This difference occurs
be-cause the size distribution was considered as a whole in both works cited. However, in our work, the analysis is performed separately for the submicrometer and micrometer fractions. Consideration of all sizes biases the correlation with CMD because it gives more weight to the small particles, which are less sensitive to scattering.
The fraction of particles that contribute to each ω0value is
shown in Fig. 7e, and Fig. 7f presents the size of the particles as a function of ω0. In practice, Fig. 7e has the same
mean-ing as Fig. 6a, b, as confirmed by the similar shape of the graphs. Note the similar shape between the graphs of ω0×σa
and Nsubmicrometer×ω0, confirming that for a given value of
σa, lower values of ω0 correspond to smaller particles and
higher values of ω0correspond to larger particles. Likewise,
the graphs of ω0×σaand Nmicrometer×ω0also present
simi-lar shapes. In Fig. 7f, we see that for the submicrometer frac-tion, the CMD varied from ∼ 20 to ∼ 160 nm, with an aver-age value of 66 nm. For the micrometer fraction, the CMD varied from ∼ 500 to ∼ 1400 nm, with an average value of 900 nm. Classifying the ω0in 5 bins, ω0<0.80, 0.80–0.85,
0.85–0.90, 0.90–0.95 and 0.95–1.00, we observe that the av-erage values of the CMD for the submicrometer and the mi-crometer fractions occurred in the bins 0.80–0.85 and 0.85– 0.90, respectively. The smallest average CMD, 57 nm, typi-cal of new particle formation episodes, was typi-calculated in the bin ω0>0.95. This value is slightly higher than that
pre-sented by Virkkula et al. (2011) at the Hyyti¨al¨a station, lo-cated in Southwestern Central Finland. The highest average CMD, 1065 nm, which was typical of long-range pollution episodes, was also calculated in the bin ω0>0.95.
3.4 Transport pathways of the air masses arriving at
ALOMAR
In addition to the special cases presented previously, the air mass trajectories and optical and microphysical data were statistically analyzed. Sectors 1, 2 and 3 (S, SE and E)
an-alyzed as a whole yield higher σa and σs coefficients and
higher αa and αs exponents than in sectors 4, 5 and 6 (σa,
σs, αaand αs are 27 %, 37 %, 5 % and 29 % higher,
respec-tively, for sectors 1, 2 and 3 than for sectors 4, 5 and 6). On average, these sectors are described by a monomodal size distribution and contain far more accumulation mode parti-cles and higher number concentrations than sectors 4, 5 and 6. This situation, as with the continental air, corresponds to region A, which is shown in Fig. 5f. Sector 2 presents the strongest accumulation mode, with a count of 3319 cm−3for particles close to 100 nm in diameter, but the air masses arriv-ing from this sector represent only 3 % of occurrences. Sec-tors 1 and 3 present maximum concentrations of 1656 cm−3 and 963 cm−3, respectively, at particles with sizes of 70 nm and 60 nm.
Sectors 4, 5 and 6 (NNE, NW and W), also analyzed as a whole, present lower coefficients and lower exponents, cor-responding to region B in Fig. 5f, for marine air. The size distribution of the submicrometer fraction for sectors 4, 5 and 6 is markedly bimodal, and the number concentrations are lower than in sectors 1, 2 and 3. The lowest scattering and absorption coefficients were observed for sector 4, and the lowest particle concentration was observed for sector 5. A more detailed discussion, in which each sector could be further broken up into special regions and in which the char-acteristics of mixed air masses could be specified, would re-quire data from longer measurement periods.
4 Summary and conclusions
Aerosol optical and microphysical properties were investi-gated during the summer of 2008 at the ALOMAR station, located in Andøya island on the Atlantic coast of Norway, approximately 300 km north of the Arctic Circle. Basic sta-tistical values for all data were presented, as were intra-data relationships and particle size distributions. Finally source regions were analyzed both by presenting specific events and by applying a trajectory statistical method.
The primary optical measurements made were light ab-sorption by particle soot abab-sorption photometry and light scattering by nephelometry. The scattering coefficients were strongly variable, ranging from 0.25 to 23.21 Mm−1 at 550 nm, whereas the absorption coefficients, also at 550 nm, were more consistent, ranging from 0.13 to 2.28 Mm−1. The mean absorption coefficient was very small, leading to high single-scattering albedos (mean ω0=0.91, range 0.62–
0.99 at 550 nm). The scattering and absorption ˚Angstr¨om exponents showed similar behavior, with higher values from 450 to 550 nm and smaller values from 550 to 700 nm. The spectral dependence of the single scattering albedo was also analyzed and it mainly decreases with wavelength. However, some cases were noted in which the single scattering albedo increases with the wavelength. We analyzed the main char-acteristics of the microphysical properties of aerosols by de-termining the number size distributions and its parameters
provided by the SMPS, APS and UCPC and by examin-ing the aerosol evolution durexamin-ing the campaign. The observed mean total number concentration was 2463 cm−3. The
me-dian number size distributions were obtained and compared with those from other Northern European locations. The sub-micrometer fraction of the aerosol particles exhibited a bi-modal number size distribution. The Aitken mode presented a maximum concentration of 627 cm−3, and the accumula-tion mode presented a maximum concentraaccumula-tion of 260 cm−3. The ratio between the Aitken and the accumulation modes remained mostly above 1, which is typical of northern Eu-ropean locations. These results can be regarded as typical of those obtained in summer in this region, and the low values of the optical and microphysical parameters indicate that the predominant regional aerosols are mostly clean.
In practice, the scattering and absorption ˚Angstr¨om expo-nents are often used as qualitative indicators of particle size and chemical composition, respectively. At the ALOMAR station, one line proved to be sufficient to correlate the dif-ferent channels of absorption coefficients, meaning that only one type of absorbent particle is usually present. In contrast, two lines with different slopes are necessary to accurately correlate different channels of scattering coefficients, repre-senting two aerosol sizes. The line with the smaller slope (smaller αs) is associated with larger particles, as
demon-strated by the strong correlation with the number concen-trations of coarse particles (R = 0.9), and the line with the higher slope (higher αs) is associated with fine particles
(R = 0.6). To further explore the relationship between the wavelength dependence of the scattering coefficient and the size of the particles, αswas compared with the
submicrome-ter and micromesubmicrome-ter size distributions in submicrome-terms of count mean diameters, surface mean diameters and volume mean diame-ters. Only the micrometer CMD proved to be correlated with
αs, which occurred because particles smaller than 100 nm
provide only a small contribution to the scattering (σs
cor-related strongly with the number concentration of accumula-tion mode particles and more strongly with the micrometer fraction of particles, but poor correlations were obtained for the Aitken and nucleation modes). However, the αs
parame-ter can still be used as an indicator of particle size if our aim is only to distinguish between the accumulation mode and the coarse mode.
A back trajectory analysis showed significant differences in the optical parameters between the maritime air masses (NNE, NW and W) and continental air masses (S, SE and E). The cleanest conditions were observed in connection with air masses arriving from the Arctic Ocean and the North At-lantic (NNE, NW), which were associated with the lowest optical and microphysical parameters and the lowest particle number concentrations. These air masses contained predom-inantly non-absorbent, coarser particles, and the size distri-bution is markedly bimodal. New particle formation events take place more often under these conditions (mainly in air masses with a NNE origin). The most contaminated
condi-tions were observed in connection with air masses arriving from Great Britain, Scandinavia, eastern Europe and Russia (S, SE and E), in which continental aerosols were predomi-nant and presented higher values for all optical parameters. This result indicates the presence of smaller absorbent parti-cles and explains the smaller values recorded for ω0. The size
distribution is monomodal and contains more accumulation mode particles and higher number concentrations than the air masses arriving from NNE, NW and W.
Most of the parameters measured at and calculated for this site are similar to those of other northern areas. Inter-est in these data relies on the previously unavailable vari-ety of information for this area, which allowed us to ac-complish our aim and determine the general characteris-tics of local aerosols for the first time. Finally, we would like to point out that this study, which was conducted us-ing a small data set representus-ing measurements recorded over nearly three months, allowed us to clearly distinguish be-tween two aerosol types characteristic of well established sit-uations. The same work, if conducted over a larger (prefer-ably year-long) data set, would allow for more situations to be distinguished, in ALOMAR and other measurement sites.
Supplementary material related to this article is
available online at: http://www.atmos-chem-phys.net/12/ 5841/2012/acp-12-5841-2012-supplement.pdf.
Acknowledgements. We thank ALOMAR team for their help and
dedication and the INTA team for providing and operating part of the instrumentation. We thank the Division of Atmospheric Sciences (Helsinky University) team headed by M. Kulmala, and L. Laakso, for calibration facilities. Also, we thank the POLAR-CAT staff.
Financial support from the Spanish CICYT CGL2009-322 09740 and Complementary Action CGL2010-09480-E are gratefully ac-knowledged.
The authors gratefully acknowledge the NOAA Air Resources Lab-oratory (ARL) for provision of the HYSPLIT transport and dis-persion model and the READY website used in this publication (www.arl.noaa.gov/ready.html).
This work is dedicated by S. Mogo to Judite Fitas, a beautiful woman who has taught me how to spread my wings and fly. You made me who I am today and I thank you for every moment you share with me.