Faculdade de Ciências e Tecnologia
Differential expression in “rogue”
paramutation in peas (Pisum sativum L.)
- from mRNA to siRNA -
Ricardo Jorge dos Santos Pereira Nº36809
Dissertação
Mestrado Integrado em Engenharia Biológica
Trabalho efectuado sob a orientação de: Prof. Dr. José M. Leitão
2 Declaro ser o autor deste trabalho, que é original e inédito. Autores e trabalhos consultados estão devidamente citados no texto e constam da listagem de referências incluída
____________________
Ricardo Pereira
Copyright: A Universidade do Algarve tem o direito, perpétuo e sem limites geográficos, de arquivar e publicitar este trabalho através de exemplares impressos reproduzidos em papel ou de forma digital, ou por qualquer outro meio conhecido ou que venha a ser inventado, de o divulgar através de repositórios científicos e de admitir a sua cópia e distribuição com objetivos educacionais ou de investigação, não comerciais, desde que seja dado crédito ao autor e editor.
3
Agradecimentos
Em primeiro lugar agradeço aos meus pais porque sem eles não estaria a fazer esta dissertação. E claro à minha namorada e ao meu irmão por todo o apoio ao longo dos anos.
Gostaria de agradecer ao meu orientador, Professor José Leitão, pela oportunidade e também por todo o apoio durante este trabalho.
A todos os meus colegas que me apoiaram ao longo do curso, em especial agradeço ao João Caracol, André Cardoso e Fernando Rodrigues por todos os momentos bem passados.
Por último, mas não menos importante, muito obrigado à minha colega de laboratório Daniela Lourenço por me aturar e apoiar durante este trabalho.
4
Resumo
A paramutação é um fenómeno epigenético originado pela interação entre alelos que provoca alterações hereditárias na expressão génica. Embora estas interações sejam mais frequentemente observadas entre alelos do mesmo gene também existe casos onde as paramutações foram observadas entre sequências homólogas em posições não alélicas.
Os mecanismos moleculares que causam este fenómeno são ainda desconhecidos, no entanto em vários casos a paramutação tem sido associada à ação de RNAs não codificantes (ncRNA), a alterações na estrutura da cromatina e à metilação do DNA.
A metilação do DNA consiste na relocação de um grupo metil (CH3) de uma S-adenosil-l-metionina para o carbono 5’ da citosina ou adenina. Isto tem uma forte influência epigenética pois confere informação hereditária que não é codificada na sequência de DNA.
Os ncRNAs, que podem ser divididos em várias subcategorias tais como: micro-RNAs (mimicro-RNAs), long non-coding micro-RNAs (lncmicro-RNAs), Piwi-interacting micro-RNAs (piRNAs); enhancer RNAs (eRNAs), promoter-associated RNAs (PARs) e small interfering RNAs (siRNAs), têm sido associados a vários mecanismos que afetam a expressão génica, na regulação transcricional e pós-transcricional.
O primeiro caso de paramutação descrito foi o fenótipo Rogue em ervilheira (Pisum sativum L.), porém, os mecanismos moleculares responsáveis pelo aparecimento espontâneo e pela manutenção deste fenótipo não foram ainda esclarecidos, tal como não foram até ao momento esclarecidos, de forma inequívoca, todos os outros casos conhecidos de paramutação.
No entanto, sabe-se que o cruzamento de plantas Rogue com plantas do tipo selvagem resulta unicamente em plantas F1 "rogues" e que em todas as gerações seguintes as descendências são totalmente "rogue". A herança deste fenótipo encontra-se em contradição total com as regras de hereditariedade Mendeliana que preveem o aparecimento na geração F2 de pelo menos um quarto de indivíduos com o fenótipo selvagem e a duplicação desta percentagem em cada ciclo seguinte de autofecundação.
Este trabalho teve como objetivo avançar no caminho de descodificação deste fenómeno, aberrante do ponto de vista da genética clássica, tentando identificar diferenças de expressão génica entre uma cultivar de ervilheira (cv.Onward, JI2722) e
5 uma sua linha paramutada (Onward “Rogue”, line JI2723). Ambas gentilmente cedidas pelo Dr. Mike Ambrose do John Innes Institute, Reino Unido.
De acordo com esse objetivo procedeu-se à extração de RNA total de folhas jovens totalmente desenvolvidas de vários indivíduos dos dois tipos de plantas com a mesma idade e cultivadas em condições o mais idênticas possível. Do RNA procedeu-se ao isolamento do RNA mensageiro a partir do qual se procedeu à síntese de cDNA monocatenário, utilizado para realizar a maioria dos trabalhos efetuados para a preparação desta dissertação.
A fim de procurar diferenças na expressão génica efetuaram-se vários ensaios de Multi-RAPD Differential Display (MRDD), cuja técnica é baseada na técnica do Differential Display mas com algumas diferenças nomeadamente, omitindo o oligo-dT e substituindo a utilização de um único primer RAPD por uma combinação de quatro primers do mesmo tipo. Foram testadas 109 combinações diferentes de 4 primers RAPD, no entanto entre os mais de 700 produtos de amplificação nenhum se apresentou como polimórfico. Alguns resultados prévios que apontavam para a possível existência de polimorfismos não foram confirmados em segunda análise utilizando outras amostras biológicas.
A procura de polimorfismos na expressão génica foi então direcionada para a confirmação de expressão diferencial de sequências indicadas como estando presentes em quantidades diferentes nas amostras de cDNA da cv. Onward e da sua linha paramutada (Rogue) pela análise por Suppression Subtractive Hybridization (SSH) previamente efetuada pelo Laboratório.
Entre os inúmeros contigs fornecidos pela sequenciação massiva paralela (next generation sequencing) das bibliotecas geradas pela análise SSH (Santo e Leitão, resultados não publicados) foram selecionados 24 para análise neste trabalho. Desenharam-se primers que flanqueiam pequenos fragmentos (95 a 120 bp) dos 24 contigs, passiveis de serem analisados com alta eficiência pela técnica de RT-qPCR.
No entanto, tendo em linha de conta a grande quantidade de sequências aparentemente expressas diferencialmente identificadas pela técnica SSH, e os maiores requisitos em tempo, recursos humanos e materiais, da técnica de RT-qPCR, procedeu-se à avaliação prévia, mas menos precisa, da expressão diferencial das 24 procedeu-sequências pela comparação dos produtos da amplificação com menos ciclos (25 ciclos) por PCR. A validação deste teste prévio, teve como objetivo estabelecer um procedimento de
6 seleção que permita dar prioridade na análise por RT-qPCR às sequências com maior probabilidade de apresentarem diferenças significativas de expressão. Procede-se em paralelo a amplificações por 35 ciclos que serviram de controlo aos resultados das amplificações por 25 ciclos.
A comparação dos resultados por amplificação por RT-qPCR e os resultados da amplificação prévia por 25 ciclos de PCR demonstrou uma forte correlação entre estes dois tipos de análise, o que permitirá focar as análises por RT-qPCR nas sequências melhores candidatas a apresentarem diferenças significativas na sua expressão.
Os resultados da análise RT-PCR permitiram identificar diferenças na expressão de 11 sequências, das quais 8 com diferenças significativas e que poderão estar associadas a mecanismos moleculares relacionados com a paramutação. No entanto estes resultados terão de ser confirmados utilizando amostras biológicas adicionais.
Estudos recentemente desenvolvidos no Laboratório (Santo e Leitão, resultados não publicados) provaram a existência de metilação diferencial de sequências genómicas específicas nas folhas e no pólen de plantas da cv. Onward e linha Rogue. Estes dados chamam a atenção para os genes relacionados com metilação de DNA e modificações da cromatina e para possíveis alterações na sua expressão no processo de paramutação. Não sendo conhecida a sequência destes genes em Pisum sativum torna-se necessário identificar, pelo menos de forma parcial, a sequência exata de alguns desses genes nesta espécie antes de se proceder à análise da sua expressão dos mesmos em plantas rogues e não-rogues. Com base nos dados genómicos referentes a esses genes
em Medicago truncatula (http://www.jcvi.org/medicago) foram sintetizados primers
que permitiram amplificar algumas regiões dos genes ddm1, drm2 e mop1 em ervilheira, que foram confirmadas com elevada similaridade com as sequências dos mesmos genes em M. truncatula e Cicer arietinum (grão de bico) e em particular com
elevada similaridade das sequências proteicas que estas codificam
(http://blast.ncbi.nlm.nih.gov/Blast.cgi). Estas sequências serão utilizadas em breve para avaliar a expressão diferencial destes genes em plantas paramutadas (Rogue) e não-paramutadas (cv. Onward) de ervilheira.
A paramutação tem sido associada a mecanismos de metilação de DNA dirigidos por RNA (RNA directed DNA methylation - RdDM) pelo que demos inicio ao estudo comparativo das classes de siRNA presentes em plantas paramutadas e não-paramutadas. Com esse objetivo procedeu-se ao isolamento de siRNA em plantas
7 Onward e Rogue, separando o RNA total em duas frações distintas (alto peso molecular e baixo peso molecular) por precipitação fraccional com PEG e NaCl e à ligação de adaptadores RNA à fração de baixo peso molecular. O cDNA resultante dos siRNA ligado aos adaptadores foi amplificado por PCR durante 35 ciclos e durante 6 ciclos, respetivamente para visualização e para excisão (recuperação) em gel de agarose. A região entre os 71 e 76 bp (siRNA mais adaptadores) foi purificada para futura validação e posterior analise após sequenciação massiva paralela.
No entanto, o estudo da expressão génica diferencial por via da análise das sequências previamente identificadas pela técnica de Suppression Subtractive Hybridization (SSH) parece ser bastante prometedor e passível de identificar alterações de cadeias metabólicas associadas ao estabelecimento e manutenção da paramutação, pelo que se apresente como prioritário e urge ser rapidamente continuado.
8
Abstract
The “rogue” phenotype in peas (Pisum sativum L.) was the first reported case of paramutation, however, since this finding, most of the studies focussed on some cases of paramutation in maize. The main aim of this work was the identification of differentially expressed tags in the pea cv. Onward vs. its paramutated rogue line JI2723. One hundred-nine combinations of 4 RAPD primers were used in multi-RAPD differential display analysis, but no expression polymorphisms were identified between the two epigenomes. However, the RT-qPCR analysis of 24 out of the over 120 putatively differentially expressed sequences identified via next generation sequencing of suppression subtractive hybridization (SSH) libraries, allowed the identification of 11 differently expressed sequences. Among these sequences, 8 exhibited very significant differences in their expression in the two epigenomes. A procedure for pre-selection of putatively differently expressed sequences before more accurate confirmation by RT-qPCR analysis was developed and is expected to increase the efficiency of the analytical procedure. Recent studies performed in the Laboratory proved the existence of differences in the DNA methylation between the two epigenomes. Partial sequences of the genes related with DNA methylation and chromatin remodelling, ddm1,drm2 and mop1 were retrieved from the pea genome permitting the expression of these genes to be analysed in the paramutated vs. non-paramutated epigenomes. siRNA libraries of the two epigenomes are under construction and are expected to allow the identification of specific classes of siRNA associated with the “rogue” paramutation.
9
Table of contents
1-Introduction ... 10 1.1-Epigenetics ... 10 1.2- DNA methylation ... 10 1.3- Non-coding RNAs ... 11 1.4- Paramutation ... 121.5- Paramutation in mouse Kit gene ... 12
1.6- Paramutation at b1 locus in maize ... 14
1.7- Rogue phenotype in Pisum sativum L ... 14
1.8- Genes involved in DNA methylation, chromatin remodeling and paramutation ... 15
2- Materials and Methods ... 15
2.1- Plant material ... 15
2.2- RNA extraction ... 16
2.3- mRNA isolation ... 16
2.4- cDNA first strand ... 16
2.5- Quantification of RNA, DNA and cDNA ... 17
2.6- Multi-RAPD differential display analysis... 17
2.7- Low (25) cycles PCR and RT-qPCR amplifications ... 17
2.8- Real-time PCR ... 18
2.9- Identification of homolog sequences of the ddm1, drm2 and mop1 genes in Pisum sativum L. ... 19
2.10- Isolation and preparation of siRNA libraries for next generation sequencing ... 19
3- Results and discussion ... 21
3.1- Extraction of total RNA and mRNA isolation. ... 21
3.2- Multi-RAPD differential display analysis... 22
3.3- Expression analysis of SSH-selected sequences ... 24
3.4- On the way to the expression analysis of genes, involved in DNA methylation and chromatin remodeling: met1, ddm1, drm2 and mop1. ... 31
3.5 siRNA isolation ... 37
4- Discussion and future prospects ... 39
6- References... 41
Annex I ... 44
Annex II ... 48
10
1-Introduction
1.1-EpigeneticsThe term “Epigenetics” was defined by Conrad Waddington (1905-1975) as “the branch of biology which studies the causal interactions between genes and their products, which bring the phenotype into being” [1]. But this concept, like others, evolves and epigenetic can be also defined as “how genotypes give rise to phenotypes during development” or “the study of mitotically and/or meiotically heritable changes in gene function that cannot be explained by changes in DNA sequence” [2].
In spite of the different definitions, the objective of epigenetics is the study of mechanisms of gene regulation and mitotical and meiotical inheritance of information not encoded by the DNA sequence. Therefore epigenetics is responsible for establishing a connection between genotype and phenotype[3][4][5][6].
Observing a multicellular organism all cells are genetically similar but due to the differential expression these cells present very distinct structures and functions. The difference between the expression of cells is said to be epigenetic [3]. Usually the epigenetic mechanisms that are the cause of this difference in gene expression are DNA methylation, modifications of the chromatin and the action of non-coding RNAs [1][7]. 1.2- DNA methylation
DNA methylation consists on the relocation of a methyl group (CH3) from
S-Adenosyl-L-Methionine (SAM) to the carbon 5’ in the cytosine or adenine. This addition has a strong epigenetic influence as it confers inheritable information that is not encoded in the DNA sequence [8].
In eukaryotes, DNA methylation can influence a large range of biological functions such as gene expression, regulation of development, conservation of genome integrity and inactivation of X-chromosome in mammals. In prokaryotes it also has a great impact in biological functions such as differentiate self and non-self DNA and to coordinating DNA replication and the cell cycle [8].
In mammals, DNA methylation is almost restricted to occur in repeated regions of cytosine and guanine dinucleotides, it is belived that 70-80% of CG dinucleotides in these genomes are methylated, however there are regions normally found near gene promoters where is possible to find unmethylated CG dinucleotides in the CpG islands. In plants, DNA methylation usually occurs at cytosine bases within all sequence contexts: the symmetric CG and CHG contexts (where H=A, T, or C) and the
11 asymmetric CHH context. Genome wide, DNA methylation levels of approximately 24%, 6.7% and 1.7% are observed for CG, CHG, and CHH contexts, respectively. [9].
As mentioned before DNA methylation is a factor with high importance in gene regulation, typically presenting a repressive effect in transcription. This repressive effect occurs at three levels of control: 1) Several transcription factors, like AP-2, c-Myc/Myn, E2F, and NF"B, are not able to bind to methylated target sites. 2) DNA methylation recruits 5-methylcytosine binding proteins that act as repressors of gene transcription. 3) DNA methylation triggers histone deacetylation and thereby induces chromatin condensation which leads to a strong and stable repression of gene expression.[8]. 1.3- Non-coding RNAs
Non-coding RNAs (ncRNAs) can be divided in subcategories, like micro-RNAs (miRNAs), long non-coding RNAs (lncRNAs), Piwi-interacting RNAs (piRNAs); enhancer RNAs (eRNAs), promoter-associated RNAs (PARs) and small interfering RNAs (siRNAs). These RNAs have been associated with a variety of mechanisms that modulate gene expression and the mitotic, meiotical and transgenerational inheritance of epigenetic signals can be accomplished in part by non-coding RNAs [10][11][12].
Figure 1Post-transcriptional gene silencing mechanisms mediated by siRNAs and miRNAs, which are incorporated into RNA-induced silencing complexes (RISCs) that target specific mRNAs for cleavage, translational repression or destabilization (adapted from [10]).
Multiple ncRNAs have been established as negative transcription regulators and also playing a role in post-transcriptional regulation, like splicing, transport, translation, and degradation. One example of these mechanisms is the post-transcriptional gene silencing (PTGS) mediated by siRNAs and miRNAs (Fig. 1) where the two types RNAs
12 affect the expression of genes by influencing the stability and the translation of mRNA, the siRNAs silence the loci they are resulting from, whereas the miRNAs regulate other genes [10].
The effects of ncRNAs in transcription regulation has become an area of great interest and research, but the involvement of these RNAs in the regulation of expression is still far from being completely understood [10].
1.4- Paramutation
Paramutation is an epigenetic phenomenon in which an epigenetic state of an allele is transferred to another allele in trans, resulting in a heritable modification of the gene expression of the second allele [13][14]. While the interactions are most frequently observed between alleles of the same gene, paramutations have also been observed between homologous sequences at non-allelic positions [15][16].
By definition the allele that induces an epigenetic change on the other allele is considered to be paramutagenic and the sensitive allele is paramutable, while alleles that do not participate in the paramutation are designated as neutral. Frequently, the modified (paramutated) alleles also becomes paramutagenic, acquiring the ability of alter other sensitive alleles [13][17].
This phenomenon can be characterized by tree basic characteristics: i) the new epigenetic state is transferred to the following generations even if the original allele that induced the new epigenetic state is not transmitted; ii) the altered allele also acts like the paramutagenic allele; and iii) there is not any associated alteration in the DNA sequence[18].
It is still not understood how the paramutation occurs, but there are models that have already been proposed to explain the trans communication between alleles during paramutation like: i) the “trans RNA model” where the communication is mediated by intermediary RNA (siRNA and ncRNA) molecules; and ii) the “pairing model” that suggests that epigenetic states are altered by direct physical interaction between the intervening sequences. According to the current understanding of paramutation this models are not exclusive and can coexist and work together[17].
1.5- Paramutation in mouse Kit gene
Paramutations occurs both in animals and plants. One of the better studied cases of paramutation in mammals is the paramutation at the locus kit in mouse. The mouse Kit gene encodes the Kit tyrosine kinase receptor, fundamental in several processes
13 during mouse development such as germ cell differentiation, melanogenesis and haematopoiesis. By inserting a 3-kilobase (kb) lacZ-neo cassette downstream of the initiator site it was possible to engineer a null mutant tm1Alf [19].
The tm1Alf mutation annuls the synthesis of the kit tyrosine kinase receptor and
the Kittm1alf homozygotes die shortly after birth. The heterozygotes (Kittm1Alf/Kit+)
comparing to the wild-type mouse present a different phenotype, white tail tip and white feet (Fig. 2), due to the reduced level of expression of the Kit receptor [19].
Figure 2 Heterozygote mouse, genotype and phenotype (adapted from [19])
Comparing the levels of Kit mRNA from the mutant phenotype and the wild-type, it was determined that the mutant phenotype mouse has one-half of the Kit mRNA
found in the wild-type. When heterozygous Kittm1Alf/Kit+ are crossed or intermated with
wild-type homozygous (Kit+/Kit+) most of the homozygous for the allele wild-type
reveal the same phenotype and lower levels of kit mRNA as the heterozygous parent,
which suggests that Kittm1Alf is paramutagenic and the wild allele has adopted a new
epigenetic state denominated Kit* (the wild allel was paramutated) [19].
The microinjection of fertilized eggs with either total RNA from Kittm1Alf/Kit+
heterozygotes or Kit-specific microRNAs induced the white tail phenotype, evidencing the role of RNA in Kit paramutation [19].
14
Figure 3 “Rogue” phenotype in Pisum sativum L. 1) spontaneous “rogue” mutant cv. Onward plant.; 2) cv. Onward plant
1.6- Paramutation at b1 locus in maize
One of the most extensively studied cases of paramutation is the b1 locus in maize. The b1 locus is related with anthocyanin synthesis. There are several alleles for this locus, but only two participate in the paramutation phenomenon, B’ and B-I. Like described for all paramutation systems, both epiallels have the same DNA sequence, yet the B-I expression level is much higher than the B ' [7]. When B-I plants are crossed with B’ plants the heterozygous B’/B-I plants behave as homozygous B’/B’, the epiallel B-I is converted to the epigenetic B’ state and becomes paramutagenic [17]. Located 100 Kb upstream of the locus b1, both epialleles have seven tandem repeats of 853 bp absolutely obligatory for paramutation to occur since alleles with only one copy of the repeated sequence are non-paramutable. Although absolutely identical in what concerns the DNA sequence the repeats are differently methylated and show differences in sensitivity to DNaseI [17][20].
1.7- Rogue phenotype in Pisum sativum L
The occasional emergence of plants exhibiting a Rogue phenotype with pointed leaflets and leaf stipula among self-fertilized pea (Pisum sativum L.) lines(Fig. 3), and the extraordinary inheritance of these new traits, which not abide by the Mendelian
rules, were described for the first time in the early 20th century [21].
As for the other later described paramutation cases, the offspring of self-fertilised “rogue” (paramutated) plants consist only in “rogue”, and when crossed with wild types these plants produce uniquely F1 plants that as they develop turn into “rogues”. All plants in the following generations are also “rogue”.
15
1.8- Genes involved in DNA methylation, chromatin remodeling and paramutation Multiple genes have been identified involved in DNA methylation, chromatin remodelling and paramutation. Three out of these genes are ddm1, drm2 and mop1.The ddm1 gene is involved in DNA methylation particularly in small-RNA-directed DNA methylation (RdDM) mechanism. The product of this gene belongs to the family of Snf2 remodelers that allow other proteins to access the DNA by changing the nucleosome placement and composition. Recent studies showed that ddm1 is involved in the stable silencing of transposable elements by allowing DNA methyltransferases in collaboration with RdDM to interact with histone H1-containing heterochromatin [23].
The gene drm2 (domains rearranged methyltransferase 2) is associated with the maintenance of non-CG methylation and also with de novo DNA methylation. Mutations in drm2 can block all de novo DNA methylation associated with repeat containing transgenes. The drm2 function is associated to small RNAs since they are essential to maintain non-CG DNA methylation and site-directed mutagenesis tests have shown that the RNA-directed DNA methylation is dependent of both the ubiquitin-associated (UBA) and catalytic methyltransferase domains of drm2. [23][24].
The gene modifier of paramutation 1 (mop1) encodes an RNA-dependent RNA polymerase [25], which when mutated allow the low-expressing paramutagenic allele (B’) to express identically to the highly expressing paramutable allele (B-I), preventing the paramutation of a new B-I allele. These facts indicate that the expression of mop1 is generally necessary for paramutation, however mutations in this gene affect multiple loci modulated by different promoters evidencing that the product of this gene probably operates on chromatin configuration and not on specific sequences [26].
2- Materials and Methods
2.1- Plant material
Seeds of Pisum Sativum L. cv. Onward (Line JI2722) and its paramutant Onward “rogue” line JI2723 were quickly washed with tape water and Tween-20 and immediately immersed for 5 minutes in disinfecting solution containing 10% bleach and 0,5% SDS, rinsed with tape water and germinated over moisten paper in petri dishes for 72 hours, at 24°C in the dark. The originated seedlings were transplanted to pots containing 1:1 peat: vermiculite mixture inoculated with macerated Rhizobium nodules, and grown in a greenhouse.
16
2.2- RNA extraction
RNA was extracted from fully expanded young leaves using Ribozol™ RNA extraction reagent according to the manufacturer protocol. Briefly, leaves were ground in a mortar with a pestle in the presence of liquid nitrogen and the resulting fine powder was thoroughly mixed with 9 volumes of Ribozol™. After 5 min agitation the homogenate was centrifuged at 4500rpm for 20 minutes at 4ºC to remove insoluble material, the supernatant was transferred to a fresh tube and incubated at room temperature for 5 minutes. Then, 200uL of chloroform per 1 mL of Ribozol™ were added followed by an incubation of 3 minutes at room temperature. The sample was centrifuged at 4500rpm for 20 minutes at 4ºC, the upper aqueous phase was transferred to a RNase-free tube. The RNA was precipitated by adding three volumes of 100% ethanol and stored at -80ºC.
2.3- mRNA isolation
mRNA was isolated with the “PolyATtract® mRNA Isolation Systems IV” kit according to the protocol provided by the manufacturer. Total RNA was resuspended in 500 μl Rnase free water in two sterile RNase-free 1.5ml tubes one containing 290,624 µg of Onward and the other containing 393,024 µg of Rogue and heated at 65ºC for 10 minutes, 3 µl of biotinylated-oligo(dT) probe and 13μl of 20X SSC were added to the warm RNA solution and the samples were cooled down at room temperature. One tube of the Streptavidin Paramagnetic Particles (SA-PMPs) per isolation was resuspended by gently flicking the bottom of the tube until they were completely dispersed. The SA-PMPs were captured by placing the tube in the magnetic stand. The supernatant was carefully removed after 3 washes with 300μl 0.5X SSC, using the magnetic stand between washes, the SA-PMPs were resuspended in 100μl of 0.5X SSC. The hybridized RNA was then added to the tube and incubated at room temperature for 10 minutes and gently mixed by inversion every 1–2 minutes. The SA-PMPs were captured using the magnetic stand and the supernatant was carefully removed. The particles were washed four times with 300μl 0.1X SSC and resuspended in 100μl RNase-free water. The eluted mRNA was transferred to a sterile RNase-free tube and stored at -80ºC.
2.4- cDNA first strand
The cDNA first strand was synthesized using the “Thermo Scientific RevertAid First Strand cDNA Synthesis Kit”. The reaction was made in 20 µl reaction mixture consisting of 1x Reaction Buffer, 1 U of RiboLock RNase inhibitor, 1 mM of each
17 dNTP, 5 μM mix of RT primers (Table 1), 10 U of RevertAid M-MuLV RT and 230 ng of mRNA. The reaction was incubated in a thermocycler (VWR) at 42ºC for 1 hour and terminated by heating at 70ºC for 5 min and stored at -80ºC.
Table 1. Mix of reverse transcription (RT) primers with respective primer sequences where N represents any base
Primer name Sequence
RT primers
T12AN TTTTTTTTTTTTAN T12CN TTTTTTTTTTTTCN T12GN TTTTTTTTTTTTGN
2.5- Quantification of RNA, DNA and cDNA
All RNA and DNA samples were quantified using a Nanodrop 2000 eSpectrophotometer from Thermo scientific.
2.6- Multi-RAPD differential display analysis
Multi-RAPD differential display amplifications were performed using 109 different
combinations of four RAPD primers (Operon technologies)(Annex I), previously tested
for possible dimers (FastPCR version 4.0.27).
The PCR amplifications were performed in 15 µl reaction mixtures consisting of 1x Dream Taq Buffer (Fermentas), 0.16 mM of each dNTP, 0.5 μM of each primer, 0.6 U of Dream Taq DNA polymerase (Fermentas) and 15 ng of First Strand cDNA. The thermocycler (Biometra TGradient) was programmed as follows: 1 minute and 30 seconds initial denaturation cycle at 94ºC followed by 5 cycles of 30 sec at 94ºC, 30 sec at 36ºC, 1 min at 72ºC, and 30 cycles of 30 sec at 94ºC, 30 sec at 40ºC, 1 min at 72ºC, ending with an extension cycle of extension of 10 min at 72ºC. The amplification products were electrophoresed on 2% agarose gels. Gels were stained with ethidium bromide and photographed under UV trans-illumination with a digital camera "Kodak EDAS 120".
2.7- Low (25) cycles PCR and RT-qPCR amplifications
Twenty-four DNA sequences out of two large groups of sequences putatively differentially expressed in both epigenomes (cv. Onward and “rogue line JI2723) previously identified by the Laboratory (Santos and Leitão, unpublished results) via next generation sequencing of Suppression Subtractive Hybridization libraries, were
18 selected for further confirmation by low (25) cycles PCR and RT-qPCR. Primers were designed using the programme FastPCR (version 4.0.27) according to following requirements: no dimer formation, 17-21 base length, 50% - 60% GC content and ~50ºC melting temperature. All primers were ordered from NZYTech (Table 2).
Table 2 Primers for PCR and RT-qPCR amplifications of specific sequences
Name Sequence Ta° Name Sequence Ta
R_Seq 8 Fw TCTCCTTCATGGAGGTC
58 O_Seq 3 Fw ATGGAGCACCAAGATATG 56 R_Seq 8 Rv AACACGTCAAGGACTCT O_Seq 3 Rv AGATACAGAGATCAACCTC
R_Seq 11 Fw TGACAACTTGCCTATGG
55 O_Seq 5 Fw CAGCAGTGATAGCCATAG 58 R_Seq 11 Rv ACTGATAAGGGCATCTC O_Seq 5 Rv TGATTGAGAAGGCAACAC
R_Seq 12 Fw GAGTGGGACAGATTCAG
58 O_Seq 6 Fw TCATTCTCCAAGGTTGCTG 58 R_Seq 12 Rv TCAGCATCAATGTGACC O_Seq 6 Rv GGATACCTATCACCTAGAAC
R_Seq 13 Fw TCATGCGGAGGACTATC
58 O_Seq 7 Fw TTCTTCAGGTGTGCAAC 58 R_Seq 13 Rv CACCTTCCAAGCAAGG O_Seq 7 Rv TCCTGGTTGTCGATACTT
R_Seq 14 Fw TCCACAGCAATTCTGTG
55 O_Seq 8 Fw TGAATTGCACTCCATCTC 58 R_Seq 14 Rv AAGACATTCTCTGGCAAC O_Seq 8 Rv ATCCACTTTCTCCACTAC
R_Seq 15 Fw AGACACAACTTGGATCC
58 O_Seq 9 FW TCAGCTCCAATTCTCCA 58 R_Seq 15 Rv AATCGGTTGATCCTCAG O_Seq 9 Rv GCTTGCCAAATGGATC
R_Seq 16 Fw TCCTCTAACTCTTCAAGCA
58 O_Seq 10 Fw AGTTCCTCGTAATCAGTGT 58 R_Seq 16 Rv TATGACTGTGGAAATGGAAG O_Seq 10 Rv TTCTTGCATCTAGAGCTC
R_Seq 17 Fw CTGCTGTTGATGATATTG
58 O_Seq 11 Fw ACATCTTCAATAGTTCCAAC 54 R_Seq 17 Rv TTAGCCTTAGAAGAAGC O_Seq 11 Rv ATACACCACTGTTTATGTTG
R_Seq 18 Fw ACAACAGACGGTCATTG
58 O_Seq 12 Fw TTGGTTGAACAAGCTTC 58 R_Seq 18 Rv AATCGCTTCGGAAACTG O_Seq 12 Rv GTCTCAACAACCAGATC
R_Seq 19 Fw TCTGCCATCGAGATATCA
56 O_Seq 13 Fw TAAGGTTGACCGTGTG 58 R_Seq 19 Rv GTTCGCCTTTAACCAAG O_Seq 13 Rv TGGCTCCTGCATAATG
R_Seq 20 Fw AATGATAGACATGGCAGATG
58 O_Seq 14 Fw TTCTGGATTGTTTGAGGA 58 R_Seq 20 Rv AACAACCTGGCTTTGAG O_Seq 14 Rv TAACCAACTGAGCAACT
O_Seq 2 Fw ATCTGCATCTGATTGTG
56 O_Seq 15 Fw ATTCGAGAAGGTATAGCATG 58 O_Seq 2 Rv CTCTGAATTATCAACTACAGA O_Seq 15 Rv TAGTAGGCATGGTCAGA
Low (25) cycles and typical (35 cycles) PCR amplifications were performed and analyzed in agarose gels as above described.
2.8- Real-time PCR
Real-time PCR amplifications were performed in 15 µl reaction mixtures consisting
of 2x iQ™ SYBR® Green supermix, 0.5 μM of each primer, and different dilutions of
the First Strand cDNA. The reaction was performed in a iCycleriQ® Multicolor
Real-Time PCR Detection System using the following program: 5 minute of initial denaturation at 95ºC followed by 35 cycles of 10 sec at 95ºC, 30 sec at 56-58ºC
19 annealing temperature, where the data collection was enabled, followed by 1 cycle of 1 minute at 95ºC and um cycle of 1 minute at 55ºC ending with 80 cycles of 10 seconds starting with 55ºC where the setpoint temperature is increased by 0,5ºC after cycle 2 and the melt curve data collection and analysis becomes enabled.
2.9- Identification of homolog sequences of the ddm1, drm2 and mop1 genes in
Pisum sativum L.
Primers for amplification of the still unidentified homolog sequences of the ddm1, drm2 and mop1 genes in Pisum sativum L. (Table 3) were designed using as reference
the Medicago truncatula genome information (http://www.jcvi.org/medicago),
additional information previously obtained in the lab and the Pisum unigene database in
http://www.coolseasonfoodlegume.org.
The PCR amplifications were performed as above described except for the reaction volume that was scaled-up to 30 μL. Five microlitters of the amplification reactions were used for agarose gel analysis and in the cases where one single PCR product was obtained the remaining (25μL) amplification product was precipitated with 3 volumes of absolute ethanol and the dried pellet send for sequencing. In the cases were more than one band was amplified, the band with the expected length was excised from the gel, purified using the “Thermo Scientific GeneJET Gel Extraction Kit #K0692” and sent for sequencing.
Table 3 Primers for isolation of ddm1, drm2 and mop1 gene sequences in Pisum sativum
Primer name Primer sequense bp Annealing temperature (ºC) DDM1exp_F6 AAGAACAATGTGAAGAACGA 617 55 DDM1exp_R5 TCAGCAAGAATCCCATTC DDM1_F10 TGCCTTTACTAACTGGTGG 989 55 DDM1 exp R4 GCATTGCTCAATTATCTC DRM2exp_F9 TGGTTGATACAATTGGAGAG 600 55 DRM2exp_R6 GTGAGGAGTTAGGACCT MOP_FW1p TGAAGAAGCATATGATCATCAAC 407 55 MOP_Rv3p CAGACTTGATATGCAATAAAATGTC
2.10- Isolation and preparation of siRNA libraries for next generation sequencing To total RNA in RNase-free water (Pisum sativum, cv. Onward and its paramutant “rogue” line JI2723) ) were added 50% PEG (MW=8000) to a final concentration of 5%
20 and 5M NaCl to a final concentration of 0,5M for precipitation of the high molecular weight (HMW) RNA [27]. After centrifugation at 17000 rpm for 20 minutes at 4ºC and the supernatant containing the low molecular weight (LMW) RNA was precipitated overnight with tree volumes of ethanol 100%.
The LMW RNA was collected by centrifugation at 17000 rpm, for 30 minutes at 4ºC, and the pellet dissolved in 10µl DEPC-treated water. The ligation of 3’ RNA adaptor was carried out incubating for 1 hour at 37ºC in a reaction mix with 10 µl consisting of: 5 µl of LMW RNA solution previously denatured at 70ºC for 15 minutes, 2 µl of 3’ RNA adaptor from biomers.net (20µM stock concentration), 1 µl 10x RNA ligase buffer and 2µl T4 RNA ligase.
Three microliters of (100 µM) RT 3’- primer (Table 4) were added to the 3’ RNA adaptor ligated LMW RNA and the mix incubated at 75ºC for 5 minutes, followed by 37ºC for 15 minutes and 25ºC for 15 minutes. To this reaction mix were added 2 µl of (20µM) 5’ RNA adaptor denaturated at 70ºC for 15 minutes, 1 µl 10x RNA ligase buffer, 2µl T4 RNA ligase, and the ligation of the 5’ RNA adaptor was carried out for 1 hour at 37ºC. The resulting LMW RNA ligated to both adaptors and annealed to the RT primer was then used for first strand cDNA synthesis as above described.
The obtained cDNA was used for two different PCR amplifications using the 5’-primer (Table 4) and the above mentioned RT 3’-primer: i) 6 cycles of amplification for synthesis of cDNA second strand and low amplification of the ligated products, for further next generation sequencing; and ii) 35 cycles for amplification of and easily scored in 10% polyacrylamide/urea gel product. The amplifications were performed in 20 µl reaction mixtures consisting of 1x Phusion HF buffer (Thermo scientific), 0.16 mM of each dNTP, 15 μM of each primer, 0.4 U of Phusion DNA polymerase (Thermo scientific) and 1 µl of cDNA, in a thermocycler (Biometra Tgradient) programmed for: starting denaturation at 94ºC during 1 minute and 30 seconds followed by 6 or 35 cycles of 30 sec at 94ºC, 30 sec at 62ºC, 1 min at 72ºC and one cycle of 10 min at 72ºC.
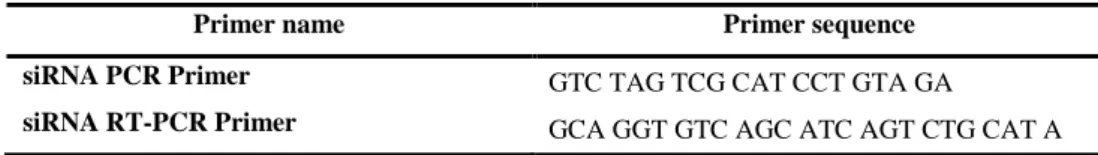
Table 4 Primers used in the siRNA isolation and amplification
Primer name Primer sequence
siRNA PCR Primer GTC TAG TCG CAT CCT GTA GA
21
3- Results and discussion
3.1- Extraction of total RNA and mRNA isolation.
The extraction of total RNA of Pisum sativum L. cv. Onward (Line JI2722) and Onward “rogue” (Line JI2723) was performed using the Ribozol™ RNA extraction reagent according to the manufacturer protocol. The extraction was performed using 9 ml of extraction reagent to which the fine powder resulting from leaves grounded in a mortar with a pestle in the presence of liquid nitrogen was added until the total volume reached 10 ml.
From 1 ml volume grounded leaf tissue powder of cv. Onward and Onwrd “rogue” line were isolated , respectively, 581,25 µg and 786,05 µg total RNA. The integrity of the extracted RNA from both epigenomes was confirmed by agarose gel electrophoresis the samples were mixed with an equal volume of formamide (Fig 4). The above amounts of total RNA resulted, respectively, in 400 ng of mRNA of cv. Onward and 720 ng mRNA of the “rogue” line, isolated using the “PolyATtract® mRNA Isolation Systems IV” kit. The mRNA of both epigenomes was used for the synthesis of single stranded cDNA which concentration was normalised between both samples and used for differential expression analysis.
22
3.2- Multi-RAPD differential display analysis
The differential display technique is commonly used for identification of expression polymorphisms between two or more organs or organisms using a short arbitrary primer in combination with an anchored oligo-dT primer.
In this work the technique was modified using a new approach which we have designated Multi-RAPD Differential Display (MRDD). The main difference in this technique is that the oligo-dT is omitted and the amplification process is performed using combinations of four RAPD primers in order to increase the odds of polymorphism identification. The PCR amplifications are carried out in two steps: i) a first step using an annealing temperature of 36 °C for 5 amplification cycles and ii) a second step of 30 cycles during which the annealing temperature was increased to 40 °C One hundred and nine combinations (Annex I) of 4 RAPD primers were used for identification of expression polymorphisms between cv. Onward (Line JI2722) and its paramutant “rogue” line (JI2723). Although, some very few putative polymorphisms were identified in a first round of analysis, they were not confirmed in a second round of analysis with other biological samples. Among the over 700 amplified expression markers no one was polymorphic. (Fig 5 and Fig 6).
Figure 5 Example of two combinations of Multi-RAPD differential display patterns that presented differences, but were proven to be false after repeating the tests with different biological samples. (O) cv. Onward; (R) “rogue” line JI2723.
23
Figure 6 Examples of Multi-RAPD differential display patterns that did not present differences. (O) cv. Onward; (R) “rogue” line JI2723 (M) Marker, Thermo scientific GeneRuler DNA Ladder Mix.
24
3.3- Expression analysis of SSH-selected sequences
Since no positive results were found using the multi-RAPD differential display analysis the search for differential expressed sequences between the two Pisum epigenomes was continued focusing on the confirmation of the differential expression of the expressed sequence tags (ESTs) identified via next generation sequencing of the contrasting Suppression Subtractive Hybridization (SSH) [28] libraries of cv. Onward and Onward “rogue” line JI2723 (Santo T and Leitão J, unpublished data).
The expression analysis was performed in a two steps approach, which validation was simultaneously a goal of the present work. The first step consisted in the comparison of the products of a lower-cycle PCR amplification (25 cycles) of single strand cDNA libraries of both epigenomes, while a typical PCR amplification (35 cycles) was used as control for PCR efficiency, the second step consisted in conventional RT-qPCR analysis. The rational of such approach is the first step of analysis to be used as preliminary selection before confirmation by much more accurate RT-qPCR analysis. A previous, and easy to perform, pre-selection can speed up and increase the efficiency of all procedure when large amounts of expressed sequences require further RT-qPCR confirmation.
The next generation sequencing (Ion Torrent) of the cDNA-SSH libraries,
resulted, respectively in 1337 contigs amplified from cv. Onward and 1282 contigs
amplified from the “rogue” line JI2723. Among these contigs, 67 from the cv. Onward library and 60 from the “rogue” line library, exhibiting a redundancy equal or over 500 sequences in one of the epigenomes and being almost not present (less than 10 sequences) in the second epigenome, were selected for further RT-qPCR analysis (Annex II and Annex III).
In this work was performed the expression analysis of 24 of these sequences (Table 5 and 6).
Forty-eight primers were designed for amplification of short fragments (95 to 120 bp) within the analysed contigs and their optimal annealing temperatures were previously established (Table 7).
25 Table 5 Selected expressed sequences more abundant in the “rogue” line JI2723
Sequence name Pea Contig Onward vs Rogue Rogue vs Onward SSHR8 ID|Pisum_sativum_v2_Contig4568 0 1304 SSHR11 ID|Pisum_sativum_v2_Contig4871 0 1078 SSHR12 ID|Pisum_sativum_v2_Contig7001 4 1528 SSHR13 ID289409|p.sativum_wa1_contig24155 5 1157 SSRH14 ID|Pisum_sativum_v2_Contig4379 0 1039 SSHR15 ID|Pisum_sativum_v2_Contig8616 0 866 SSHR16 ID|Pisum_sativum_v2_Contig7306 3 889 SSHR17 ID|Pisum_sativum_v2_Contig5993 0 829 SSHR18 ID|Pisum_sativum_v2_Contig4801 0 807 SSHR19 ID|Pisum_sativum_v2_Contig5242 0 785 SSHR20 ID287628|p.sativum_wa1_contig23351 0 775
Table 6 Selected expressed sequences more abundant in cv, Onward
Sequence name Pea Contig Onward vs Rogue Rogue vs Onward SSHO2 ID281115|p.sativum_wa1_contig19650 1666 1 SSHO3 ID|Pisum_sativum_v2_Contig4380 1627 0 SSHO5 ID|Pisum_sativum_v2_Contig4909 1624 0 SSHO6 ID|Pisum_sativum_v2_Contig5891 1427 1 SSHO7 ID|Pisum_sativum_v2_Contig1549 1323 2 SSHO8 ID|Pisum_sativum_v2_Contig4284 1135 0 SSHO9 ID|Pisum_sativum_v2_Contig5916 1137 0 SSHO10 ID61637|Pisum_sativum_v1_Contig2226 1021 0 SSHO11 ID|Pisum_sativum_v2_Contig2333 1579 1 SSHO12 ID266692|p.sativum_wa1_contig30745 966 0 SSHO13 ID|Pisum_sativum_v2_Contig7337 1041 1 SSHO14 ID286784|p.sativum_wa1_contig06779 959 0 SSHO15 ID291839|p.sativum_wa1_contig18536 869 0
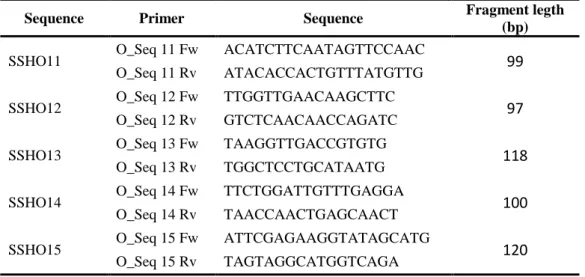
26 Table 7 Forward and reverse primers for amplification of pea conting fragments of interest.
Sequence Primer e Sequence Fragment legth (bp) SSHR8 R_Seq 8 Fw TCTCCTTCATGGAGGTC 112 R_Seq 8 Rv AACACGTCAAGGACTCT SSHR11 R_Seq 11 Fw TGACAACTTGCCTATGG 103 R_Seq 11 Rv ACTGATAAGGGCATCTC SSHR12 R_Seq 12 Fw GAGTGGGACAGATTCAG 101 R_Seq 12 Rv TCAGCATCAATGTGACC SSHR13 R_Seq 13 Fw TCATGCGGAGGACTATC 108 R_Seq 13 Rv CACCTTCCAAGCAAGG SSHR14 R_Seq 14 Fw TCCACAGCAATTCTGTG 107 R_Seq 14 Rv AAGACATTCTCTGGCAAC SSHR15 R_Seq 15 Fw AGACACAACTTGGATCC 117 R_Seq 15 Rv AATCGGTTGATCCTCAG SSHR16 R_Seq 16 Fw TCCTCTAACTCTTCAAGCA 95 R_Seq 16 Rv TATGACTGTGGAAATGGAAG SSHR17 R_Seq 17 Fw CTGCTGTTGATGATATTG 108 R_Seq 17 Rv TTAGCCTTAGAAGAAGC SSHR18 R_Seq 18 Fw ACAACAGACGGTCATTG 106 R_Seq 18 Rv AATCGCTTCGGAAACTG SSHR19 R_Seq 19 Fw TCTGCCATCGAGATATCA 105 R_Seq 19 Rv GTTCGCCTTTAACCAAG SSHR20 R_Seq 20 Fw AATGATAGACATGGCAGATG 107 R_Seq 20 Rv AACAACCTGGCTTTGAG
SSHO2 O_Seq 2 Fw ATCTGCATCTGATTGTG 114
O_Seq 2 Rv CTCTGAATTATCAACTACAGA
SSHO3 O_Seq 3 Fw ATGGAGCACCAAGATATG 112 O_Seq 3 Rv AGATACAGAGATCAACCTC
SSHO5 O_Seq 5 Fw CAGCAGTGATAGCCATAG 120
O_Seq 5 Rv TGATTGAGAAGGCAACAC
SSHO6 O_Seq 6 Fw TCATTCTCCAAGGTTGCTG 100
O_Seq 6 Rv GGATACCTATCACCTAGAAC
SSHO7 O_Seq 7 Fw TTCTTCAGGTGTGCAAC 103
O_Seq 7 Rv TCCTGGTTGTCGATACTT
SSHO8 O_Seq 8 Fw TGAATTGCACTCCATCTC 104
O_Seq 8 Rv ATCCACTTTCTCCACTAC
SSHO9 O_Seq 9 FW TCAGCTCCAATTCTCCA 113
O_Seq 9 Rv GCTTGCCAAATGGATC
SSHO10 O_Seq 10 Fw AGTTCCTCGTAATCAGTGT 112
27 Five out of the 24-SSH selected sequences have not showed visible and analysable PCR products after 25 cycles of PCR amplification (Table 8). In the remaining products of 25 cycles of PCR amplification 11 sequences have not showed differences for cDNA of cv. Onward and Onward “rogue” and the other 8 sequences have showed differences between the amplification products obtained from cDNA of cv. Onward and Onward “rogue” (Fig. 7 and Fig. 8, Table 8). The genes for Tubulin 2 and Polyubiquitin were used as controls in RT-qPCR and showed very balanced products of 25 and 35 cycles PCR amplification (Fig. 9).
Table 7 Forward and reverse primers for amplification of pea conting fragments of interest. (cont.)
Sequence Primer Sequence Fragment legth (bp) SSHO11 O_Seq 11 Fw ACATCTTCAATAGTTCCAAC 99
O_Seq 11 Rv ATACACCACTGTTTATGTTG
SSHO12 O_Seq 12 Fw TTGGTTGAACAAGCTTC 97
O_Seq 12 Rv GTCTCAACAACCAGATC
SSHO13 O_Seq 13 Fw TAAGGTTGACCGTGTG 118
O_Seq 13 Rv TGGCTCCTGCATAATG
SSHO14 O_Seq 14 Fw TTCTGGATTGTTTGAGGA 100 O_Seq 14 Rv TAACCAACTGAGCAACT
SSHO15 O_Seq 15 Fw ATTCGAGAAGGTATAGCATG 120
O_Seq 15 Rv TAGTAGGCATGGTCAGA
Figure 7 Preliminary PCR amplification for 35 and 25 cycles. No significant differences are noticeable between sampes (O and R) either amplified for 35 or 25 cycles. (O) - cv. Onward; (R) “Rogue” line.
28
Figure 8 Some sequences exhibited differences in the products of 25 cycles PCR amplification. The differential expression of these sequences was later confirmed by RT-qPCR analysis.
Figure 9 The Tubulin 2 and polyubiquitin genes used as control in RT-qPCR analyses showed similar results in cv. Onward (O) and Onward “rogue” line (R) after 35 or 25 cycles of PCR amplification.
29 The comparison between the results of RT-qPCR analysis and 25 cycle PCR amplification have showed that the risk of not selecting as priority for RT-qPCR sequences with highly significant differences in expression is apparently low.
All the sequences that exhibited differences in amplification after 25 cycles PCR have also showed significant differences in expression as assessed by RT-qPCR, whereas all the sequences that have not exhibited clear differences in the previous low-
-cycle PCR have not showed significant differences in RT-qPCR. In one case one sample apparently showed differences after 25 cycles PCR, which were not confirmed Table 8 Results of 25 cycles PCR and RT-qPCR analysis.
Sequence Differences after
25 cycles PCR ΔCt ΔΔCt Validation 25 cycles PCR vs. RT-qPCR Annealing Temperature (ºC) SSHR8 No -0,23 0,5 Confirmed SSHR11 - - - - SSHR12 No -1,43 -0,7 Confirmed SSHR13 No -0,8 -0,067 Confirmed SSHR14 - - - - SSHR15 No -1,33 -0,6 Confirmed SSHR16 No 0,2 0,93 Confirmed SSHR17 No -0,63 0,1 Confirmed SSHR18 Yes -3,1 -2,65 Confirmed 58 SSHR19 Yes 2,03 1,83 Confirmed 56 SSHR20 No 1,25 1,7 Confirmed SSHO2 - 2,8 2,6 - SSHO3 No -0,67 -0,87 Confirmed
SSHO5 Yes -0,1 0,35 Negative 58 SSHO6 - -2,5 -2,05 -
SSHO7 No -1,5 -1,05 Confirmed
SSHO8 Yes -2,75 -2,3 Confirmed 58 SSHO9 No -0,37 0,37 Confirmed
SSHO10 Yes -2,25 -1,8 Confirmed 58
SSHO11 - - - -
SSHO12 Yes -5,1 -4,65 Confirmed 58 SSHO13 Yes -3,65 -3,2 Confirmed 58 SSHO14 No -0,8 -0,067 Confirmed
30 by RT-qPCR. The pre-selection by low-cycle PCR can have a positive role when the RT-qPCR analysis is intended to be used for large amounts of sequences.
The analysis and discussion of the identified differences in gene expression between cv. Onward and Onward “rogue” line JI2723, in particular those showing highly significant differences (ΔΔCt ≥ 2,0) is out of the scope of the present work and will be performed after additional results are obtained. Nevertheless, the first positive results on differential expression (which need further confirmation in at least two additional samples) are displayed in Table 9.
Table 9 Protein analyses the translation of fragments with differences in RT-qPCR
Sequence ΔΔCt Translated protein Expect Identify (%) SSHR18 -2,65 Polyamine oxidase [Medicago truncatula]
Sequence ID: ref|XP_003600621.1|Length: 492 0,0 95 SSHR19 1,83 Glycogen synthase kinase [Medicago truncatula]
Sequence ID: ref|XP_003591238.1|Length: 411 0,0 97 SSHR20 1,7 Fructosamine kinase [Medicago truncatula]
Sequence ID: gb|KEH18974.1|Length: 319 0,0 92 SSHO2 2,6 BEL1-related homeotic protein [Medicago truncatula]
Sequence ID: gb|KEH41936.1 |Length: 649 0,0 90 SSHO6 -2,05
Glucose 6 phosphate/phosphate translocator-like protein [Medicago truncatula]
Sequence ID: ref|XP_003594481.1|Length: 408
0,0 90
SSHO7 -1,05
Serine/threonine protein kinase ICK [Medicago truncatula]
Sequence ID: ref|XP_003612616.1|Length: 449
0,0 90 SSHO8 -2,3 This contig does not translate in a viable protein - - SSHO10 -1,8 Sucrose-phosphate synthase [Medicago truncatula]
Sequence ID: ref|XP_003617418.1|Length: 1058 1e-106 88 SSHO12 -4,65
PREDICTED: SPX domain-containing protein 2-like [Glycine max]
Sequence ID: ref|XP_003549761.1|Length: 295
2e-114 69
SSHO13 -3,2
Soluble inorganic pyrophosphatase [Medicago truncatula]
Sequence ID: gb|KEH42358.1|Length: 248
2e-155 96
SSHO15 -1,1 DNA-directed RNA polymerase [Medicago truncatula]
31
3.4- On the way to the expression analysis of genes, involved in DNA methylation and chromatin remodeling: met1, ddm1, drm2 and mop1.
Recent studies developed in the laboratory of Genomics and Genetic Improvement, in the Universidade do Algarve using the method Methylation Sensitive - Amplified Fragment Length Polymorphisms (MS-AFLP) have identified a set of specific sequences that are differentially methylated in leaf DNA of cv. Onward and Onward “rogue” line JI2723. Some of the differential methylation patterns were even inherited through meiosis to pollen DNA (Santo and Leitão, unpublished results).
This finding raised interrogations regarding the expression of the genes involved in DNA-methylation in the emergence and maintenance of the “rogue” paramutation in pea (Pisum sativum L.). Tree genes: ddm1; drm2 and mop1, were elected for further expression analysis.
However, no homologs of these three genes have been identified so far in this legume species, for which genomic data are still relatively meager. In order to retrieve in Pisum the sequence of these three genes, the genomic information on the legume
model plant Medicago truncatula (http://www.jcvi.org/medicago) was used as reference
for sequence analysis and primer design.
Amplifications of selected partial sequences of the ddm1, drm2 and mop1 were performed using the primers designed based on the homolog Medicago truncatula sequences (Table 3). The amplification products were analyzed in agarose gels. When the amplification resulted in more than one amplification product the fragment of the right size was cut from the gel, purified and sent for Sanger sequencing. In the cases of a single product of right size, the fragment was ethanol precipitated directly in the PCR reaction mix and sent for sequencing.
The sequences and the putative protein products were blasted against the Gen
Bank database (http://blast.ncbi.nlm.nih.gov/Blast.cgi).
ddm1
The amplification of two sequences of ddm1(Fig. 10) was performed using the primers displayed in Table 10, which were also used as sequencing primers.
32
The nucleotide sequence of the PCR products and the respectively coded amino acid sequences were blasted against the GenBank database (www.ncbi.nlm.nih.gov) which confirmed that both sequences are similar to Swi2/Snf2-related chromatin remodeling ATPase (Medicago truncatula) (BOXES 1 and 2)
Table10 Primers for ddm1 amplification and sequencing
Primer name Primer sequense bp Annealing temperature (ºC)
DDM1exp_F6 AAGAACAATGTGAAGAACGA 617 55 DDM1exp_R5 TCAGCAAGAATCCCATTC DDM1_F10 TGCCTTTACTAACTGGTGG 989 55 DDM1 exp R4 GCATTGCTCAATTATCTC
Figure 10 PCR amplification of two ddm1fragments in Pisum sativum. : 1) Product of amplification using the primers DDM1exp_F6 and DDM1exp_R5; 2) Product of amplification using the primers DDM1_F10 and DDM1 exp R4.
33
drm2
Using the primers in Table 11 a fragment was amplified from cv. Onward (Fig. 11) which nucleotide sequence and putative protein product showed the highest similarity with the drm1/drm2 genes of two other legume species Cicer arietinum and Medicago trucatula (BOX3).
Table 11 Primers for drm2 amplification and sequencing.
Primer name Primer sequense bp Annealing temperature (ºC)
DRM2exp_F9 TGGTTGATACAATTGGAGAG 600 55 DRM2exp_R6 GTGAGGAGTTAGGACCT BOX1 Psddm1 sequence 1 TAAGAACAATGTGAAGAACGATGATCCTGCAGTAGAGTCACCAACTTCGGTCCTAGAAGAAGAGGAAATGGAGGTTAAG TTGGAGGAAGAGGTGGTTGCAGATGATGGATCTTCTCTTGTACCGAAATTGATGGTAGAGGAGGAAGAGAAGTTGCTTA AAGCTCTTGCTAAGGAAGAGGAGGAACAGTTTCAGGAGGCGCCAAATCTCAATGACTCGCAGTTTGATAAGTTGGATGA GCTTTTAACGCAAACGAAACTGTACTCGGAGTTTCTTCTGGAGAAAATGGATGACATCACATTGACTGCGGGTGAACAA GAGATTAAGGAAGAGGAAGAGACTCAGTTGGATACTAAACCTAAGGGTCGTGGAAGAAAAAGAAAGGCGGCTAAACAAT GCAATACTGGGAAAGCCAAAAAGGCAGTTGAAGCTATGATAACAAGATCTAAAGAAACTGTGAAGACTGAAGATGTGAA TTTGAGTGAGGAAGAAAGAACTGAGAAAGAGCAGAGGGAGTTGGTGCCTTTACTAACTGGTGGAAAATTGAAGTCTTAT CAACTGAAGGGTGTAAAATGGTTAATCTCCTTGTGGCAAAATGGACTGAATGGGATTCTTGCTGAA
Swi2/Snf2-related chromatin remodeling ATPase[Medicago truncatula)
XP_003611980.1 Identity: 173/206(84%) Positives: 186/206(90%) Gaps: 0/206(0%)
Query 1 KNNVKNDDPAVESPTSVLEEEEMEVKLEEEVVADDGSSLVPKLMVEEEEKLLKALAKEEE 60 KNNVKNDDP ESPTSVLEEEE+EVK EEEV+ADDGSSLVPK M EEEEKLLK KEEE Sbjct 4 KNNVKNDDPPAESPTSVLEEEEVEVKSEEEVIADDGSSLVPKTMAEEEEKLLKVRVKEEE 63 Query 61 EQFQEAPNLNDSQFDKLDELLTQTKLYSEFLLEKMDDITLTAGEQEIKEEEETQLDTKPK 120 E+ + APNLNDSQF+KLDELLTQTKLYSEFLLEKMDDIT+ AGEQE +EEE++ K K Sbjct 64 EKIEVAPNLNDSQFNKLDELLTQTKLYSEFLLEKMDDITMAAGEQEKPDEEESKPVAKKK 123 Query 121 GRGRKRKAAKQCNTGKAKKAVEAMITRSKETVKTEDVNLSEEERTEKEQRELVPLLTGGK 180 GRG KRKAA QCNTGKAKKAVEAMITRSKE VKTEDV+L+EEERTEKEQREL+PLLTGGK Sbjct 124 GRGSKRKAASQCNTGKAKKAVEAMITRSKENVKTEDVDLTEEERTEKEQRELMPLLTGGK 183 Query 181 LKSYQLKGVKWLISLWQNGLNGILAE 206
LKSYQLKGVKWLISLWQNGLNGILA+ Sbjct 184 LKSYQLKGVKWLISLWQNGLNGILAD 209
34 BOX 2 Psddm1 sequence 2 AAATGGTTAATTTCCTTGTGGCAAAATGGACTGAATGGGATTCTTGCTGATCAAATGGGTCTTGGGAAGACAATCCAGAC AATTGGGCTTCTTTTTCATTTTAAATCAAAAGGATTGGATGGGCCATATATGATAATTGCTCCACTATCAACCCTATCCA ACTGGATGAATGAGATATTTAGGTTTGCACCATCACTCCCTGCTGTTATCTACCACGGTAATAAAGATGAGAGAAATGAG ATCAGAAGGAAACATATGCCTAGCACAATTGGTCCAAAATTTCCCATAGTAATAACTTcTTATGAGATTGCAATGAATGA TGCTAAGAAATTTTTCCGGGCATACCAATGGAAATATCTTGTTGTTGATGAGGGTCACAGGcTAAAAAATTCACAATGCA AATTAGTGACCATGTTGAAATTCATCAGAGTTGAAAATAAGCTTCTTTTGACTGGGACACCGCTCCAGAATAACTTAGCA GAGCTGTGGTCATTGCTGAACTTCATCTTACCTGATATATTcTCATCTCTTGAAGAATTTGAGTCATGGTTTAATCTGTC AGGAAAGTGTGCTTCTGGAGCAaCAATGGAAGAAATGGAAGAGAAAAGAAGAAACCAGGTAGTGGCCAAGCTTCATGCAA TTCTCAGACCATTTCTTTTGCGCCGAATGAAGTCTGATGTTGAGCTATCATTGCCCCGGAAAAAAGAGATCATTATTTAT GCTAACATGACTGAGCATCAGAAGAACTTGCAGGATCATcTAGTTAATGCGaCATTCGAGAAACATTTGGACAGGAAACT AACAATTGGGCGTGCTGCGGCGAGTATTAATAACTTGGTAATTCAACTTAGGAAAGTCTGTAACCATCCCGACCTCTTAG AATCACCCTATGATGGTTCATATTTTTATCCCTCCTTTGAATG
Swi2/Snf2-related chromatin remodeling ATPase [Medicago truncatula] XP_003611980.1
Identities: 262/304(86%) Positives: 280/304(92%) Gaps: 0/304(0%)
Query 1 KWLISLWQNGLNGILADQMGLGKTIQTIGLLFHFKSKGLDGPYMIIAPLSTLSNWMNEIF 60 KWLISLWQNGLNGILADQMGLGKTIQTIG L H KSKGLDGPYMIIAPLSTLSNWMNEI Sbjct 193 KWLISLWQNGLNGILADQMGLGKTIQTIGFLSHLKSKGLDGPYMIIAPLSTLSNWMNEIN 252 Query 61 RFAPSLPAVIYHGNKDERNEIRRKHMPSTIGPKFPIVITSYEIAMNDAKKFFRAYQWKYL 120 RF P+LPAVIYHGNK +R+EIRRKHMP T+GPKFP+VITSYEIAMNDAKK R+Y WKYL Sbjct 253 RFTPTLPAVIYHGNKHQRDEIRRKHMPRTVGPKFPLVITSYEIAMNDAKKCLRSYSWKYL 312 Query 121 VVDEGHRLKNSQCKLVTMLKFIRVENKLLLTGTPLQNNLAELWSLLNFILPDIFSSLEEF 180 VDEGHRLKN+ CKLV MLK+I VENKLLLTGTPLQNNLAELWSLL+FILPDIFSSLEEF Sbjct 313 AVDEGHRLKNANCKLVRMLKYISVENKLLLTGTPLQNNLAELWSLLHFILPDIFSSLEEF 372 Query 181 ESWFNLSGKCASGATMEEMEEKRRNQVVAKLHAILRPFLLRRMKSDVELSLPRKKEIIIY 240 ESWFNLSGKC +GATMEE+EEKRR QVVAKLH+ILRPFLLRRMKSDVEL LPRKKEIIIY Sbjct 373 ESWFNLSGKCTTGATMEELEEKRRTQVVAKLHSILRPFLLRRMKSDVELMLPRKKEIIIY 432 Query 241 ANMTEHQKNLQDHLVNATFEKHLDRKLTIGRAAASINNLVIQLRKVCNHPDLLESPYDGS 300 ANMTEHQKNLQDHL+N T K+LD+K +IGRA S+NNLVIQLRKVCNHPDLLES +DGS Sbjct 433 ANMTEHQKNLQDHLINETLGKYLDKKRSIGRAPTSLNNLVIQLRKVCNHPDLLESVFDGS 492 Query 301 YFYP 304
35 BOX 3 Psdrm2 sequence 1 TTGGTTGATACAATTGGAGAGGAAGTTCACACGTCGTCCATTTTCGTGgAGCCCGAAGATTCGTCCTTTGCGAAATTGGG AGACAAAATGAGTGATGATTCTGGTCTAGGGAGTGGAGGTTATGATTGGAATACTGAAGATGAGCTTGAGATTGAAAGCT TTCATTCTTCCTGTACAACTGTTCCCTATGGACAGACTTCTGGGTCTCGGTCTCTAGAGGAAAACTCATTTGCAGCAGGT CCATCTAATACCAAGGTGTTTGACTCTCTCATTAATATGGGATTTCATCCTGAAATGGTTGCCAAAGTAATTCAGGAATA TGGTGAGGAAAATGAACATAAACTAGTTGAAGAGCTTCTCACATATCAAGAGCTAGAAAGGTCTTCTCAGCAGCAACAGC AAGTTGAACCAGATCCCACCTCTTCAGAGTATGCAGCGAGCTCCTGGGATGATTCATCAGACAACGATGATTCATCGGAT GAAGAAATACCAAAATCCCTTTCTAAGAATGATAATACATTACTATCCCTGGTAAAAATGGGATTCAATGAGGAGGAGGC TTTAATGGCGTTAGAAAGATTAGGTCCTAACTCCTCA
DNA (cytosine-5)-methyltransferase DRM1/2 [Medicago truncatula] AES94878.2 Identities: 119/170(70%) Positives: 138/170(81%) Gaps: 1/170(0%)
Query 30 MSDDSGLGSGGYDWNTEDELEIESFHSSCTTVPYGQTSGSRSLEENSFAAGPSNTKVFDS 89 M DDS L S +DWNT+DELEIESF+S +TVP QT + S+E +SFA GPSNTKV D Sbjct 1 MGDDSSLESDNFDWNTDDELEIESFNSLSSTVPSRQTITAASVEASSFA-GPSNTKVLDH 59 Query 90 LINMGFHPEMVAKVIQEYGEENEHKLVEELLTYQELERSSQQQQQVEPDPTSSEYAASSW 149 I+MGF E+V+KVIQEYGEE+E KL+EE+LTY LE SSQQ QQVEPDPTSSEYA SSW Sbjct 60 FISMGFPGEVVSKVIQEYGEEDEDKLLEEILTYSALESSSQQHQQVEPDPTSSEYAGSSW 119 Query 150 DDSSDNDDSSDEEIPKSLSKNDNTLLSLVKMGFNEEEALMALERLGPNSS 199
DD SD D SDEE+PKS+S+ND+TLLSLV MGF EEEALMA+ERLG +SS Sbjct 120 DDLSDGDSFSDEEMPKSVSRNDDTLLSLVNMGFKEEEALMAIERLGLDSS 169
Figure 11 PCR amplification of a cDNA fragment of Pisum sativum using the primers DRM2exp_F9 and DRM2exp_R6.
36
mop1
A piece of the mop1 sequence in Psium sativum was amplified using the primers displayed in Table 12. The amplification product had the expected size (Fig. 12) and, after precipitation, was sent directly for sequencing. The blastn and blastp against the
GenBank database (www.ncbi.nlm.nih.gov) confirmed that the amplified sequence is
related to an RNA-dependent RNA polymerase 2-like sequence in chickpeas (Cicer arietinum) similar to the mop1 gene involved in the paramutation of the locus b1 in Zea mays (BOX 4).
Table 12 Primers for amplification and sequencing of mop1 homolog sequence in Pisum sativum.
Primer name Primer sequense bp Annealing temperature (ºC)
MOP_FW1p TGAAGAAGCATATGATCATCAAC
407 55
MOP_Rv3p CAGACTTGATATGCAATAAAATGTC
Figure 12 PCR amplification of a putative mop1fragment in Pisum sativum. Product of amplification using the primers MOP_FW1and MOP_Rv3p.
37
3.5 siRNA isolation
The isolation of siRNA from total RNA was performed using a first step of PEG
and NaCl precipitation of the high molecular weight (HMW) RNA. The low molecular weight fraction showed to harbour RNAs of the expected siRNA length (19-24bp) (Figure 13) which were excised and purified from the polyacrylamide gel for adapter ligation. BOX 4 Psmop1 sequence: TTGAAGAAGCATATGATCATCAACTTGAGGTTAATGGTTTTGAGGTCTTTCTTGAGACTGCCTCAAGTCACAGAGAAATGT ATGCACAGAAGATGAGCTCTTTAATGAGCTTCTATGGAGCAGAGACCGAGGATGAAATGCTAACAGGTAACTTGCTAAAAC GTGCTTCTTATTTGCAGCGCGATAACAGGAGATATGGAGATATGAAGGATCGAATTCTGATATCGGTGAAGGATCTTCAAC ATGAAGCTAAAGGATGGTTTGAAAGTGATTGTCAGCCAGATGAATATCAACTTATGGCATCTGCATGGTATCATGTGACCT ATCATCCCAAATATTACCACGAAAGCTCCACCTTTTTAAGCTTCCCATGGATCGTTGGTGACATTTTATTGCATATCAAGT CTGA
PREDICTED: RNA-dependent RNA polymerase 2-like [Cicer arietinum] XP_004508850.1 Identities: 126/135(93%) Positives: 127/135(94%) Gaps: 0/135(0%)
Query 1 EEAYDHQLEVNGFEVFLETASSHREMYAQKMSSLMSFYGAETEDEMLTGNLLKRASYLQR 60 EEAYDHQLEVNGFE FLETASSH+EMYAQKMSSLMSFY AETEDEMLTGNL RASYLQR Sbjct 981 EEAYDHQLEVNGFEAFLETASSHKEMYAQKMSSLMSFYDAETEDEMLTGNLQNRASYLQR 1040 Query 61 DNRRYGDMKDRILISVKDLQHEAKGWFESDCQPDEYQLMASAWYHVTYHPKYYHESSTFL 120 DNRRYGDMKDRILISVKDLQ EAK WFESDCQP EYQLMASAWYHVTYHPKY HESSTFL Sbjct 1041 DNRRYGDMKDRILISVKDLQREAKEWFESDCQPHEYQLMASAWYHVTYHPKYSHESSTFL 1100 Query 121 SFPWIVGDILLHIKS 135
SFPWIVGDILLHIKS Sbjct 1101 SFPWIVGDILLHIKS 1115
Figure 13 Separation in polyacrylamide/urea gel of LMW RNA. Notice the RNA signal with the expected size of siRNA .
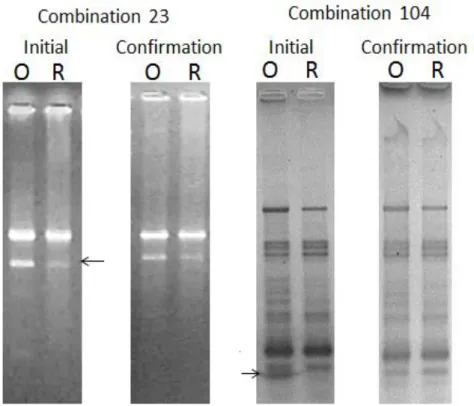
38 After the ligation of the adapters, with 26 nucleotides each, the obtained cDNA was expected to be in the 71 to 76 bp range. However, the PCR amplification using primers complementary to the adapter sequences resulted in a strong band of approximately 50 bp, most probably resulting from the amplification of ligated adapters, and stronger signal in the 75 bp and150 bp size (Fig. 14). The fraction of these two gel regions were excised (Fig.15) and purified, after 6 cycles of PCR amplification, for a further analysis and utilization.
Figure 14 PCR amplification of small RNAs derived cDNA (O) cv. Onward; (R) “rogue” line JI2723; (M) Marker - Thermo scientific GeneRuler Ultra Low Range DNA Ladder.
Figure 15 Excision of the 75 bp and 150 bp cDNAs after 6 cycles PCR amplification (O) cv. Onward; (R) “rogue” line JI2723; (M) Marker - Thermo scientific GeneRuler Ultra Low Range DNA Ladder
39
4- Discussion and future prospects
The study of “rogue” phenotype in pea was almost completely abandoned for approximately nine decades since the studies on the inheritance of this phenotype were carried out by Bateson and Pellew [21][22] and, immediately after, by Brotherton [29] in the early XX century. The study of this Pisum paramutation was later complemented with the observation of the lack of differences between the chromosomes of “rogue” and “non-rogue” plants [30], and that the reduced size of the leaves in “rogue” plants was caused by lower number of cells and not by differences in their size [31].
Recently, the research on this paramutation was resumed at the Laboratory of Genomics and Genetic Improvement, FCT, Universidade do Algarve, where was found that in a background of a similar level of genome wide methylation in leaf DNA, some specific genomic sequences exhibited altered methylation patterns in paramutated plants. In some cases the specific patterns were even inherited through meiosis to pollen DNA. Moreover, a non-rogue mutant line was induced from a Rogue pea cultivar, which evidenced the existence of specific genes which function is required for the Rogue paramutation process (Santo and Leitão, unpublished results).
The next generation sequencing of two SSH libraries, respectively from cv. Onward and paramutated Onward rogue line JI2723, resulted in over one thousand cDNA sequences showing significant differences in their redundancy, a consequence of differences in number of the respective mRNA molecules, between both epigenomes.
The present study aimed to identify differences in gene expression between the two epigenomes. The work was initiated with the multi-RAPD differential display analysis of cDNA libraries, however, in spite of the use of combinations of over 400 primers, no expression polymorphisms have been identified. Then, it was decided to search for differences in gene expression analysing and confirming by RT-qPCR the putative differential expression of sequences previously identified using a SSH approach.
Twenty-four sequences were selected for this study and 11 out of them showed to be differentially expressed. Eight of these last sequences exhibited a ΔΔCt ≥ 2, assumed to be a highly significant value. These sequences may be associated with molecular mechanisms related with the paramutation. Nevertheless, they need to be confirmed using additional biological samples, which in these experiments consist on cDNA synthesized from the mRNA of three plants of each epigenome. During this
40 study a method was tested and validated for pre-selection of the sequences for further RT-qPCR assay, based on the comparative results of 25 cycles PCR.
As it was found that paramutated plants exhibited differences in DNA methylation the next logical step regarding this aspect of the paramutation was to assess the expression of genes related with DNA methylation and chromatin remodelling. The retrieving of expressed tags of the genes ddm1,drm2 and mop1 in Pisum sativum has created the conditions for the study of the expression of these genes in the two contrasting epigenomes.
The comparative analyses of siRNA libraries, still in construction for next generation (ion torrent) sequencing, is expected to provide some clues regarding the modulating mechanisms involved in the establishment of the Rogue paramutation.
Besides the study of the siRNAs, particularly aiming to identify different classes of these ncRNAs in both epigenomes, from the above results it can be concluded that the future research should focus on the screening of the sequences identified by SSH analyses, which initial study was very promising and eventually leading to the identification of metabolic pathways involved in the paramutation process.

![Figure 2 Heterozygote mouse, genotype and phenotype (adapted from [19])](https://thumb-eu.123doks.com/thumbv2/123dok_br/18588418.908546/13.892.331.543.364.716/figure-heterozygote-mouse-genotype-phenotype-adapted.webp)