TEMAS LIVRES FREE THEMES
Activity limitation in elderly people in the European context
of gender inequality: a multilevel approach
Limitação de atividade em idosos no contexto Europeu
de desigualdade de gênero: uma abordagem multinível
André Luiz Barbosa de Lima 1 Albert Espelt 2
Kenio Costa de Lima 1 Marina Bosque-Prous 2
1 Programa de
Pós-Graduação em Saúde Coletiva, Universidade Federal do Rio Grande do Norte. Av. Hermes da Fonseca s/n, Lagoa Nova. 59084-100 Natal RN Brasil. [email protected]
2 Faculty of Health Sciences,
Open University of Catalonia. Barcelona Spain.
Abstract The objective of the present study was to examine the magnitude of gender differences in activity limitations among the elderly, and the effect of the health and social individual factors and the context of social gender inequality in Eu-rope. Cross-sectional design was performed. The study population included residents aged 60 years or over from 17 countries that participated in the Survey of Health, Ageing and Retirement in Eu-rope conducted in 2010-13 (n = 49,685). Gender differences in activity limitation in each country was estimated. For multilevel analysis adjusted linear mixed effect models were used, where the intercept and ‘sex’ were considered random ef-fects, with the 95% confidence intervals. The ac-tivity limitation index was created from a two pa-rameter logistic combined models of item response theory. The average activity limitation index was
significantly higher in women, (g10 = b1j = 0.36, p
< 0.001), and was then controlled by individual and contextual factors, while the extent of these differences varied among countries. The Europe-an countries with the greatest gender differences in activity limitations were those with the greatest social gender inequalities, with women presenting
a significant disadvantage.
Key words Statistics on sequelae and disability, Aged, Multilevel analysis, Gender and health
Resumo O presente estudo objetivou examinar as magnitudes das diferenças de gênero nas limi-tações de atividades entre idosos, e o efeito dos fa-tores sociais e de saúde e o contexto de desigualda-des sociais de gênero na Europa. Foi realizado um estudo descritivo retrospectivo de corte transver-sal. A população do estudo incluiu residentes com 60 ou mais anos de idade de 17 países que parti-ciparam do Inquérito de Saúde, Envelhecimento e Reforma na Europa, conduzido em 2010-13 (n = 49.685). Foram estimadas as diferenças de gênero nas limitações de atividades para cada país. Para a análise multinível foram ajustados modelos mistos lineares, onde o intercepto e o ‘sexo’ foram considerados efeitos aleatórios, com intervalos de confiança de 95%. O índice de limitação de ativi-dades foi criado a partir de modelos combinados de dois parâmetros logísticos, na teoria de resposta ao item. A média do índice de limitação de ati-vidades foi significativamente mais alta em
mu-lheres, (g10 = b1j = 0,36, p < 0,001), controlada
por fatores individuais e contextuais, enquanto a extensão destas diferenças de gênero variou entre os países. Os países com as maiores diferenças de gênero nas limitações de atividade foram aqueles com as maiores desigualdades sociais de gênero, com as mulheres apresentando uma desvantagem
significativa.
Lima ALB Introduction
Projections indicate that the population of elder-ly people with functional disabilities will grow rapidly over a short period of time. In this way, assessment of functional capacity is a useful tool for assessing the health of the elderly, many of whom have several chronic diseases of varying severity, with different impacts on daily life1,2.
The measurement of activity limitations in-corporates one of the most important negative aspects of functionality, especially among elder-ly people3,4. Disability among elderly persons is
associated with several factors at individual and contextual levels, such as a diminished quality of life, rising costs of health care, long periods of care and social exclusion or the inability to ac-tively participate in society5,6.
A number of scientific propositions state that the probability of an individual presenting co-morbidities increases with longer life and leads to higher prevalence of disability7-9. Therefore,
the elderly population represents a significant problem for society to overcome, in that greater years of life are not lived in healthy and indepen-dent conditions10,11. However, older people can
achieve a healthy and active aging, through indi-vidual and personal effort and supported by so-cial ties, despite the health-related, finanso-cial and social declines associated with aging12.
According to Eurostat, the ratio of older peo-ple (65 and older) or older peopeo-ple who are depen-dent because of senility in Europe, in relation to people of working age is expected to double from 17% to 30% by 206013. Basically, the high
prev-alence of disability among women compared to men is due to a combination of a higher incidence and a greater survival rate, resulting in a low re-covery and mortality rate among women with disabilities14-16. In this regard, it is important that
policies to promote active aging consider gender differences and socioeconomic factors17.
Further-more, it is necessary to distinguish between sex and gender. Sex refers to biological and physio-logical differences between women and men such as hormones, genitalia or chromosomes. Gender refers to the characteristics of women and men that vary from society to society and are sociocul-turally and historically constructed18,19.
It should be noted that epidemiological stud-ies, which jointly address the individual and contextual factors of activity limitation, more adequately reflect the impact of disease on the quality of life of elderly people. This study, there-fore, aimed to examine the magnitude of gender
differences in activity limitations among the el-derly, the effect of health and social individual factors, and the context of social gender inequal-ity in Europe.
Methods
The present study featured a cross-section-al design, based on the databases of the Survey of Health, Ageing and Retirement in Europe (SHARE) project for 17 European countries (Austria, Belgium, Czech Republic, Denmark, Estonia, France, Germany, Hungary, Italy, Lux-embourg, Netherlands, Poland, Portugal, Spain, Slovenia, Sweden and Switzerland). Data from Hungary, Poland and Portugal was collected in 2011-12, while information from the other coun-tries was collected in 2013. The study population consisted of 49,685 people aged 60 years or over.
Calibrated individual weighting of the sam-pling design was considered, allowing unbiased estimators of the parameters of the populations to be obtained, and solving non-response and sample attrition issues. The percentage of indi-viduals excluded from the study due to a lack of data for any of the individual variables was 2.1%.
The dependent variable, known as the activity limitation index (ALI), was established through the item response theory (IRT) used in this study and was composed of four dimensions: (i) basic activities of daily living (ADL); (ii) instrumen-tal activities of daily living (IADL); (iii) mobil-ity; and (iv) depression profile. Chart 1 shows the variables that composed the dimensions of the ALI and those included in the functional ca-pacity measurement processes20-22. The SHARE
questionnaires asked whether the individual had any difficulty with ADL or IADL tasks or those of the mobility dimension due to physical, mental, emotional or memory problems, excluding any difficulties that were expected to last less than three months.
aúd
e C
ole
tiv
a,
23(9):2991-3000,
2018
The variables of the ILA dimensions (adl, iadl,
mobility and eurod), self-perceived health (sphus)
and the number of chronic diseases (chronic) are part of the gv_health module (SHARE project), which contains the health generated variables and index related to the physical and mental health of respondents23.
The independent context variable at coun-try level was the gender inequality index (GII)
proposed by the United Nations Development Programme24. The GII reflects social gender
in-equalities in three dimensions: reproductive health, empowerment and economic activity. Reproductive health is measured by maternal mortality and adolescent fertility; empowerment is measured by the proportion of seats held by women parliamentarians and attainment of sec-ondary and higher education by gender; and eco-nomic activity is measured by the participation in the labour market rate for women and men. The GII, then, can be interpreted as losses in hu-man development due to inequality between the achievements of women and men in all three di-mensions. The GII varies between 0 and 1 with higher values signifying higher levels of social gender inequality.
Analysis
Descriptive statistics were calculated for the individual variables and the ALI.
All the dimensions of the ALI were based on the two logistic parameter combined multiple IRT models, using structural equation model-ling, respecting dimensionality of latent space and stochastic local independence. The ALI comprises a scale ranging from -3 to +3, where negative values closer to -3 indicate a low level of latent trait and values closest to +3 indicate more serious activity limitations among elderly people.
To estimate the multilevel model three mul-tivariate analysis statistical models with robust variance were adjusted: (i) Model I: to estimate the variation in the global average of the product variable considering the two levels of analysis, adjusted for ‘sex’; (ii) Model II: other explanatory variables were added to the previous model on an individual level; and (iii) Model III: insertion of ‘gender inequality’ contextual variable to model II. A multilevel linear regression model was also adjusted, where the intercept and ‘sex’ were con-sidered as random effects on all models, using the 95% confidence interval (95% CI). Statistical analyses were conducted using STATA 14.1 and HLM7.
Results
Descriptive statistics
In the present study, the average age of the elderly persons was 72 (SD 8.0) years. A total of 17% were 80 or older, and 84% presented at least
Chart 1. Description of the dimensions of activity
limitation index.
Dimension Item
Basic activities of daily living (ADL)
Dressing, including putting on socks and shoes
Bathing or showering Eating, such as cutting up food Getting in and out of bed
Using the toilet, including getting up or down
Instrumental activities of daily living (IADL)
Preparing a hot meal Shopping for groceries Making telephone call Taking medications
Doing work around the house or garden
Managing money, such as paying bills and keeping track of expenses
Mobility Walking 100 meters Sitting two hours Getting up from chair
Climbing several flights of stairs Climbing one flight of stairs Stooping, kneeling or crouching Reaching or extending arms above shoulder
Pulling or pushing large objects Lifting or carrying objects weighing more than 5 kilos
Picking up a small coin from a table Depression
profile
Based in EURO-D symptoms: Depression
Pessimism Suicidality Guilt Sleep Interest Irritability Appetite Fatigue Concentration Enjoyment Tearfulness
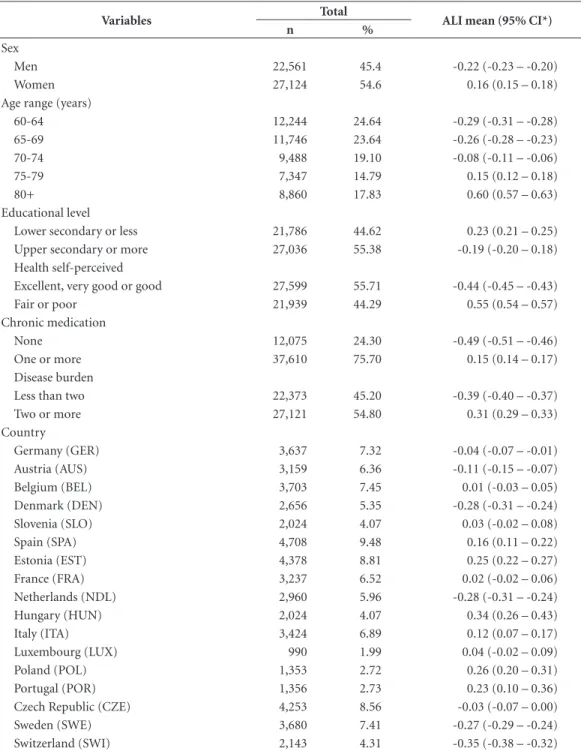
Lima ALB some activity limitation. Table 1 presents a
de-scription of the ALI averages for each individual variable and country.
On average, activity limitation among wom-en was greater than among mwom-en, as well among older elderly persons. However, a higher educa-tional level represented an important protective
factor. In terms of self-perceived health, reports of fair or poor health were associated with greater activity limitations. A greater burden of disease and the use of chronic medication were also fac-tors that were strongly related to greater activity limitations. Among countries, Hungary had the greatest activity limitation among elderly people,
Table 1. Descriptive statistics of the average activity limitation index.
Variables Total ALI mean (95% CI*)
n %
Sex
Men 22,561 45.4 -0.22 (-0.23 – -0.20)
Women 27,124 54.6 0.16 (0.15 – 0.18)
Age range (years)
60-64 12,244 24.64 -0.29 (-0.31 – -0.28)
65-69 11,746 23.64 -0.26 (-0.28 – -0.23)
70-74 9,488 19.10 -0.08 (-0.11 – -0.06)
75-79 7,347 14.79 0.15 (0.12 – 0.18)
80+ 8,860 17.83 0.60 (0.57 – 0.63)
Educational level
Lower secondary or less 21,786 44.62 0.23 (0.21 – 0.25)
Upper secondary or more 27,036 55.38 -0.19 (-0.20 – 0.18)
Health self-perceived
Excellent, very good or good 27,599 55.71 -0.44 (-0.45 – -0.43)
Fair or poor 21,939 44.29 0.55 (0.54 – 0.57)
Chronic medication
None 12,075 24.30 -0.49 (-0.51 – -0.46)
One or more 37,610 75.70 0.15 (0.14 – 0.17)
Disease burden
Less than two 22,373 45.20 -0.39 (-0.40 – -0.37)
Two or more 27,121 54.80 0.31 (0.29 – 0.33)
Country
Germany (GER) 3,637 7.32 -0.04 (-0.07 – -0.01)
Austria (AUS) 3,159 6.36 -0.11 (-0.15 – -0.07)
Belgium (BEL) 3,703 7.45 0.01 (-0.03 – 0.05)
Denmark (DEN) 2,656 5.35 -0.28 (-0.31 – -0.24)
Slovenia (SLO) 2,024 4.07 0.03 (-0.02 – 0.08)
Spain (SPA) 4,708 9.48 0.16 (0.11 – 0.22)
Estonia (EST) 4,378 8.81 0.25 (0.22 – 0.27)
France (FRA) 3,237 6.52 0.02 (-0.02 – 0.06)
Netherlands (NDL) 2,960 5.96 -0.28 (-0.31 – -0.24)
Hungary (HUN) 2,024 4.07 0.34 (0.26 – 0.43)
Italy (ITA) 3,424 6.89 0.12 (0.07 – 0.17)
Luxembourg (LUX) 990 1.99 0.04 (-0.02 – 0.09)
Poland (POL) 1,353 2.72 0.26 (0.20 – 0.31)
Portugal (POR) 1,356 2.73 0.23 (0.10 – 0.36)
Czech Republic (CZE) 4,253 8.56 -0.03 (-0.07 – 0.00)
Sweden (SWE) 3,680 7.41 -0.27 (-0.29 – -0.24)
Switzerland (SWI) 2,143 4.31 -0.35 (-0.38 – -0.32)
aúd
e C
ole
tiv
a,
23(9):2991-3000,
2018
whereas Swiss elderly people suffered less activity limitation.
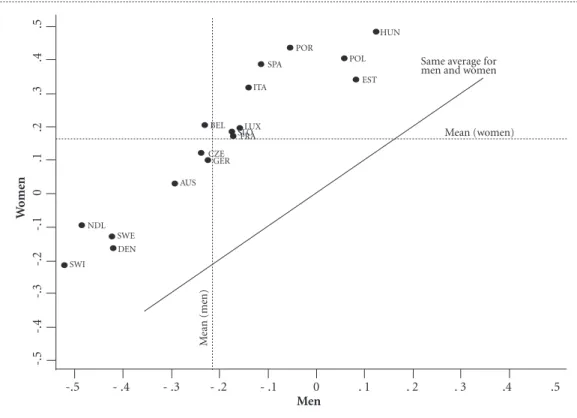
Relationship of gender difference and restriction of activities
As shown in Figure 1, gender differences in activity limitations among elderly persons were observed among the European countries eval-uated, after adjustment for other variables. The extent of gender differences in activity limitation for each country was displayed, and were found to be greater in Eastern European countries (Hungary, Poland and Estonia).
Multilevel analysis
Associations in activity limitations and social gender inequality
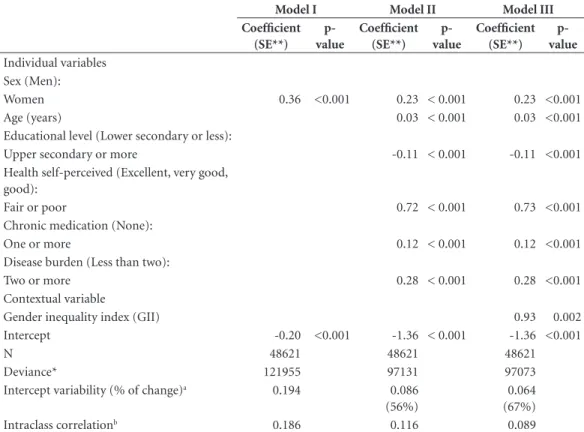
In Model I, the intercept of -0.20 represents the average activity limitation index among men in European countries, according to the data pre-sented in Table 2. The intercepts for 17 European countries varied around the average intercept, in-dicating statistically significant variation within
-.5 -.4 -.3 -.2 -.1 0 .1 .2 .3 .4 .5
W
om
en
Same average for men and women
Mean (women)
M
ean (me
n)
Men
SWI DEN NDL
SWE
AUS GER CZE
BEL LUX
SLOFRA
ITA SPA
POR
POL
EST HUN
-.5 - .4 - .3 - .2 - .1 0 . 1 . 2 . 3 .4 .5
Figure 1 - Scatter plot of the average activity limitation indexes adjusted among elderly women and men aged 60
or over years, European countries. Larger index values represent less favourable conditions of activity limitation. Source: SHARE Waves 4/5, 2010-13.
and between countries. In addition, 19% of the total variance of the activity limitation index was attributed to differences between countries relat-ing to their averages. The final multilevel model explained 67% of the variance in gender differ-ences between European countries, with interac-tions between levels not considered. Compared to model I, the addition of the other level 1-indi-vidual variables and the social gender inequality contextual factor at level 2 changed the residual variance by a factor of 0.656 / 0.847 = 0.774 in model III, which resulted in a variance represent-ed by 1-0.774 = 0.226.
In the final model, women were significantly more affected by activity limitation, g10 = b1j =
0.36, p < 0.001 while the effect of the gender gap
Lima ALB
social gender inequalities among countries were significantly associated with greater activity lim-itations among individuals, with evidence of het-erogeneity among countries in the relationship between gender differences and degree of activity limitation present in elderly.
Figure 2 shows gender differences regarding activity limitation in elderly people in European countries. Gender differences were more favour-able in Switzerland, the Netherlands, Denmark and Sweden, where the average activity limita-tion index among women was comparable to the overall average among men in all the European countries evaluated.
Discussion
Elderly women presented greater activity limita-tions, with this effect greater among European countries with the highest social gender inequal-ity. Additionally, there is evidence of heterogene-ity between countries regarding gender differ-ences in activity limitations. Thus, the individual and contextual effects explained, at least partially, activity limitations in elderly people.
Strengths and limitations
There are still major challenges regarding the definition and composition of components that make up the measurement of disability. However,
Table 2. Estimates of individual-level and country-level linear mixed effects obtained from multilevel analysis of
activity limitation index in a sample of the elderly people aged 60 or over years from 17 countries participating in the SHARE project 2010-13.
Model I Model II Model III
Coefficient (SE**)
p-value
Coefficient (SE**)
p-value
Coefficient (SE**)
p-value Individual variables
Sex (Men):
Women 0.36 <0.001 0.23 < 0.001 0.23 <0.001
Age (years) 0.03 < 0.001 0.03 <0.001
Educational level (Lower secondary or less):
Upper secondary or more -0.11 < 0.001 -0.11 <0.001
Health self-perceived (Excellent, very good, good):
Fair or poor 0.72 < 0.001 0.73 <0.001
Chronic medication (None):
One or more 0.12 < 0.001 0.12 <0.001
Disease burden (Less than two):
Two or more 0.28 < 0.001 0.28 <0.001
Contextual variable
Gender inequality index (GII) 0.93 0.002
Intercept -0.20 <0.001 -1.36 < 0.001 -1.36 <0.001
N 48621 48621 48621
Deviance* 121955 97131 97073
Intercept variability (% of change)a 0.194 0.086
(56%)
0.064 (67%)
Intraclass correlationb 0.186 0.116 0.089
a: % of change in variability was calculated using the following formula: [(initial variability - end variability) / initial variability] x 100. b: estimated by [variability intercept / (intercept + residual variability variability)]. Model I: include the activity limitation index by sex without adjustment for other variables. Formula: ALIij = g00+ g10Sexij + moj + rij . Model II: other individual variables were added to the model I (age, educational level, self-perceived health, chronic medication and disease burden), with random intercept without adjustment for the contextual variable. Formula: ALIij = g00+ g10Sexij + g20 Xij + ... + gn0 Xij + moj + rij. Model III: Contextual gender inequality variable was added to the model II, with intercepts and inclination (by sex) random among European countries. Formula: ALIij = g00+ g01GIIj + g10Sexij + g20 Xij + ... + gn0Xij + moj + mnjSexij + rij , where i = individuals = 1, ...,
48621; j = countries = 1, ..., 17; X = individual variables.
* Measure lack of fit between the model and the data, where the larger the deviance, the worse the fit of the model. ** SE: standard error. Level of statistical significance is p <0.05.
aúd
e C
ole
tiv
a,
23(9):2991-3000,
2018
activity limitation is one of the components that best reflect the negative aspects of disability25,26. In
addition, the activity limitation index proposed in this study adds important dimensions and is well defined in global scientific literature20-22,27.
These dimensions result in a more complete and robust model for the measurement of features of activity limitations in elderly people than other previous descriptive studies6,28.
Obviously, the poor functionality of the el-derly is predictive of nonresponse. Individuals who participate in surveys can be less functional-ly dependent than those who did not participate. However, despite not knowing the magnitude of the impact of non-response rates, we believe the methods used in this study are sufficiently robust to minimize non-response bias.
As far as we are aware, this is the first study that uses item response theory and multilevel analysis to assess the associations between gen-der differences and the influence of social gengen-der inequality on activity limitation among elderly people, which is a more modern and robust ap-proach than that used by previous descriptive studies20,21. Also, the use of multilevel analysis, in
addition to adding an ecological approach, can solve the obstacle of using multiple regression models that prevent compliance with the hy-pothesis of independence between measures of the outcome variable, and provide more accurate estimates for the preconized model. However, the samples have separate selections for each country and reflect a representative sample of their inhab-itants, but not the entire population of Europe.
Individual and contextual associated factors
Other the finding that elderly women gen-erally experience higher rates of morbidity and disability than men, in large part due to their greater life expectancy15, the results of this study
suggest that social gender inequality should be a central concern for public health policy in Eu-rope. On the other hand, gender differences in years of healthy life can be related to social gen-der inequalities in the prevalence of activity lim-itation. In European populations with a long life expectancy, the advantage of women in years of healthy life is small16. It should also be mentioned
-.5 - 4 -.3 -.2 -.1 0 .1 .2 .3 .4 .5
ALI
Country
Woman Men Total CI95%
Mean (women)
Mean
Mean (men)
LUX
LUX
LUX BEL
BEL
BEL
FRA CZE
SLO ITA
SPA POR
POL EST
EST HUN
AUS
HUN
GER
CZE FRA SLO
ITA SPA
POR POL
HUN EST POL
POR
AUS GER
SWE DEN
NDL CZE FRA SLO
ITA SPA
SWI
SWI
SWI NDL
NDL DEN
DEN SWE
SWE
AUS GER
Figure 2. Average activity limitation indexes among elderly people aged 60 or over years. Adjusted average of
Lima ALB that countries with more ‘women survivors’ do
not necessarily correspond to better health con-ditions29. Moreover, men who survive to old age
are a selection of the healthiest individuals and are no longer comparable with women of the same age30,31.
Educational level was established as an im-portant protective factor for activity limitation among elderly people. It has been shown that educational composition is important for the projections of the number of people with func-tional disability. Future elderly generations are expected to be significantly more educated, with a lower prevalence of functional disability among younger elderly groups (65-74 years old) and a higher rate in older elderly groups (85 or over years old)32. In this sense, social policies can
cre-ate educational opportunities, redistributing in-come and/or affecting the types of jobs that are available. These policies may affect the nature of social stratification by reducing the number of minimally educated individuals, and then reduce the number of social disadvantages to which indi-viduals are exposed that can lead to disability33,34.
Elderly people with the greatest disease bur-dens and who undergo chronic medication use tend to have more serious activity limitations6.
Thus, the fact that elderly people are the most medicated age group in society has a direct asso-ciation with the burden of chronic disease with age. One of the consequences of multiple drug use is the increased risk of adverse reactions, which in turn, can raise the profile of morbidity and mortality in the elderly35,36.
It should be added that the demographic and epidemiological transitions that are occurring worldwide are accompanied by the increasing feminization of the elderly population, due to the life expectancy differences between men and women15. Although life expectancy differences
between men and women are influenced by so-cial factors, there is good evidence that innate biological factors may interact, making a target disparity between them difficult to identify37.
Moreover, several disability differences between men and women could be at least partially
ex-plained by higher comorbidity and depression in women compared to men of a similar age and socioeconomic position14.
In the present study, gender differences in relation to the activity limitations were more fa-vourable in Switzerland, Netherlands, Denmark and Sweden. It is known that functional diffi-culties have been found to be significantly more prevalent among women in these countries, with the relative odds of having functional problems for women ranging from 1.57 in Germany to 2.43 in Spain21. Accordingly, a global measure of
successful aging ranges from 21% in Denmark, closely followed by Sweden and Netherlands (17%), to 3% in Spain and 2% in Poland38.
In 2013, for comparison, life expectancy in Switzerland was 85 years for women and 81 years for men. Spain, which had a similar life expectan-cy of 86 years for women and 80 years for men, had one of the worst activity limitation condi-tions among countries, trailing only Poland, Por-tugal, Estonia and Hungary39. These differences
between countries were substantially dependent on social gender inequalities in the present study. According to the social gender inequality index, Slovenia, Switzerland, Germany, Sweden and Denmark had the least gender inequality, while Hungary, Luxembourg, Estonia, Poland, Portugal and Spain were the most unequal, respectively (24). For this reason, analysis of the health sit-uation, health promotion strategies and public rehabilitation policies need to take into account social determinants and social gender inequali-ties among elderly people.
Conclusions
aúd
e C
ole
tiv
a,
23(9):2991-3000,
2018
Collaborations
All authors read and approved the manuscript content. All the authors contributed fundamen-tally to the accomplishment of this study.
Acknowledgments
This article uses data from Waves 4 and 5 of the SHARE project, see Börsch-Supan et al.5 for
methodological details. * SHARE data collection was primarily funded by the European Commis-sion in FP5, FP6 and FP7. This article is part of the doctoral thesis of André Luiz Barbosa Lima, of the Federal University of Rio Grande do Norte – Brazil, with support from the Public Health Agency of Barcelona – Spain. The authors would like to thank the Brazilian Federal Agency for the Support and Evaluation of Graduate Education for the scholarship granted to the doctoral stu-dent participating in the study.
References
1. Eckert KG, Lange MA. Comparison of physical activi-ty questionnaires for the elderly with the International Classification of Functioning, Disability and Health (ICF) – an analysis of content. BMC Public Health 2015; 15(1):249.
2. World Health Organization (WHO). World report on ageing and health. World Report. Geneva: WHO; 2015. 3. Ribeiro LC. Utilização da Classificação Internacional de
Funcionalidade, Incapacidade e Saúde (CIF) como fer-ramenta epidemiológica. Rio de Janeiro: Universidade Federal do Rio de Janeiro; 2012.
4. Altman BM. Definitions, concepts, and measures of disability. Ann Epidemiol 2014; 24(1):2-7.
5. Börsch-Supan A, Kneip T, Litwin H, Myck M, Weber G. SHARE: a European policy device for inclusive ageing societies. In: Börsch-Supan A, Kneip T, Litwin H, Myck M, Weber G, editors. Ageing in Europe - Supporting Pol-icies for an Inclusive Society. Berlin, Boston: De Gruyter; 2015. p. 1-22.
6. Lima ALB, Lima KC. Activity Limitation in the Elder-ly People and Inequalities in Brazil. OALib [Internet]. 2014 [cited 2014 Sep 21]; 1(4):1-9. Available from: http://www.oalib.com/paper/pdf/3099358
7. Zaslavsky O, Cochrane BB, Thompson HJ, Woods NF, Herting JR, LaCroix A. Frailty: A Review of the First Decade of Research. Biol Res Nurs 2012; 15(4):422-432. 8. McGough, Zumsteg JM. Lifestyle Changes in the Pre-vention of Mobility Disability. Heal Aging Clin Care Elder 2014; 6(4306):33.
9. Reuter I. Aging, Physical Activity, and Disease Pre-vention 2012. J Aging Res [Internet]. 2012 Jan [cit-ed 2014 Mar 20]; 2012:1-4. Available from: http:// www.pubmedcentral.nih.gov/articlerender.fcgi?ar-tid=3523558&tool=pmcentrez&rendertype=abstract 10. Ciosak SI, Braz E, Costa MFBNA, Nakano NGR,
Rodrigues J, Alencar RA, Rocha ACAL. Senescên-cia e senilidade: novo paradigma na atenção básica de saúde. Rev Esc Enferm USP [Internet]. 2011 Dec [cited 2014 Jun 5]; 45(spe2):1763-1768. Available from: http://www.scielo.br/scielo.php?script=sci_art- text&pid=S0080-62342011000800022&lng=pt&n-rm=iso&tlng=en
11. Tak E, Kuiper R, Chorus A, Hopman-Rock M. Preven-tion of onset and progression of basic ADL disability by physical activity in community dwelling older adults: A meta-analysis. Ageing Res Rev 2013; 12(1):329-338. 12. Sixsmith J, Sixsmith A, Fänge AM, Naumann D,
Kuc-sera C, Tomsone S, Haak M, Dahlin-Ivanoffi S, Wool-rych R. Healthy ageing and home: The perspectives of very old people in five European countries. Soc Sci Med 2014; 106:1-9.
13. Borsch-Supan A, Brandt M, Hunkler C, Kneip T, Korb-macher J, Malter F, Schaan B, Stuck S, Zuber S; SHARE Central Coordination Team. Data Resource Profile: The Survey of Health, Ageing and Retirement in Eu-rope (SHARE). Int J Epidemiol 2013; 42(4):992-1001. 14. Zunzunegui MV, Alvarado BE, Guerra R, Gómez JF, Ylli
Lima ALB 15. Hosseinpoor AR, Williams JS, Jann B, Kowal P,
Of-ficer A, Posarac A, Chatterji S. Social determinants of sex differences in disability among older adults: a multi-country decomposition analysis using the World Health Survey. Int J Equity Health 2012; 11(1):52. 16. Van Oyen H, Nusselder W, Jagger C, Kolip P, Cambois
E, Robine J-M. Gender differences in healthy life years within the EU: an exploration of the “health-survival” paradox. Int J Public Health 2013; 58(1):143-155. 17. Alexandre TDS, Corona LP, Nunes DP, Santos JLF,
Duarte YADO, Lebrão ML. Gender differences in in-cidence and determinants of disability in activities of daily living among elderly individuals: SABE study. Arch Gerontol Geriatr 2012; 55(2):431-437.
18. McDermott R, Hatemi PK. Distinguishing sex and gen-der. PS Polit Sci Polit 2011; 44(1):89-92.
19. World Health Organization (WHO). Gender main-streaming for health manergers: a practical approach. Geneva: WHO; 2011.
20. Chatterji S, Byles J, Cutler D, Seeman T, Verdes E. Health, functioning, and disability in older adults-pres-ent status and future implications. Lancet 2015; 385(9967):563-575.
21. Crimmins EM, Kim JK, Sole-Auro A. Gender differenc-es in health: rdifferenc-esults from SHARE, ELSA and HRS. Eur J Public Health 2011; 21(1):81-91.
22. Berger N, Van Oyen H, Cambois E, Fouweather T, Jag-ger C, Nusselder W, Robine JM. Assessing the validity of the Global Activity Limitation Indicator in fourteen European countries. BMC Med Res Methodol 2015; 15:1.
23. Mannheim Research Institute for the Economics of Ag-ing. Survey of Health, Ageing and Retirement in Europe - SHARE: Release guide 2.5.0. Mannheim: Mannheim Research Institute for the Economics of Ageing; 2011. 24. United Nations Development Programme. El índice
de desigualdad de género (IDG) [Internet]. 2013 [cited 2016 Jan 15]. Available from: http://hdr.undp.org/es/ content/gender-inequality-index
25. Seidel D, Brayne C, Jagger C. Limitations in physi-cal functioning among older people as a predictor of subsequent disability in instrumental activities of daily living. Age Ageing [Internet] 2011 Jul [cited 2014 Mar 19]; 40(4):463-469. Available from: http:// www.pubmedcentral.nih.gov/articlerender.fcgi?ar-tid=3114622&tool=pmcentrez&rendertype=abstract 26. Loke SC, Lim WS, Someya Y, Hamid TA, Nudin SSH.
Examining the Disability Model From the Internation-al Classification of Functioning, Disability, and HeInternation-alth Using a Large Data Set of Community-Dwelling Ma-laysian Older Adults. J Aging Health 2016; 28(4):704-725.
27. Dias EG, Duarte YAO, Almeida MHM, Lebrão ML. Caracterização das atividades avançadas de vida diária (AAVDS): um estudo de revisão. Rev Ter Ocup da Univ São Paulo [Internet] 2011 Apr 1 [cited 2014 Nov 28]; 22(1):45-51. Available from: http://www.revistas.usp. br/rto/article/view/14119
28. Beltrão KI, Teixeira MP, Parahyba MI, Fletcher P. Ca-pacidade funcional dos idosos: Uma análise dos suple-mentos Saúde da PNAD com a teoria de resposta ao item. Rio de Janeiro: IBGE; 2013.
This is an Open Access article distributed under the terms of the Creative Commons Attribution License
BY CC
29. Escobar Bravo MA, Puga González MD, Martín Bara-nera M. Análisis de la esperanza de vida libre de dis-capacidad a lo largo de la biografía: de la madurez a la vejez. Gac Sanit 2012; 26(4):330-335.
30. Andersen-ranberg K, Attias-donfut C, Benson GD, Börsch-supan A. First Results from the Survey of Health, Ageing and Retirement in Europe ( 2004-2007). Mann-heim: Mannheim Research Institute for the Economics of Ageing; 2008.
31. Regan JC, Partridge L. Gender and longevity: Why do men die earlier than women? Comparative and exper-imental evidence. Best Pract Res Clin Endocrinol Metab 2013; 27(4):467-479.
32. Ansah JP, Malhotra R, Lew N, Chiu CT, Chan A, Bayer S, Matchar DB. Projection of young-old and old-old with functional disability: Does accounting for the chang-ing educational composition of the elderly population make a difference? PLoS One 2015; 10(5):e0126471. 33. Souza Braga L, Lima-Costa MF, Cesar CC, Macinko J.
Social Inequalities on Selected Determinants of Active Aging and Health Status Indicators in a Large Brazilian City (2003-2010). J Aging Health 2016; 28(1):180-196. 34. Tyrovolas S, Koyanagi A, Olaya B, Ayuso-Mateos JL,
Miret M, Chatterji S, Tobiasz-Adamczyk B, Koskinen S, Leonardi M, Haro JM. The role of muscle mass and body fat on disability among older adults: A cross-na-tional analysis. Exp Gerontol 2015; 69:27-35.
35. Arruda GO, Lima SCDS, Renovato RD. The use of medications by elderly men with polypharmacy: repre-sentations and practices. Rev Lat Am Enfermagem 2013; 21(6):1337-1344.
36. Hubbard RE, O’Mahony MS, Woodhouse KW. Med-ication prescribing in frail older people. Eur J Clin Pharmacol [Internet]. 2013 Mar [cited 2013 Aug 7]; 69(3):319-326. Available from: http://www.ncbi.nlm. nih.gov/pubmed/22965651
37. Hambleton IR, Howitt C, Jeyaseelan S, Murphy MM, Hennis AJ, Wilks R, Harris EN4, MacLeish M5, Sulli-van L5; U.S. Caribbean Alliance for Health Disparities Research Group (USCAHDR). Trends in Longevity in the Americas: Disparities in Life Expectancy in Women and Men, 1965-2010. PLoS One 2015; 10(6):e0129778. 38. Hank K. How “Successful” Do Older Europeans Age?
Findings From SHARE. J Gerontol B Psychol Sci Soc Sci 2011; 66(2):230-236.
39. Banco Mundial. Esperanza de vida al nacer, mujeres, hombres y total (años) [Internet]. 2013 [cited 2015 Nov 2]. Available from: datos.bancomundial.org/indicador/
Artigo apresentado em 18/05/2016 Aprovado em 19/08/2016