Uni and multivariate methods applied to studies of phenotypic
adaptability in maize (
Zea mays
L.)
Esmael Lopes dos Santos1, Deoclécio Domingos Garbuglio2*, Pedro Mário de Araújo2,
Antonio Carlos Gerage2, Pedro Sentaro Shioga3 and Cássio Egidio Cavenaghi Prete4
1
Fundação de Apoio à Pesquisa e ao Desenvolvimento do Agronegócio, Londrina, Paraná, Brazil. 2Área de Melhoramento e Genética Vegetal, Instituto Agronômico do Paraná, Rod. Celso Garcia Cid, km 375, 86047-902, Londrina, Paraná, Brazil. 3Área
de Fitotecnia, Instituto Agronômico do Paraná, Londrina, Paraná, Brazil. 4Universidade Estadual de Londrina, Londrina, Paraná, Brazil. *Author for correspondence. E-mail: [email protected]
ABSTRACT. The objective of this study was to evaluate the performance of 15 maize cultivars in seven locations in Paraná State, Brazil. Towards this aim, grain yield trials were conducted during two crop seasons, and centroid (multivariate) and bissegmented regression (univariate) methods were used to evaluate possible divergences among results obtained. The genotypes were evaluated in randomized complete blocks with three replications. The centroid method was effective for indicating productive potential of genotypes, allowing for classification of genotype adaptability and stability. Values of probability above 0.40 allowed more reliable genotype classification for both adaptability and stability. The STRIKE genotype presented wide adaptability and stability by both the centroid and bissegmented regression methods. The SHS 4040 and CD 306 genotypes were not indicated for planting, considering the tested environments.
Keywords: multivariate analysis, genotype x environment interaction, centroid method, bissegmented regression.
RESUMO. Métodos uni e multivariados aplicados em estudos de adaptabilidade fenotípica em milho (Zea mays L.). O objetivo deste estudo foi avaliar, por meio de ensaios de rendimento grãos, o desempenho de 15 híbridos de milho em sete locais no Estado de Paraná e em duas safras, pelos métodos centróide (multivariado) e regressão bissegmentada (univariado), e avaliar possíveis divergências entre resultados obtidos por meio das duas metodologias. Os genótipos foram avaliados em delineamento de blocos completos casualizados com três repetiçõess. O método centróide foi efetivo na indicação de genótipos quanto o seu potencial produtivo, permitindo classificar genótipos não só quanto a adaptabilidade mas também quanto a estabilidade. Valores de probabilidade acima de 0,40 permitem classificar com maior confiabilidade os genótipos não só quanto à adaptabilidade, como também quanto à estabilidade. O genótipo STRIKE apresentou ampla adaptabilidade e estabilidade pelos métodos centróide e regressão bissegmentada. O genótipo SHS 4040 e CD 306 não devem ser indicados para cultivo, tomando-se como referência os ambientes testados.
Palavras-chave: análise multivariada, interação genótipo x ambiente, método centróide, regressão bissegmentada.
Introduction
Maize crops reach high yields in appropriate environments through the use of suitable cropping techniques. Within a single environment, the phenotypic manifestation is the result of the action of the genotype under the influence of the environment. However, when a series of environments is considered, an additional effect is detected due to the genetic and environmental effects resulting from the interaction of these factors (CRUZ et al., 2004).
Knowledge of the performance, or adaptability, of genotypes to determined environments through
uni- or multivariate methods is very important for seed and grain producers in assessing the agronomic value of the cultivar.
used to lessen the effects of the GxE interaction (MELO et al., 2007).
There are three options to reduce the effects of the GxE interaction, which include the following: a) identify specific cultivars for each environment; b) carry out ecological zoning; c) identify cultivars with greater phenotypic stability (PRADO et al., 2001). In the biometric sense, two approaches are typically used. In the first approach, stability and adaptability studies of different genotypes are conducted that, according to Cruz et al. (2004), aim to particularize the responses of each genotype in light of environmental variations to identify those with a wide or specific adaptability as well as those with predictable performance. Alternatively, a second approach involves environmental stratification methods, through analysis of the GxE interaction. In the stability and adaptability analyses, models based on bissegmented regression have been widely used; these models allow for the formation of both favorable environmental groups, where the environmental indices present positive values, and unfavorable environments, where the indices are negative (GARBUGLIO et al., 2007).
Rocha et al. (2005) proposed an alternative method to study the GxE interaction in plant species that was based on multivariate analysis methodology using principal components that were characterized by associating the advantages of this methodology with studies of the GxE interaction. This method, termed the centroid method, consisted of comparing the individual genotype response with the response of four ideal genotypes, with maximum or minimum response compared to the set of data assessed.
In this context, the objective of the present study was to verify the performance of 15 maize genotypes in 14 environments in Paraná State, Brazil. Assessment of the capacity for genotype discrimination using the adaptability and stability analysis techniques using the centroid (multivariate) and bissegmented regression (univariate) methods is described.
Material and methods
Data from 15 commercial maize cultivars were obtained in the State Network of Maize Cultivars Assessment, coordinated by the Paraná Agronomic Institute (IAPAR) in partnership with the Foundation for Support to Research and Agribusiness Development (FAPEAGRO). The cultivars AS 3430, BALU 551, BALU 761, BRS 1010, CD 306, DAS 8460, DAS 8480, DG 502, GARRA, STRIKE, PENTA, SG 150, SHS 4040, SHS 4060 and SHS 4080 were cropped in seven
locations in the state of Paraná (Londrina, Campo Mourão, Palotina, Ponta Grossa, Pato Branco, Cascavel and Guarapuava) in two crop seasons (2002/2003 and 2003/2004), which totaled 14 environments.
The trials were carried out in a randomized complete block design with three replications. Each plot consisted of two rows that were 5 m long, with 80 cm between each row and 20 cm between each plant in each row so that 25 plants per line were obtained after thinning. Pests and weeds were controlled when necessary. Data was obtained for weight of grain per plot (corrected to 14.5% moisture and adjusted to kg ha-1), which was used in the analyses.
First, individual analyses of variance were carried out, and after verifying the homogeneity of residual variances through an F maximum test, joint analyses were carried out, which considers as homogeneous when the relationship among the residual medium squares doesn't surpass the value 7 (BANZATTO; KRONKA, 1995). Effects of locations and assessment year were considered random, and the genotype effect was considered fixed.
Adaptability (β0, β1, β1+ β2) and stability (σˆδ2i,
R2) parameters were estimated by bissegmented
regression using a method by Cruz et al. (1989). The model adopted was: Yij = b0i + bliIj + b2iT(Ij) + σij + eij, where: Yij is the mean of the cultivar i in environment j, Ij is the environmental index, T(Ij) = 0 if Ij < 0, T(Ij) = Ij - I+ if Ij > 0 (where: I+ is the mean of the positive Ij indexes), b0i is the general mean of the cultivar I, b1i is the coefficient of the linear regression associated with Ij, b2i is the coefficient of the linear regression associated with T(Ij), σδi is the deviation of the linear regression, and
eij is the mean experimental error.
or maximum response in unfavorable environments and minimum response in favorable environments (ideotype III). The minimum adaptability ideotype presents the lowest values observed in all the environments studied (ideotype IV). Analyses were carried out using Genes (CRUZ, 2007) and SAS (SAS, 1999) software.
Results and discussion
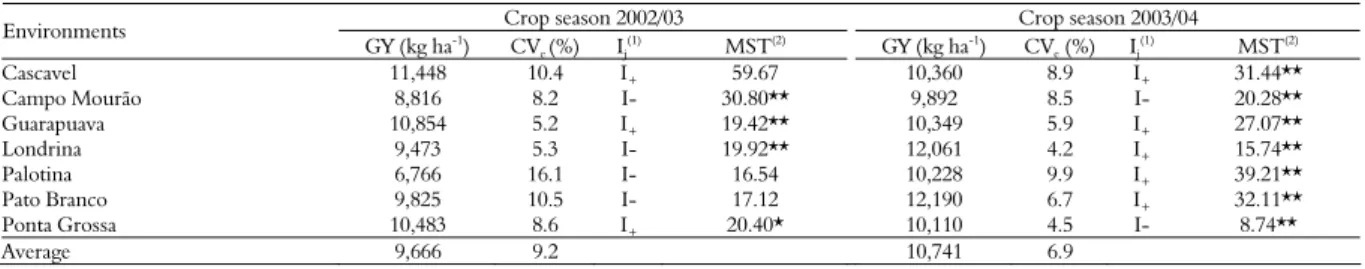
Table 1 shows that the trials presented high experimental precision, according to the classification proposed by Scapim et al. (1995), which was based on the coefficient of experimental variation (CVe%) of the individual analyses of variance.
The yield means for the 2002/2003 crop season ranged from 6,766 to 11448 kg ha-1 (Palotina and Cascavel, respectively), with 9,666 kg ha-1 as a general mean; however, in the 2003/2004 crop season, the means were between 9,892 (Campo Mourão) and 12,190 kg ha-1 (Pato Branco), and 10,741 kg ha-1 was the general mean in this crop season. The environmental indices (Ij), calculated considering the set of 14 environments (Tables 1 and 4), classified eight as favorable (I+) and six as unfavorable (I-).
According to Gerage et al. (2003), the climatic conditions that prevailed during the 2002/2003 crop season were strongly influenced by the El Niño phenomenon. Periods under the effect of this phenomenon are normally characterized by greater than normal rainfall in the state because cold fronts are blocked and remain stationary in the southern region of Brazil. However, a position of geographic transition is emphasized that characterizes Paraná, which gives different effects in the action of phenomena of this nature among its regions. Thus, greater than normal rainfall predominated in the south, southwest, central southern, and central western region of the state as well as in part of the western region of the state., In the northern and part of the western region of the state, rainfall was less than normal and irregularly distributed during the months of September, October, and December as well as during most of January, whereas rainfall was
above the normal mean with regular distribution during the months of August, November and February. Frosts at the beginning of September also marked the period that damaged fields planted early, and drought associated with high temperatures occurred at the end of December as well as at the beginning of January in most of the state; these results were different from weather forecasts based on the El Niño effect.
In the face of this climatic reality, cultivars planted in the south (Ponta Grossa), southwestern (Pato Branco), central southern (Guarapuava), central western (Campo Mourão) and some regions in the western region (Cascavel) benefited more; however, those planted in the northern region (Londrina) and in some parts of the western region (Palotina) of the state developed under drought, and they were partly damaged by these unfavorable conditions. It should be emphasized that even locations that had abundant rainfall (considering the total volume of rain) may have suffered some period of stress due to rainfall distribution problems. When this effect coincided with stages of flowering and the start of grain swelling and was followed by abundant rain at maturity, there was a predisposition for plants to have a greater lodging index, associated with stem rot, which also occurred in the experiments planted in Palotina and Londrina.
During the 2003/2004 crop season, according to Gerage et al. (2004), the maize plantations were not as significantly damaged by drought as the soybean and cotton plantations were because the regions most affected by drought in January and February were areas where soybean cropping predominated. During this period, the maize cultivated in these regions was at a more advanced stage of fructification that minimized losses. The main maize-producing region (the central southern region), which includes the localities of Guarapuava and Pato Branco, where trials were set up for the present study, had only a few pockets of drought after February.
Table 1. Means of grain yield (GY), coefficient of experimental variation (CVe%), environmental index (Ij) and mean squares of treatments (MST) in seven locations on Paraná State. 2002/2003 and 2003/2004 crop seasons.
Crop season 2002/03 Crop season 2003/04
Environments
GY (kg ha-1) CV
e (%) Ij(1) MST(2) GY (kg ha-1) CVe (%) Ij(1) MST(2)
Cascavel 11,448 10.4 I+ 59.67 10,360 8.9 I+ 31.44**
Campo Mourão 8,816 8.2 I- 30.80** 9,892 8.5 I- 20.28**
Guarapuava 10,854 5.2 I+ 19.42** 10,349 5.9 I+ 27.07**
Londrina 9,473 5.3 I- 19.92** 12,061 4.2 I+ 15.74**
Palotina 6,766 16.1 I- 16.54 10,228 9.9 I+ 39.21**
Pato Branco 9,825 10.5 I- 17.12 12,190 6.7 I+ 32.11**
Ponta Grossa 10,483 8.6 I+ 20.40* 10,110 4.5 I- 8.74**
Average 9,666 9.2 10,741 6.9
1I
The ratio between the greatest and least residual mean square was 6.7. Banzatto and Kronka (1995) reported that a ratio less than 7 indicated that there was homogeneity in the residual variances obtained in the individual analyses so that joint analysis could be carried out without location restriction.
In the 2002/2003 crop season, the localities of Cascavel, Palotina and Pato Branco did not present significant differences (p > 0.05) among treatments in the individual analyses (Table 1). However, this fact did not interfere in the discussion of the results because the genotype assessed presented highly significant differences (p < 0.01) both in the G x E interaction and in the G x E interaction partitioning (Table 2).
Table 2. Joint analysis of variance for grain yield (kg ha-1) of 15 maize genotypes, in 14 environments on Paraná State. 2002/2003 and 2003/2004 crop seasons.
Source of Change GL Mean Squares (x104)
Genotype (G) 14 10.80 **
Environment (E) 13 20.20 **
GxE 182 29.97 **
E/G 195 13.80 **
E / AS 3430 13 80.47 **
E / BALU 551 13 10.05 **
E / BALU 761 13 96.60 **
E / BRS 1010 13 71.51 **
E / CD 306 13 61.61 **
E / DAS 8460 13 11.47 **
E / DAS 8480 13 13.51 **
E / DG 502 13 94.18 **
E / GARRA 13 10.80 **
E / PENTA 13 71.36 **
E / SG 150 13 67.03 **
E / SHS 4040 13 65.39 **
E / SHS 4060 13 82.99 **
E / SHS 4080 13 94.56 **
E / STRIKE 13 13.63 **
Residual 392 32.61
The CD 306 and SHS 4040 genotypes were not very responsive in the I- (β1 < 1) environments,
showed medium responsiveness in the I+ (β1 + β2 = 1) environments and variances of the regression deviations (ˆ2
i
δ
σ ) greater than zero.
Garbuglio et al. (2007) emphasized that ˆ2
i
δ
σ should not be the only factor acting in a probable cultivar recommendation and that the mean grain yield over the environments should be taken into consideration. Assuming a determination coefficient (R2) of 70.7 as a selection point, which is equivalent to a 50% coefficient correlation (CUCOLOTTO et al., 2007), CD 306 and SHS 4040 presented high instability (R2 = 54 and 63%, respectively) in addition to yields below the general means in the I+ and I- environments. These genotypes may not be indicated for cropping, considering the set of genotypes and environments assessed.
In addition to the highest yields (considering the general means) in I+ environments and the fourth greatest mean in I- environments, the STRIKE genotype was highly responsive in I+ (β1 + β2 > 1) environments, with an increase of 1,050 kg ha-1 in relation to the mean of I+ (10,996 kg ha-1) and had medium responsiveness in I- (β1 = 1) environments. This genotype presented ˆ2
i
δ
σ > 0, but the variation explained by a regression was high (R2 = 83%), which showed good stability in the environments considered; therefore, this genotype can be recommended for cropping in I+ and I- environments.
Although DAS 8480 presented yields higher than the general means in I+ environments, it showed relatively low magnitudes (10 kg ha-1 above the general mean and 119 kg ha-1 in the I
+ environments). It further presented high responsiveness to I- (β1 > 1) environments and medium responsiveness to I+ (β1 + β2 = 1) environments (
2
ˆδi
σ > 0, with R2 = 81%). Based
on the means and parameters, indication for cropping
of this material should be restricted to I+
environments.
Table 3. Estimates of adaptability and stability parameters of 15 maize genotypes, according to the method proposed by Cruz et al. (1989), in seven environments on Paraná State. 2002/2003 and 2003/2004 crop seasons.
Genetic μ0
2 I-3 I
+ 4
Cultivars1
class(6) --- kg ha -1 --- β 1 β 1 + β 2 σˆδ2i
5
R2 (%)
1. AS 3430 H.T 9646 8794 10285 0.89 1.26 99.3 84
2. BALU 551 H.D 10335 9228 11165 1.05 1.00 390.0 ** 78
3. BALU 761 H.D 10815 9680 11666 1.03 1.26 109.9 86
4. BRS 1010 H.S 10585 9718 11235 0.88 0.96 119.8 81
5. CD 306 H.T 9852 9080 10432 0.67 ** 0.69 581.0 ** 54
6. DAS 8460 H.S.M 9960 8676 10924 1.19 1.20 66.1 90
7. DAS 8480 H.S 10213 9012 11115 1.24* 1.19 489.8 ** 81
8. DG 502 H.S.M 10666 9209 11758 1.07 0.55 393.6 ** 76
9. GARRA H.T 10339 9280 11134 1.19 0.57 342.0 * 81
10. PENTA H.S 10944 9985 11664 0.96 0.83 -40.8 89
11. SG 150 H.D 9943 9028 10629 0.78 1.17 104.2 81
12. SHS 4040 H.D 8740 7967 9319 0.69** 0.99 441.1 ** 63
13. SHS 4060 H.D 9731 8731 10481 1.02 1.05 -70.0 91
14. SHS 4080 H.D 10335 9331 11089 1.10 0.70 210.3 82
15. STRIKE H.S 10945 9477 12046 1.18 1.51* 414.9 ** 83
Médias 10203 9146 10996
1Identification and codification of the treatments used in the analyzes 2μ0: general mean. 3I-: mean of the unfavorable environments. 4I+: mean of the favorable environments. 5ˆ2
i
δ
σ x 103.
* and **: significant at 5 and 1% probability by the t test for the regression coefficients and by the F test, for σˆ2δi. 6H.S= Single Hybrid; H.D= Double Hybrid; H.S.M= Modified
The BALU 551, DG 502 and GARRA genotypes generally presented higher yields than the general means in I+ and I- environments (
2 ˆδi
σ > 0) but
presented with R2 values over 70.7% (78, 76 and 81%, respectively). The other genotype generally presented yields above the means in the three situations; the β1 and β1 + β2 parameters were statistically equal to 1 and
2
ˆδi
σ = 0, with R2 higher than70.7%. When indicating
these genotypes, the level of investment on the part of the producer, in the choice of a determined genetic class, should be considered in addition to their productive potentials and parameters obtained.
As reported by Garbuglio et al. (2007), a recommendation based only on the parameters estimated by the model may exclude a material that has stability, which is included within a high yield range. The authors emphasized further that in addition the edaphoclimatic conditions of the region in question, the technological level used by the producers is of fundamental importance in maize cultivation for the choice of genotype for cropping.
To maximize an improvement of the responses in adaptability and stability studies, multivariate techniques have been presented (MURAKAMI; CRUZ, 2004; ROCHA et al., 2005) based on the principal components method, and their uses have been shown to be efficient tools in these studies (CUCOLOTTO et al., 2007; GARBUGLIO et al., 2007, MENDONÇA et al., 2007). In the centroid method proposed by Rocha et al. (2005), the concepts of adaptability and stability are differentiated from others, including those obtained by bissegmented regression, because the genotype with maximum specific adaptation is not the one that presents good performance in the I+ or I- environmental groups; however, the genotype with maximum specific adaptation presents maximum values for a determined group of environments (I+ or I-) and minimum values for another set.
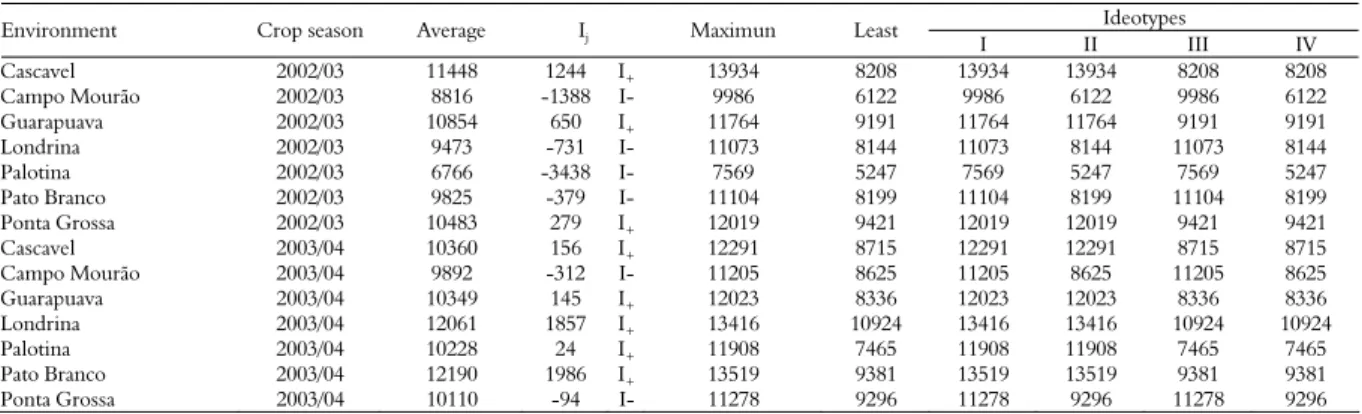
A cumulative percentage was detected in the explained variation of 80.1% for the three first main components, which fixed the number of three axles to construct the graphs (Figures 1A to 1B). Table 4 shows the identification of the ideotypes for each location, the cropping season as well as the Ij values (in kg ha-1) that were used to determine the environmental quality.
By grouping probabilities, calculated according to the inverse of the distance to one of the centriods, the AS 3430, SHS 4040 and SHS 4060 genotypes presented low adaptation to the set of environments considered. The same result was verified for SHS 4040 based on the bissegmented regression methodology, whereas AS 3430 and SHS 4060 presented a mean responsiveness in the I+ and I- environments in the regression method, and their yields were lower than the general means in the I+ and I- environments.
The use of centroids as adaptability references indicated that the genotypes close to the centroids should present a high expression of genes that are influenced or controlled by the environment (KANG; GAUCH JR., 1996) so that the final result (in the present case, yields) counteracts the adverse effects of the environment to which it is submitted, which remains close to the desired mean. Therefore, the genotypes with performance close to the maximum values of ideotypes I, II and III, in addition to presenting high adaptability to each one of the situations, also tended to present high general stability (if close to ideotype I) or specific stability to the set of favorable environments (close to ideotype II) or unfavorable environments (close to ideotype III).
Rocha et al. (2005) pointed out that probability values closer to or greater than 50% indicated good reliability in the grouping, and one point (genotype I) equidistant to the four reference points (ideotypes) will present probability values of 25%. The more the probability value differs from 25% and is closer to or greater than 50%, the greater the certainty of concluding the genotype grouping and adaptability classification will be.
Table 4. Classification of the environments using the environmental index (Ij) and establishment of the ideotypes based on productivity in kg ha-1.
Ideotypes
Environment Crop season Average Ij Maximun Least I II III IV
Cascavel 2002/03 11448 1244 I+ 13934 8208 13934 13934 8208 8208
Campo Mourão 2002/03 8816 -1388 I- 9986 6122 9986 6122 9986 6122
Guarapuava 2002/03 10854 650 I+ 11764 9191 11764 11764 9191 9191
Londrina 2002/03 9473 -731 I- 11073 8144 11073 8144 11073 8144
Palotina 2002/03 6766 -3438 I- 7569 5247 7569 5247 7569 5247
Pato Branco 2002/03 9825 -379 I- 11104 8199 11104 8199 11104 8199
Ponta Grossa 2002/03 10483 279 I+ 12019 9421 12019 12019 9421 9421
Cascavel 2003/04 10360 156 I+ 12291 8715 12291 12291 8715 8715
Campo Mourão 2003/04 9892 -312 I- 11205 8625 11205 8625 11205 8625
Guarapuava 2003/04 10349 145 I+ 12023 8336 12023 12023 8336 8336
Londrina 2003/04 12061 1857 I+ 13416 10924 13416 13416 10924 10924
Palotina 2003/04 10228 24 I+ 11908 7465 11908 11908 7465 7465
Pato Branco 2003/04 12190 1986 I+ 13519 9381 13519 13519 9381 9381
It was detected that the BALU 761, PENTA and STRIKE genotypes, which were classified as I with probabilities of over 0.40 (Table 5), also obtained an R2 value over 80%, whereas the SHS 4040 genotype, classified as IV with 0.40 probability, presented an R2 value of 63% with 2
ˆδi σ > 0.
Thus, it is emphasized that analysis by the centroid method allows for classification of a genotype not only for adaptability but also for stability, and the latter is more precise when the probability value of the grouping is close to or greater than 50%. In the present study, high values were not observed for the grouping probabilities in II and III.
In addition to BALU 761, PENTA and STRIKE,
the BALU 551, BRS 1010, DAS 8480, DG 502, GARRA and SHS 4080 genotypes (Table 5, Figures 1A and B) were also classified with wide adaptability (group I). DAS 8460 was classified as II, and CD 306 and SG 150 were classified as III; however, these three genotypes presented values relatively close to 0.25 (0.28, 0.29 and 0.26, respectively), based on Table 5 and better visualized in Figure 1 (A and B), which reduced the grouping reliability.
Taking the CD 306 genotype as an example, by the regression parameters and its productive potential below the general means and in I+ and I- environments, it might not be suitable for cropping in the set of environments studied, which is contrary to the response obtained by the centroid method.
Table 5. Classification of the 15 genotypes characterized by the centroids and the probability associated to their classification, in 14 environments in the state of Paraná. 2002/2003 and 2003/2004 crop seasons.
Cultivars1
Class2
Genetic Average General Group3
Prob (I) Prob (II) Prob (III) Prob (IV)
1. AS 3430 H.T 9646 IV 0.21 0.22 0.26 0.28
2. BALU 551 H.D 10335 I 0.30 0.26 0.22 0.20
3. BALU 761 H.D 10815 I 0.41 0.25 0.17 0.15
4. BRS 1010 H.S 10585 I 0.34 0.23 0.23 0.18
5. CD 306 H.T 9852 III 0.22 0.21 0.29 0.27
6. DAS 8460 H.S.M 9960 II 0.24 0.28 0.22 0.24
7. DAS 8480 H.S 10213 I 0.27 0.25 0.23 0.22
8. DG 502 H.S.M 10666 I 0.36 0.29 0.17 0.16
9. GARRA H.T 10339 I 0.29 0.25 0.23 0.21
10. PENTA H.S 10944 I 0.42 0.22 0.19 0.15
11. SG 150 H.D 9943 III 0.24 0.23 0.26 0.25
12. SHS 4040 H.D 8740 IV 0.12 0.15 0.21 0.49
13. SHS 4060 H.D 9731 IV 0.22 0.24 0.25 0.28
14. SHS 4080 H.D 10336 I 0.30 0.25 0.23 0.20
15. STRIKE H.S 10945 I 0.41 0.27 0.16 0.14
1 Identification and codification of the treatments used in the analyzes. 2H.S= Single Hybrid; H.D= Double Hybrid; H.S.M= Modified Single Hybrid; H.T= Three-way Hybrid. 3Group I: general adaptability (++); Group II: specific adaptability to favorable environments (+-); Group III: specific adaptability to unfavorable environments (-+); Group IV: low
adaptability (--).
Figure 1. Graphic dispersion of the first threePrincipal Components referring to 15 maize genotypes in 14 environments in Paraná State, in the 2002/2003 and 2003/2004 crop seasons, according the Centroid method (ROCHA et al., 2005). The four numbered points with roman ciphers, represent the centroids I – wide adaptability, II – specific adaptability to favorable environments, III – specific adaptability to unfavorable environments, IV – low adaptability for all environments.
Conclusion
Analysis by the centroid method permitted genotype classification not only for adaptability but also for stability. Classification will be more reliable if the probability values are higher than 0.4. The STRIKE genotype presented wide adaptability and stability by both the centroid and bissegmented regression methods. The SHS 4040 and CD 306 genotypes should not be cropped in the environments tested. The centroid method is effective in indicating the productive potential of genotypes.
References
BANZATTO, D. A.; KRONKA, S. N. Experimentação agrícola. 3 ed. Jaboticabal: Funep, 1995.
CRUZ, C. D. Genes v.2007.0.0: aplicativo computacional em genética e estatística. Available from: <http://www.ufv.br/ dbg/genes/genes.htm>. Access on: 10 Dec. 2007.
CRUZ, C. D.; REGAZZI, A. J.; CARNEIRO, P. C. S. Modelos biométricos aplicados ao melhoramento genético. 3. ed. Viçosa: UFV, 2004. v. 1.
CRUZ, C. D.; TORRES, R. A.; VENCOVSKY, R. An alternative approach to the stability analysis proposed by Silva and Barreto. Revista Brasileira de Genética, v. 12, n. 2, p. 567-580, 1989.
CUCOLOTTO, M.; CARPENTIERI-PÍPOLO, V.; GARBUGLIO, D.; FONSECA JUNIOR, N. S; DESTRO, D.; KAMIKOGA, M. K. Genotype x environment interaction in soybean: evaluation through three methodologies. Crop Breeding and Applied Biotechnology, v. 7, n. 3, p. 271-278, 2007.
GARBUGLIO, D. D.; GERAGE, A. C.; ARAÚJO, P. M.; FONSECA JUNIOR, N. S.; SHIOGA, P. S. Análise de fatores e regressão bissegmentada em estudos de estratificação ambiental e adaptabilidade em milho. Pesquisa Agropecuária Brasileira, v. 42, n. 2, p. 183-191, 2007. GERAGE, A. C.; SHIOGA, P. S.; ARAÚJO, P. M. Avaliação estadual de cultivares de milho safra 2002/2003. Londrina: Iapar, 2003. (Informe da Pesquisa, n. 142).
GERAGE, A. C.; SHIOGA, P. S.; ARAÚJO, P. M. Avaliação estadual de cultivares de milho safra 2003/2004. Londrina: Iapar, 2004. (Informe da Pesquisa, n. 144).
KANG, M. S.; GAUCH JR., H. G. Genotype by environment interaction. New York: CRC Press, 1996.
MELO, L. C.; MELO, P. G. S.; FARIA, L. C.; DIAZ, J. L. C.; DEL PELOZO, L. J.; RAVA, C. A.; COSTA, J. G. C. Interação com ambientes e estabilidade de genótipos de feijoeiro comum na Região Centro-Sul do Brasil. Pesquisa Agropecuária Brasileira, v. 42, n. 5, p. 715-723, 2007. MENDONÇA, O.; CARPENTIERI-PÍPOLO, V.; GARBUGLIO, D. D.; FONSECA JUNIOR, N. S. Análise de fatores e estratificação ambiental na avaliação da adaptabilidade e estabilidade em soja. Pesquisa Agropecuária Brasileira, v. 42, n. 11, p. 1567-1575, 2007.
MURAKAMI, D. M.; CRUZ, C. D. Proposal of methodologies for environment stratification and analysis of genotype adaptability. Crop Breeding and Applied Biotechnology, v. 4, n. 1, p. 7-11, 2004.
MURAKAMI, D. M.; CARDOSO, A. A.; CRUZ, C. D.; BIZÃO, N. Considerações sobre duas metodologias de análise de estabilidade e adaptabilidade. Ciência Rural, v. 34, n. 1, p. 71-78, 2004.
PRADO, E. E. P.; HIROMOTO, D. M.; GODINHO, V. P. C.; UTUMI, M. M.; RAMALHO, A. R. Adaptabilidade e estabilidade de cultivares de soja em cinco épocas de plantio no cerrado de Rondônia. Pesquisa Agropecuária Brasileira, v. 36, n. 4, p. 625-635, 2001.
ROCHA, R. B.; MURO-ABAD, J. I.; ARAUJO, E. F.; CRUZ, C. D. Avaliação do método centróide para estudo de adaptabilidade ao ambiente de clones de
Eucalyptus grandis. Ciência Florestal, v. 15, n. 3,
p. 255-266, 2005.
SAS-Statistical Analisys System. SAS/STAT software: changes and enhancements through release 8.02. Cary: Statistical Analysis System Institute, 1999. (3 CD-ROM).
SCAPIM, C. A.; CARVALHO, C. G. P.; CRUZ, C. D. Uma proposta de classificação dos coeficientes de variação para a cultura do milho. Pesquisa Agropecuária Brasileira, v. 30, n. 5, p. 683-686, 1995.
Received on April 29, 2009. Accepted on July 29, 2010.