RESEARCH ARTICLE
Stability of core/shell quantum dots
—role of pH and small
organic ligands
Rute F. Domingos&Cristiana Franco&José P. Pinheiro
Received: 30 July 2012 / Accepted: 27 December 2012 # Springer-Verlag Berlin Heidelberg 2013
Abstract The improvement of knowledge about the toxic-ity and even processabiltoxic-ity, and stabiltoxic-ity of quantum dots (QD) requires the understanding of the relationship between the QD binding head group, surface structure, and interli-gand interaction. The scanned stripping chronopotentiome-try and absence of gradients and Nernstian equilibrium stripping techniques were used to determine the concentra-tion of Cd dissolved from a polyacrylate-stabilized CdTe/ CdS QD. The effects of various concentrations of small organic ligands such as citric acid, glycine, and histidine and the roles of pH (4.5–8.5) and exposure time (0–48 h) were evaluated. The highest QD dissolution was obtained at the more acidic pH in absence of the ligands (52 %) a result of the CdS shell solubility. At pH 8.5 the largest PAA ability to complex the dissolved Cd leads to a further QD solubility until the equilibrium is reached (24 % of dissolved Cd vs. 4 % at pH 6.0). The citric acid presence resulted in greater QD dissolution, whereas glycine, an amino acid, acts against
QD dissolution. Surprisingly, the presence of histidine, an amino acid with an imidazole functional group, leads to the formation of much strong Cd complexes over time, which may be non-labile, inducing variations in the local environ-ment of the QD surface.
Keywords Quantum dots . Stability . Dissolution . Speciation . Bioavailability . Organic ligands
Introduction
Much progress has recently been made in using the fluorescence-emitting semiconductor nanocrystals, also called quantum dots (QD), in biomedical imaging to target genes and for drug delivery, and for optoelectronic purposes (Michalet et al. 2001; Alivisatos 2004; Gao et al. 2004; Bagalkot et al.
2007). The growth of the research activities associated with the use of QD will lead, in the near future, to a drastic increase of the QD emissions to the environment. QD are available in various sizes and compositions, such as CdSe, CdTe, ZnSe, or PbSe cores surrounded or not by a Zn or CdS shell (Kim et al.
2003). The stability and processibility of plain core QD are far from ideal. Core/shell QD are chemically and thermally more stable than the corresponding plain core QD (Guo et al.2003), which makes them to be preferably chosen structures when either the QD must undergo complicated chemical treatments, such as for biomedical applications (Michalet et al. 2001; Bagalkot et al. 2007; Mattoussi et al. 2000), or go through constant excitation as for light-emitting diodes (Tessler et al.
2002) and lasers (Klimov et al.2000).
The stability of a QD is affected by two very different phenomena: dissolution and aggregation. Regarding aggrega-tion the stability can be further enhanced with the use of a stabilizer. These are usually charged or neutral polymers that improve the QD stability by electrostatic repulsion or steric Responsible editor: Philippe Garrigues
Electronic supplementary material The online version of this article (doi:10.1007/s11356-012-1457-0) contains supplementary material, which is available to authorized users.
R. F. Domingos (*)
:
C. FrancoCentro de Química Estrutural, Instituto Superior Técnico, Universidade Técnica de Lisboa, Torre Sul lab 11-6.3, Av. Rovisco Pais # 1, 1049-001 Lisbon, Portugal e-mail: rute.domingos@ist.utl.pt C. Franco e-mail: cristiana.franco@gmail.com J. P. Pinheiro
Centro de Biomedicina Molecular Estrutural CBME/IBB, LA, Universidade do Algarve, Campus de Gambelas,
8005-139 Faro, Portugal e-mail: jpinhei@ualg.pt DOI 10.1007/s11356-012-1457-0
effects, respectively. The significance of the dissolution pro-cess of a QD is twofold: first, it strongly affects the stability of the QD and therefore is of great importance for their long-term use in all solution-based applications. This can be critical when they are used as optical labels in biological imaging because of the high toxicity of the widely used QD compo-nents such as Cd or Pb. Second, the understanding of the QD dissolution mechanism will lead to a much more rational design of efficient synthesis routes for high-quality QD. Despite the importance of QD dissolution for successful QD synthesis, for their safe and prolonged use in most applications and for their environmental impact, very little is known about its underlying mechanism and reaction pathways under envi-ronmental relevant conditions.
The need for a serious assessment of QD potential cyto-toxicity has garnered much needed attention in recent pub-lications. Using primary hepatocytes, Derfus et al. (2004) found that uncoated CdSe QD were acutely toxic under oxidative conditions, with the cytotoxicity correlated with the release of free Cd ions due to the deterioration of the CdSe lattice. Poisoning of NRK fibroblasts due to the dis-solved Cd ions was also observed for mercaptopropionic-acid-coated CdSe and CdSe/ZnS QD (Kirchner et al.2005). CdSe, CdTe, and CdS coated with hydrophilic deprotonated thiol ligands were shown to be unstable at a relatively low pH range, between 2 and 7, because of the dissociation of the QD–ligand coordinating bonds from the QD surface (Aldana et al.2001,2005). Studies on QD–organism inter-actions also have indicated that QD toxicity may at least be partially attributed to the release of toxic ions (Kloepfer et al. 2003; Mahendra et al. 2008; Priester et al. 2009; Aruguete et al.2010; Domingos et al. 2011). Aruguete et al. (2010) observed an increase of the released Cd from CdSe/CdS QD when incubated in the Pseudomonas aeru-ginosa growth medium in presence of nitrilotriacetic acid (NTA), which was explained by the NTA ability to chelate Cd ion.
Many controversies still exists in determining the exact mechanisms that result on the toxicity of nanoscale materi-als. Clearly, understanding the physicochemical properties of the QD, including their stability as function of pH and presence of other ligands, is fundamental to evaluate the risks from an environmental and toxicological perspective. The objective of this work was thus to evaluate the stability of a carboxylate terminated CdTe/CdS QD by quantifying the dissolved Cd and the shifts on the maximum wavelength of fluorescence spectra. The dissolution of the QD was followed by the electroanalytical technique scanned strip-ping chronopotentiometry (SSCP) (Pinheiro and van Leeuwen2004). The free Cd in solution was quantified by the absence of gradients and Nernstian equilibrium stripping (AGNES) technique (Domingos et al.2008). Special em-phasis was placed on (1) precisely quantifying the free Cd in
solution; (2) determining the Cd concentration in solution arising from the dissolution of the CdS shell; (3) determin-ing the role of pH and exposure time (until 48 h); and (4) determining the effect of the presence of small organic ligands, such as histidine, glycine, and citric acid. These compounds are surrogates of the binding ability of naturally occurring ligands that can influence the environmental fate of both the QD and the toxic metals that constitutes the QD.
Materials and methods Materials
The orange CdTe/CdS carboxyl-terminated QD from Vive Nano Inc. was used for this study. Accordingly with the manufacturer, this QD has a core of CdTe with a diameter of 3–4 nm and a coating of CdS, with a total nominal size of 6– 10 nm. A high molecular weight (>100 kDa) poly(acrylic) acid (PAA) derivative is used as a stabilizer around the QD. All solutions were prepared in ultrapure water from a MilliQ Integral 3 (resistivity>18 MΩcm). The Cd stock solu-tion was prepared from dilusolu-tion of the Cd standard solusolu-tion (1,000 mg/L Merck), and the NaNO3used to adjust the ionic
strength solution was prepared from the solid (Merck, Suprapur). The media pH was controlled by using 5×10⁻³M MES (2-(N-morpholino)ethanesulfonic acid, Sigma) for experiments performed at pH 6, and 5×10⁻³M HEPES (4-(2-hydroxyethyl)piperazine-1-ethanesulfonic acid, Sigma) for experiments run at pH 8.5. Preliminary experiments, under the exact same conditions used in this work, show the absence of the complexation capacity of these buffers towards Cd. No buffer was used at pH 4.5 for two reasons (1) the pH was easily kept constant during the 48 h of exposure time, and (2) the addition of a citrate buffer to control the pH would inter-fere with the aim of this work. HNO3(Merck, Suprapur) and
NaOH (Merck, p.a.) solutions were used to adjust the pH, which was measured using a Denver Instrument (model 15) and a Radiometer analytical combination pH electrode, cali-brated with standard NBS buffers.
SSCP and AGNES
The SSCP (Pinheiro and van Leeuwen 2004; Domingos et al. 2007, 2008) and AGNES techniques (Companys et al.
2005; Domingos et al.2008) are described in the Supporting information. SSCP and AGNES experiments were per-formed using an Eco Chemie μAutolab III potentiostat in conjunction with a Metrohm 663VA stand and a personal computer using the GPES 4.9 software (Eco Chemie). Electrodes included a Ag/AgCl reference electrode with a 0.1 M NaNO3salt bridge, a glassy carbon counter electrode,
glassy carbon disk (1.9 mm diameter, Metrohm) as the working electrode for the SSCP experiments and an hanging mercury drop electrode (radius 1.41×10⁻⁴m, Merck mercu-ry p.a.) for the AGNES experiments. All solutions were purged with nitrogen for 20 min prior to the voltammetric experiments, and the measurements were carried out at room temperature (18–20 °C).
SSCP parameters
The potential was held at Edfor the duration of the
deposi-tion time, td(45 s), during which Cd is accumulated on the
working electrode. After the accumulation step an oxidizing strip current, Is, of 5×10⁻⁶A was applied in quiescent
solu-tion until the potential reached a value sufficiently beyond the transition plateau (−0.3 V). The Is value correspond to
conditions that approached complete depletion. The SSCP waves were constructed from a series of measurements made over a range of deposition potentials, Ed. The raw
signal is a measurement of the variation of potential with time that is automatically converted to the dt/dE vs. E format.
AGNES parameters
A differential pulse polarography experiment with the larg-est mercury drop (radius 2.03×10⁻⁴m, so that the planar electrode expression (Galceran et al. 2004) applies), and with a modulation amplitude of 0.04995 V, was performed along with the calibration in order to obtain the E1 value
(corresponding to a desired Y) for the AGNES experiment. The potential program for Cd consists in applying two potential steps in the first stage: (1) E1,a under reduction
diffusion-limited conditions, corresponding to Y1,a=1×10⁸
for t1,a=100–600 s (with stirring); (2) E1,bcorresponding to
Y= 100 for t1,b= 300–1,800 s. The waiting time (without
stirring) was tw= 50 s; (3) E2 corresponding to Y1,a= 1 ×
10−8 under re-oxidation diffusion-limited conditions for 50 s, with the response current being read at t2=0.20 s.
The program Visual MINTEQ (version 2.5.3) (Allison et al.1999) was used to determine the free metal concentration along the calibration in order to calculate the h-value (a proportionality factor). The blank was made with Y=0.01, which is a negligible Y compared to the one used on the main measurement.
Each SSCP and AGNES experiments included a calibra-tion plot measured at 1×10⁻⁶M of Cd, and at low pH (<4) in order to avoid losses to the polystyrene container walls. QD samples were prepared by dilution of the stock solution (total Cd concentration of 5.4 × 10⁻⁵M) into a prepared electrolyte solution (Milli-Q water with adjusted pH and ionic strength, and the small organic ligand) to give a final Cd concentration of 1 × 10⁻⁶M. Samples were prepared
using a range of solution conditions: pH 4.5–8.5, ionic s t r e n g t h 0 . 0 1 M , a n d h i s t i d i n e ( S i g m a - A l d r i c h , ReagentPlus), glycine (Sigma, ReagentPlus), and citric acid (Sigma-Aldrich, puriss) concentrations of 3×10⁻⁵–3×10⁻⁴, 3×10⁻³–1×10⁻², and 3×10⁻⁴–3×10⁻³M, respectively. The solutions were followed by SSCP and AGNES immediately after the dispersion of the QD (with an average delay time of 5 min), and after 24 and 48 h of the preparation. Preliminary experiments performed at the lower pH value showed that the maximum dissolution was attained after 24 h. Therefore, all experiments were followed during 48 h, in order to show that the thermodynamic equilibrium was attained. All stud-ies were performed at room temperature, and between the measurements the QD dispersions were kept in the dark at room temperature.
Atomic force microscopy
The adsorption and drop deposition methods were used to prepare QD samples for atomic force microscopy (AFM) (AFM Digital Instruments Nanoscope IIIa extended, Dimension 3100). For the adsorption method, freshly cleaved muscovite mica sheets were suspended in the sol-utions containing the QD for 20 min. Following their re-moval, the mica sheets were gently rinsed by immersion in deionized water. For the drop deposition technique, 5μL of sample was pipetted onto freshly cleaved mica and then allowed to dry overnight in an enclosed Petri dish. The histogram was based on at least 20 AFM images taken from different areas of the mica containing the QD.
Electrophoretic mobility
Electrophoretic mobility (EPM) measurements were carried out using a Malvern Zetasizer Nano-ZS using disposable polystyrene cuvettes (Malvern, DTS1061) at 20 °C. Samples were prepared in an identical manner as for the voltammetric experiments.
Optical measurements
Photoluminescence spectra were recorded on a Fluorolog Horiba Jobin Yvon fluorescence spectrometer with the ex-citation wavelength set at 400 nm. The QD experimental solutions had been prepared in an identical manner to those used in the SSCP experiments. The results obtained in the different replicates were almost totally concordant; the max-imum wavelength drift was on the order of 0.03 nm.
All results are presented as the mean and standard devi-ation of three replicates or more performed on different days with freshly prepared samples. For the EPM each replicate run was the mean of at least five measurements, and errors were determined from means obtained from the replicate
runs rather than from replicate measurements. SSCP results are shown as the percentage of Cd dissolved from the QD related with the total Cd present in the QD (1.0×10⁻⁶M).
Results and discussion
The size of the QD was determined by AFM. The presence of the buffers (MES or HEPES) on the QD dispersions led to the formation of a film on the mica surface not allowing the exact quantification of the QD diameters under the various pH values. Thus, AFM observations were performed for QD dispersed in Milli Q water (pH 6.4). The number average diameter (5.7±0.4 nm) obtained from the AFM height meas-urements is in good agreement with previously reported val-ues for the exact same QD batch by both AFM (5.9±3.4 nm) and TEM (6.5±1.9 nm) (Domingos et al.2009).
Measured EPM values indicated stable dispersions of these coated QD; pH 4.2: −0.51±0.04 μmcmV−1s−1, pH 6.0:−1.5±0.4 μmcmV−1s−1, and pH 8.4:−4.2±0.3 μm cmV−1s−1. At lower pH values the negative charges of the carboxyl groups will start to be neutralized, and particle– particle interactions could result in aggregates.
QD-only effect of pH
The largest QD dissolution (i.e., percentage of Cd dissolved from the QD related to the total Cd in the QD) was observed at pH 4.5 (Fig.1; (24±12)% immediately after QD dispersion increasing to (52.0 ±8.2)% after 48 h of exposure time). Accordingly with the manufacturer, the QD is prepared from a CdTe core with a diameter of approximately 4 nm, which corresponds to 35 % of the total volume of the QD (5.7± 0.4 nm). Given the densities of CdTe and CdS (5.85 and 4.82 gcm−3, respectively), the Cd contained in the shell would correspond to 72 % of the total Cd. Therefore, the free Cd in solution after 48 h corresponds to the solubilization of the CdS
shell. At this pH all Cd is in its free form as indicated by the obtained Ed,1/2(identical to the metal-only Ed,1/2; the shift in
the half-wave deposition potential depends upon the complex-ation strength). The solubility of CdS is strongly dependent on the pH up to 5 becoming nearly independent for higher pH values (Westerflier et al.1987). Moreover, Vučemilović found an increase in the solubility product (Ksp) with the decrease of
the particle size; from 7.2×10⁻²⁷ to about 10−15M for CdS colloids varying from 25 nm to less than 2.5 nm (Vučemilović et al. 1988). Wang and Tessier (1999) determined a Kspof
1.5×10⁻¹⁵for a crystalline product of less than 2μm size, and 4.0×10⁻¹⁵ and 7.1×10⁻¹⁵ for two precipitates of less than 0.2μm. Such variations are not only attributed to the particles size and the dependence on the pH, but also to the use of mixed Cd-sulfide phases, the uncontrolled loss of sulfide during the course of equilibration, and the incomplete separa-tion of solid CdS particles from solusepara-tion (Wang and Tessier
1999). A large diversity of literature values is also found for the second H2S dissociation constant; published values cover
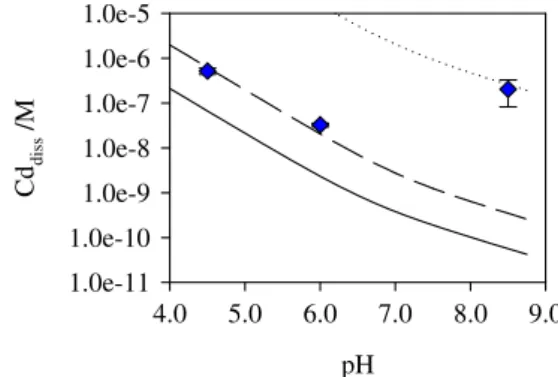
a range of 7 orders of magnitude, ranging from 10−12M to 10−19M (Sun et al.2008). This variation is due to the difficulty of accurately measure the HS− and S2− concentrations in solution. The large uncertainty involved in these constants will lead to considerable differences in calculated dissolved Cd compared with the experimental results. Figure2 shows calculated dissolved Cd as a function of pH by using different values for pKspand pKa2. A dissolved Cd of 6.7×10⁻⁸M is
calculated at pH 4.5 (corresponding to 6.7 % of the total Cd cf. 52 % by SSCP) when using constants given by Smith and Martell (1989a), namely the CdS solubility product of 1.6× 10⁻²⁶M, and H2S pKa,1and pKa,2of 7.0 and 13.8, respectively
(solid line of Fig.2). A lower value of pKspsuch as 18.8 (Yang
et al.2001) provides a much larger dissolved Cd (dotted line of Fig.2), whereas by using the same solubility product given by Smith and Martell ( 1989a) and a larger pKa2 (15.0
texp /h 0 10 20 30 40 50 60 Cd diss /% 0.0 10.0 20.0 30.0 40.0 50.0 60.0 70.0
Fig. 1 Percentage of dissolved Cd as function of exposure time, obtained for the QD at pH 4.5 (red triangle), 6.0 (blue diamond), and 8.5 (green circle) pH 4.0 5.0 6.0 7.0 8.0 9.0 Cd diss /M 1.0e-11 1.0e-10 1.0e-9 1.0e-8 1.0e-7 1.0e-6 1.0e-5
Fig. 2 Concentration of dissolved Cd as function of pH. The lines represent the calculated dissolved Cd by using different parameters: solid line—pKa1=7.0, pKa2=13.8, pKsp=25.8 (Allison et al. 1999); long dash line—pKa1= 7.0, pKa2= 15.0 (Westerflier et al. 1987), pKsp=25.8; dotted line—pKa1=7.0, pKa2=13.8, pKsp=18.8 (Yang et al.2001). The points represent the experimental values for an exposure time of 48 h.
(Westerflier et al.1987)) a good agreement is obtained be-tween the calculated dissolved Cd and the one obtained ex-perimentally by using the SSCP technique (pH 4.5: 55 % of the total Cd cf. 52 % by SSCP; pH 6.0: 1.8 % of the total Cd cf. 3.3 % by SSCP).
As expected at pH 6.0 the dissolved Cd obtained is much lower than at pH 4.5; (1.93±0.87)% immediately after the QD dispersion increasing to (3.28 ± 0.30) % after 48 h (Fig.1). The SSCP value is in concordance with the calcu-lated solubility by using the pKa2=15.0 (long dash line of
Fig. 2). The Ed,1/2 values at this pH are slightly more
negative than the one for the metal-only (approximately 5 mV), suggesting that the–COO−groups of the PAA are virtually not complexing the dissolved Cd. Although, a larger displacement of the ΔEd,1/2 is observed at pH 8.5
(−0.057±0.004 V immediately after the QD addition to the electrolyte solution). This indicates that the dissolved Cd is being complexed by the–COO−groups leading to both an increase of the QD dissolution until the equilibrium is attained (Fig.1) and a great difference between the exper-imental dissolved Cd and the one calculated (long dash line of Fig.2). The different binding capacity at both pH values is explained by the dissociation constants of the PAA reported in the literature; pKa,1=4.8–5.4, and pKa,2=6.5–
7.5 extrapolated to I=0 M at 25 °C for PAA with molecular weights from 2 to 750 kDa (Katchalsky1954; Hogfeldt et al. 1989; de Stefano et al. 2000,2003; David et al. 2008; Crea et al.2009; de Stefano et al.2010). Accordingly with these values the largest dissociation degree of the PAA, and, therefore, the largest binding capacity for Cd would be expected at pH 8.5.
The dissolution of the QD will in turn decrease the size of these particles. An attempt to quantify the dissolution by measuring the QD size was performed in order to compare with the voltammetric results; however, a size decrease of only 0.2 and 1.18 nm would be expected for 10 and 50 % of QD dissolution, respectively. These small decreases are within the errors found for the AFM (±0.4 nm) or the TEM (±1.9 nm) (Domingos et al.2009) techniques, indicat-ing the difficulty that would be the quantification of any decrease on the QD size for the conditions studied by using the microscopy techniques.
The QD changes triggered by the pH variation were also followed by photoluminescence: the shift in the peak wave-lengths of a fluorescence spectrum depends upon the surface changes of the particle. This is a well-established method and is possible because the density of electronic energy levels in these NPs changes as function of the NP surface effects (Yu et al.2003; Peng et al.1998). The comparison of the maximum wavelengths (lmax) of the various
fluores-cence spectra shows a decrease with the decrease of the pH (Table1); at pH 4.5 no signal was obtained which is an evidence of the major changes in the particle suggesting
the total dissolution of the CdS shell. According to the manufacturer the CdTe core fluorescence is weak and irreproducible.
Although at the higher pH values no significant dissolu-tion was obtained, at pH 6.0 a decrease on the lmax is
observed after 24 h, whereas at pH 8.5 no variation is observed (Table 1). In order to obtain more details on the lmaxdecrease at these more acidic pH values the PL spectra
were measured with intervals of approximately 5 min. A gradual decrease of the lmaxwas obtained during the first
30 min after what the value kept constant and nearly the same as the one obtained after 24 h. This indicates the importance of the exposure time after a QD surface pertur-bation. At higher pH values the NPs have a much better surface passivation because the polymer is mostly ionized (Celebi et al. 2007), which results in a much more stable fluorescence intensity; in fact ViveNano Inc. provides the QD stock at pH 9.0. Despite the better surface passivation given by the polymer at the higher pH values the stability of the QD will also depend not only on the environmental pH but also on the pKaof the stabilizer. Indeed, an increase of
the complexed Cd by the PAA is observed at the higher pH Table 1 Maximum wavelengths (1max) of the PL spectra obtained for the QD dispersions in absence and presence of the small organic ligands at various pH values as function of exposure time
1max/nm
Ligand CLigand/M texp=0 h texp=24 h texp=48 h pH=5.0 – – 648 ns ns pH=5.5 – – 667 637 639 pH=6.0 – – 673 651 655 Cit 3×10⁻⁴ 664 647 651 3×10⁻³ 664 647 643 Gly 3×10⁻³ 667 646 645 1×10⁻² 663 648 646 His 1×10⁻⁴ 657 649 646 3×10⁻⁴ 659 651 650 pH=8.5 – – 691 694 689 Cit 3×10⁻⁴ 677 664 650 3×10⁻³ 666 661 667 Gly 3×10⁻³ 665 666 662 1×10⁻² 667 661 664 His 1×10⁻⁴ 666 665 665 3×10⁻⁴ 664 663 664
At pH4.5 no signal was obtained for all different conditions ns no signal was obtained
value leading to a greater QD dissolution (higher dissolution at pH 8.5 than at pH 6.0; Fig.1). Regardless of the decrease of the cation and surface binding ability at low pH values, an obvious advantage for the QD stability, the partial proton-ation of the PAA carboxylates results in a decrease of the electrostatic repulsion collapsing the polymer, and leading to a decrease of the effective surface passivation.
QD in presence of small organic ligands
The effects of the small organic ligands were not studied at the pH 4.5 due to the extent of the QD dissolution at this pH value. Note that at pH 8.5 our calculations of the dissolved Cd are approximated due to the influence of the mix diffu-sion coefficients of the different ligands present in solution, PAA, and the small organic ligand (see SI, pages 4 and 5). Citric acid
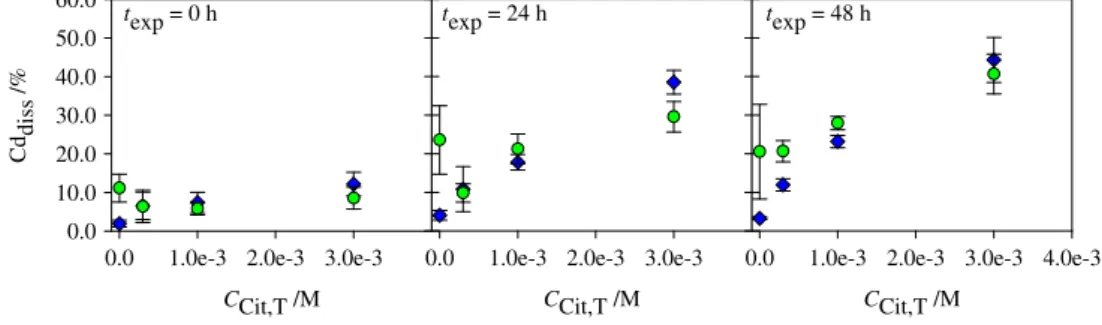
For both pH values and for all exposure times the presence of citric acid results in the increase of the dissolved Cd with the increase of the citric acid concentration (Fig. 3). However, no significant differences on the dissolved Cd were obtained at both pH values (6.0 and 8.5) and for all exposure times (Fig. 3). The largest effect is observed for 3.0×10⁻³M of citric acid after 48 h where the dissolved amount is 13× and 2× larger at pH 6.0 and 8.5, respectively, than in its absence (Fig.3). The citric acid presence induces a significant increase of the QD dissolution even at pH 6.0 and immediately after the QD addition to the solution (delay time of 10 min). The citric acid is an effective ligand for Cd at this pH value due to the protonation constants (pKa,1=3.1,
pKa,2=4.8, and pKa,3=6.4 (Smith and Martell1989b)), and the
formation of CdCit−, CdHCit, and CdCit24− complexes. At
pH 8.5 the QD dissolution is already substantial thus the effect of citric acid is only evident for the highest concentration. Glycine and histidine
At pH 6.0 no effect of the presence of both these ligands is observed (Figs.4and5, respectively). This can be explained by the low binding capacity of these ligands regarding Cd at
this pH as shown in Table S1(values obtained using Visual MINTEQ version 2.5.3 (Allison et al.1999)).
Dissolved Cd concentrations were always lower in pres-ence of glycine at pH 8.5 than in its abspres-ence (Fig.4). Even so, the Cd complexation by glycine can be seen in the slight increase of dissolved Cd with both increasing glycine con-centration and exposure time (according with the proton-ation constants showed in Table S1, pKa,1=2.4 and pKa,2=
9.8 (Kiss et al.1991)). Nonetheless, these results show that glycine, under the concentrations and exposure times stud-ied here, act against the QD dissolution, probably by pro-tecting the QD-native ligand system by pushing the adsorption/desorption equilibrium toward a state with more bound PAA ligands (Knowles et al.2012; Morris-Cohen et al. 2012). Probably the glycine protecting effect would not be observed for larger glycine concentrations as Fig.4show an increase of dissolved Cd with the glycine concentration. Figure 5 shows an increase of dissolved Cd with the histidine concentration after 5 min of exposure time and at pH 8.5, similar to the observed effect of citric acid. This was expected since histidine is an effective ligand for Cd at this pH as can be observed in Table S1(pKa,1=1.8, pKa,2=6.0,
and pKa,3=9.2 (Pettit1984)). At 24 h no significant
differ-ence can be observed in absdiffer-ence and presdiffer-ence of histidine, however, the experimental reproducibility in presence of this ligand is quite poor generating large errors. The exper-imental results at 48 h become extremely irreproducible and even in some replicates the SSCP signal was below the detection limit. Additionally, we observed a pro-nounced shift in the Ed,1/2 between 24 and 48 h
(ap-proximately−30 mV) indicating the formation of much strong complexes, which may be non-labile. The computation per-formed in this work assumes that the complexes are labile thus the appearance of non-labile complexes results in an underes-timation of the dissolved Cd. Furthermore, the small signals obtained at 48 h yield larger errors. These observations show that the strength of the Cd complexes in solution is increasing with time suggesting that histidine is inducing changes in the local environment of the QD surface (Rotureau and van Leeuwen2008).
It is extremely difficult to speculate about the mechanism of these ligands sorption and the particular trends based on
texp = 0 h
CCit,T /M
0.0 1.0e-3 2.0e-3 3.0e-3
Cd diss /% 0.0 10.0 20.0 30.0 40.0 50.0 60.0 texp = 24 h CCit,T /M
0.0 1.0e-3 2.0e-3 3.0e-3
texp = 48 h
CCit,T /M
0.0 1.0e-3 2.0e-3 3.0e-3 4.0e-3
Fig. 3 Percentage of dissolved Cd as function of citric acid concentration at exposure times of 0, 24, and 48 h, obtained for the QD in presence of citric acid at pH6.0 (blue diamonds) and 8.5 (green circles)
each organic compound properties. Citric acid is a weak carboxylic acid whereas glycine and histidine are amino acids (glycine is the smallest of the amino acids and histi-dine beside the amino group also has an imidazole function-al group). EPM measurements shows that the addition of the highest citric acid concentration did not change the charge of the QD dispersion along all pH range studied (4.5–8.5). However, the presence of the largest glycine and histidine concentrations resulted in less negative EPM values at pH 8.5 (−1.1±0.6 μmcmV−1s−1 in presence of glycine,
and −0.6± 0.4 μmcmV−1s−1 in presence of histidine cf.−4.8±0.2 μmcmV−1s−1for the QD-only case). Unlike citric acid the presence of glycine or histidine under these conditions thus in fact destabilizes the charge, which may change the surface properties of the particles. The destabili-zation of the charge is much probably related with the presence of the amino groups of glycine and histidine. However, further studies are needed to evaluate the mecha-nism of these ligands sorption and the implications for the QD stability.
Photoluminescence of the QD in presence of the organic ligands
At pH 8.5 the lmax decreases approximately for the same
value in presence of the ligands (Table1). This decrease is independent of the ligand added and of the exposure time, which suggests that is only the fact of an added ligand that provokes an immediate perturbation of the QD surface. A slight decrease of thelmax is observed in presence of the
various ligands at pH 6.0 and immediately after the addition of the QD to the electrolyte solution, with no significant
differences obtained after 24 h in absence or presence of the ligands (Table1). Since all these organic ligands are acids the pH value will dramatically change the dynamic interac-tion with the metal ion, contributing to a particle surface modification until the equilibrium is attained, which will change the effective surface passivation.
Conclusions
In this work we present evidence that Cd is released from core/shell QD not only at low pH but also at higher pH values in the presence of complexing ligands. Furthermore, time was observed to be a critical factor influencing nano-particles stability with various physicochemical conditions observed to equilibrate in different time windows (this point will also be the object of a future paper). The presence of the stabilization polymer can lead to a greater dissolution of the NP at higher pH values, which is dependent on the proton-ation constants of the polyacid. Moreover, the presence of small organic ligands can also accelerate the weathering of the NP by chelating the dissolved Cd and increase the driving force for dissolution, which is dependent not only on their protonation constants and concentrations used but also on the physicochemical nature of the ligand. These findings suggest that in the natural aquatic environment or even when the QD are used in biological and medicinal proposals, the dissolved Cd concentration and also the bio-available Cd might occur to a much greater extent than predicted by laboratory measurements increasing their tox-icity. Nevertheless, if the QD are used for photovoltaic, photocatalytic, sensing, or light-emitting purposes the
texp = 0 h
CGly,T /M
0.0 3.0e-3 6.0e-3 9.0e-3
Cd diss /% 0.0 10.0 20.0 30.0 40.0 texp = 24 h CGly,T /M
0.0 3.0e-3 6.0e-3 9.0e-3
texp = 48 h
CGly,T /M
0.0 3.0e-3 6.0e-3 9.0e-3 1.2e-2
Fig. 4 Percentage of dissolved Cd as function of glycine concentration and at exposure times of 0, 24, and 48 h, obtained for the QD in presence of glycine at pH 6.0 (blue diamonds) and 8.5 (green circles)
texp = 0 h
CHis,T /M
0.0 1.0e-4 2.0e-4 3.0e-4
Cd diss /% 0.0 10.0 20.0 30.0 40.0 50.0 texp = 24 h CHis,T /M
0.0 1.0e-4 2.0e-4 3.0e-4
texp = 48 h
CHis,T /M
0.0 1.0e-4 2.0e-4 3.0e-4 4.0e-4
Fig. 5 Percentage of dissolved Cd as function of histidine concentration and at exposure times of 0, 24, and 48 h, obtained for the QD in presence of histidine at pH 6.0 (blue diamonds) and 8.5 (green circles)
emission l is stable at least during 48 h in absence and presence of small organic ligands, only depending on the pH environment. Characterization of all of the surface processes such as the competing ligand equilibria that affect the ad-sorption equilibrium of QD–ligand systems remains a major challenge because of the difficulty in quantitatively charac-terizing the distribution of free and bound ligands in a solution-phase sample. This point will also be the object of a future paper.
Acknowledgment Funding for this work was provided by the Fun-dação para a Ciência e Tecnologia (FCT), Portugal: Science 2008 IST-CQE3“Environmental Chemistry” Assistant Researcher position to RFD and Project PTDC/AAC-AMB/111998/2009. JPP acknowledges the FCT funding support: Project Pest-OE/EQB/LA0023/2011.
References
Aldana J, Wang YA, Peng X (2001) Photochemical instability of CdSe nanocrystals coated by hydrophobic thiols. J Am Chem Soc 123:8844–8850
Aldana J, Lavelle N, Wang Y, Peng X (2005) Size-dependent dissociation pH of thiolate ligands from cadmium chalcogenide nanocrystals. J Am Chem Soc 127:2496–2504. doi:10.1021/ja047000+
Alivisatos P (2004) The use of nanocrystals in biological detection. Nat Biotechnol 22:47–52
Allison JD, Brown DS, Novo-Grada (1999) MINTEQA2/PRODEFA2, A geochemical assessment model for environmental systems, version 3.0. 3rd edn. In Office of Research and Development U.S. Environmental Protection Agency, Athens
Aruguete DM, Guest JS, Yu WW, Love NG, Hochella MF Jr (2010) Interaction of CdSe/CdS core-shell quantum dots and Pseudomonas aeruginosa. Environ Chem 7:28–35. doi:10.1071/ EN09106
Bagalkot V, Zhang L, Levy-Nissenbaum E, Jon S, Kantoff PW, Langer R, Farokhzad OC (2007) Quantum dot–aptamer conjugates for synchronous cancer imaging, therapy, and sensing of drug deliv-ery based on bi-fluorescence resonance energy transfer. Nano Lett 7:3065–3070
Celebi S, Erdamar AK, Sennaroglu A, Kurt A, Acar HY (2007) Synthesis and characterization of poly(acrylic acid) stabilized cadmium sulfide quantum dots. J Phys Chem B 111:12668– 12675. doi:10.1021/jp0739420
Companys E, Cecília J, Codina G, Puy J, Galceran J (2005) Determination of Zn2+concentration with AGNES using different strategies to reduce the deposition time. J Electroanal Chem 576:21–32
Crea F, de Stefano C, Gianguzza A, Pettignano A, Piazzese D, Sammartano S (2009) Acid-base properties of synthetic and nat-ural polyelectrolytes: experimental results and models for the dependence on different aqueous media. J Chem Eng Data 54:589–605. doi:10.1021/je800518j
David C, Companys E, Galceran J, Garcés JL, Mas F, Rey-Castro C, Salvador J, Puy J (2008) Competitive Cd2+/H+complexation to polyacrylic acid described by the stepwise and intrinsic stability constants. J Phys Chem B 112:10092–10100. doi:10.1021/ jp802571f
de Stefano C, Gianguzza A, Piazzese D, Sammartano S (2000) Polyacrylate protonation in various aqueous ionic media at differ-ent temperatures and ionic strengths. J Chem Eng Data 45:876– 881. doi:10.1021/je0000219
de Stefano C, Gianguzza A, Piazzese D, Sammartano S (2003) Polyacrylates in aqueous solution. The dependence of protonation on molecular weight, ionic medium and ionic strength. React Funct Polym 55:9–20
de Stefano C, Gianguzza A, Pettignano A, Sammartano S, Sciarrino S (2010) On the complexation of Cu(II) and Cd(II) with polycar-boxyl ligands. Potentiometric studies with ISE-H+, ISE-Cu2+, and ISE-Cd2+. J Chem Eng Data 55:714–722. doi:10.1021/je9004245 Derfus AM, Chan WCW, Bhatia SN (2004) Probing the cytotoxicity of
semiconductor quantum dots. Nano Lett 4:11–18
Domingos RF, Benedetti MF, Pinheiro JP (2007) Application of per-meation liquid membrane and scanned stripping chronopotenti-ometry to metal speciation analysis of colloidal complexes. Anal Chim Acta 589:261–268
Domingos RF, Huidobro C, Companys E, Galceran J, Puy J, Pinheiro JP (2008) Comparison of AGNES (absence of gradients and Nernstian equilibrium stripping) and SSCP (scanned stripping chronopotentiometry) for trace metal speciation analysis. J Electroanal Chem 617:141–148
Domingos RF, Baalousha MA, Ju-Nam Y, Reid MM, Tufenkji N, Lead JR, Leppard GG, Wilkinson KJ (2009) Characterizing manufac-tured nanoparticles in the environment: multimethod determina-tion of particle sizes. Environ Sci Technol 43:7277–7284. doi: doi:10.1021/es900249m
Domingos RF, Simon DF, Hausser C, Wilkinson KJ (2011) Bioaccumulation and effects of CdTe/CdS quantum dots on Chlamydomonas reinhardtii—nanoparticles or the free ions? Environ Sci Technol 45:7664–7669. doi:10.1021/es201193s Galceran J, Companys E, Puy J, Cecília J, Garcés JL (2004) AGNES: a
new electroanalytical technique for measuring free metal ion concentration. J Electroanal Chem 566:95–109
Gao XH, Cui YY, Levenson RM, Chung LWK, Nie SM (2004) In vivo cancer targeting and imaging with semiconductor quantum dots. Nat Biotechnol 22:969–976
Guo W, Li JJ, Wang AA, Peng X (2003) Luminescent CdSe/CdS core/ shell nanocrystals in dendron boxes: superior chemical, photo-chemical and thermal stability. J Am Chem Soc 125:3901–3909.
doi:10.1021/ja028469c
Hogfeldt E, Miyajima T, Marinsky JA, Muhammed M (1989) Application of a single three parameter mode to titration data for some polyelectrolytes. Acta Chem Scand 43:496–499
Katchalsky A (1954) Problems in the physical chemistry of polyelec-trolytes. J Polym Sci 2:159–184
Kim S, Fisher B, Eisler HJ, Bawendi M (2003) Type-II quantum dots: CdTe/CdSe (core/shell) and CdSe/ZnTe (core/shell) heterostruc-tures. J Am Chem Soc 125:11466–11467
Kirchner C, Liedl T, Kudera S, Pellegrino T, Javier AM, Gaub HE, Stolzle S, Fertig N, Parak WJ (2005) Cytotoxicity of colloidal CdSe and CdSe/ZnS nanoparticles. Nano Lett 5:331–338 Kiss T, Sóvágó I, Gergely A (1991) Critical survey of stability
con-stants of complexes of glycine. Pure Appl Chem 63:597–638 Klimov VI, Mikhailovsky AA, Xu S, Malko A, Hollingsworth JA,
Leatherdale CA, Eisler H-J, Bawendi MG (2000) Optical gain and stimulated emission in nanocrystal quantum dots. Science 290:314–317. doi:10.1126/science.290.5490.314
Kloepfer JA, Mielke RE, Wong MS, Nealson KH, Stucky G, Nadeau JL (2003) Quantum dots as strain- and metabolism-specific mi-crobiological labels. Appl Environ Microbiol 69:4205–4213 Knowles KE, Frederick MT, Tice DB, Morris-Cohen AJ, Weiss EA
(2012) Colloidal quantum dots: think outside the (particle-in-a-) box. J Phys Chem Letters 3:18–26. doi:10.1021/jz2013775 Mahendra S, Zhu H, Colvin VL, Alvarez PJ (2008) Quantum dot
weathering results in microbial toxicity. Environ Sci Technol 42:9424–9430
Mattoussi H, Mauro JM, Goldman ER, Anderson GP, Sundar VC, Mikulec FV, Bawendi MG (2000) Self-assembly of CdSe-ZnS
quantum dot bioconjugates using an engineered recombinant pro-tein. J Am Chem Soc 122:12142–12150. doi:10.1021/ja002535y Michalet X, Pinaud F, Lacoste TD, Dahan M, Bruchez MP, Alivisatos AP, Weiss S (2001) Properties of fluorescent semiconductor nanocrystals and their apllication to biological labelling. Single Mol 2:261–276 Morris-Cohen AJ, Vasilenko V, Amin VA, Reuter MG, Weiss EA
(2012) Model for adsorption of ligands to colloidal quantum dots with concentration-dependent surface structure. ACS Nano 6:557–565. doi:10.1021/nn203950s
Peng XG, Wickham J, Alivisatos AP (1998) Kinetics of II–VI and III–V colloidal semiconductor nanocrystal growth:“focusing” of size dis-tributions. J Am Chem Soc 120:5343–5344. doi:10.1021/ JA9805425
Pettit LD (1984) Critical survey of formation constants of complexes of histidine, phenylalanine, tyrosine, L-dopa and tryptophan. Pure Appl Chem 56:247–292
Pinheiro JP, van Leeuwen HP (2004) Scanned stripping chronopoten-tiometry of metal complexes: lability diagnosis and stability com-putation. J Electroanal Chem 570:69–75
Priester JH, Stoimenov PK, Mielke RE, Webb SM, Ehrhardt C, Zhang JP, Stucky GD, Holden PA (2009) Effects of soluble cadmium salts versus CdSe quantum dots on the growth of planktonic Pseudomonas aeruginosa. Environ Sci Technol 43:2589–2594 Rotureau E, van Leeuwen HP (2008) Kinetics of metal ion binding by
polysaccharide colloids. J Phys Chem A 112:7177–7184.
doi:10.1021/jp800472g
Smith RM, Martell AE (1989a) Critical stability constants—inorganic complexes. Critical stability constants. Plenum, New York Smith RM, Martell AE (1989b) Critical stability constants—other
organic ligands. Plenum, New York
Sun W, Nešić S, Young D, Woollam RC (2008) Equilibrium expres-sions related to the solubility of the sour corrosion product mack-inawite. Ind Eng Chem Res 47:1738–1742. doi:10.1021/ ie070750i
Tessler N, Medvedev V, Kazes M, Kan S, Banin U (2002) Efficient near-infrared polymer nanocrystal light-emitting diodes. Science 295:1506–1508. doi:10.1126/science.1068153
Vučemilović MI, Vukelić N, Rajh T (1988) Solubility and photocorro-sion of small CdS particles. J Photochem Photobiol A Chem 42:157–167
Wang F, Tessier A (1999) Cadmium complexation with bisulfide. Environ Sci Technol 33:4270–4277. doi:10.1021/es990283z Westerflier SWFMHT, Kolar Z, Binsma JJM, Stein HN,
Vandecasteele C (1987) Solubility of particulate cadmium sulfide at pH = 1–14: a radiotracer study. J Radioanal Nuclear Chem 111:305–317
Yang C-S, Awschalom DD, Stucky GD (2001) Kinetic-dependent crystal growth of size-tunable CdS nanoparticles. Chem Mater 13:594–598. doi:10.1021/cm0005384
Yu WW, Qu LH, Guo WZ, Peng XG (2003) Experimental determina-tion of the extincdetermina-tion coefficient of CdTe, CdSe and CdS nano-crystals. Chem Mater 15:2854–2860. doi:10.1021/CM034081K