Since January 2020 Elsevier has created a COVID-19 resource centre with
free information in English and Mandarin on the novel coronavirus
COVID-19. The COVID-19 resource centre is hosted on Elsevier Connect, the
company's public news and information website.
Elsevier hereby grants permission to make all its COVID-19-related
research that is available on the COVID-19 resource centre - including this
research content - immediately available in PubMed Central and other
publicly funded repositories, such as the WHO COVID database with rights
for unrestricted research re-use and analyses in any form or by any means
with acknowledgement of the original source. These permissions are
granted for free by Elsevier for as long as the COVID-19 resource centre
Contents lists available atScienceDirect
Annals of Tourism Research
journal homepage:www.elsevier.com/locate/annalsRESEARCH ARTICLE
Tourism, smart specialisation, growth, and resilience
João Romão
University of Algarve, Portugal
A R T I C L E I N F O Associate editor: Ritchie Brent JEL classification:
C33 Panel Data Models
R58 Regional Development Planning and Policy Z32 Tourism and Development
Keywords:
Regional development Innovation Variety
Tourism led growth Unemployment Panel data
A B S T R A C T
This work analyses the implications of tourism dynamics and smart specialisation strategies on growth and socioeconomic resilience of European regions where tourism is a regional priority. By using a panel data model for 2006–2017, phases of growth, recession, and recovery are scruti-nised. A convergence process is identified, with higher growth rates for less-developed regions; however, the most developed regions are more resilient. Tourism demand is positively correlated with growth and resilience but a high share of tourism within regional employment has negative impacts on both. Specialisation patterns combining tourism with agriculture have positive effects in both cases. Diversification strategies including unrelated sectors contribute to increased re-silience in these regions, and a prioritisation of construction reduces regional rere-silience.
Introduction
The provision of tourism products and services in a destination calls for the contribution of a varied set of economic activities, constituting a decentralised value chain, and this enables the creation of different links and interactions within local and regional economic structures. As a place-based activity, where attractiveness depends on local characteristics, tourism potentially contributes to the emergence and consolidation of place-based networks embedded in the territory (Lazzeretti et al., 2016;Romão, 2019). Thus, different types of relatedness—interrelations potentially established between economic sectors based on different forms of proximity (Neffke et al., 2009)—can be observed for the tourism sector (Aarstad et al., 2016). This can be considered a path-dependent mechanism (Boschma & Martin, 2010): different processes of co-creation (Boes et al., 2016) based on pre-existing tourism dynamics, economic structures, or interactions between tourism companies and the surrounding ecosystem enable and constrain opportunities for further development.
Relatedness (Balland et al., 2019) is also one of the core concepts of the smart specialisation approach (Foray & Hall, 2011) to regional innovation strategies (Foray et al., 2012;McCann & Ortega-Argilés, 2015) currently implemented in European regions (RIS3, for 2014–2020). Despite some institutional differences between countries and regions, these strategies are normally undertaken at the NUTS 2 territorial level, being defined and executed under the leadership of regional authorities. The Smart Specialisation Platform (COMM/JRC/J2/—https: //s3platform.jrc.ec.europa.eu/) supports and coordinates these planning processes within the European Union while sharing information on the plans being implemented. In particular, the available information demonstrates the priority sectors defined in each region.
This information is integrated into the analytical models developed in this work, constituting thefirst empirical assessment of the interrelations between tourism dynamics, sectorial specialisation, and regional economic performance. Considering the conceptual
https://doi.org/10.1016/j.annals.2020.102995
Received 14 November 2019; Received in revised form 29 June 2020; Accepted 30 June 2020 E-mail address:[email protected].
Available online 10 July 2020
0160-7383/ © 2020 Elsevier Ltd. All rights reserved.
approaches to the potential role of tourism within smart specialisation strategies (Bellini et al., 2017;Weidenfeld, 2018), this em-pirical analysis of the role and relatedness of the tourism sector within regional economic structures (Aarstad et al., 2016) in the context of the implementation of regional innovation strategies constitutes thefirst original contribution of this work. The analytical model developed identifies the most significant sectors contributing to economic growth in these regions where tourism is assumed to be a sectorial strategic priority. The results show that several types of relatedness can be explored, suggesting that regions should define specific strategic approaches according to their territorial characteristics and strengths, confirming the general principles proposed by the smart specialisation approach.
The comparable available data with relevance for this model relate to the period from 2006 to 2017, comprising phases with different economic conditions: growth, a general international recession, and then a process of recovery. Thus, it is possible to assess the relation between tourism and economic dynamics in two perspectives. Thefirst perspective is a ‘traditional’ analysis of the ‘tourism-led growth’ (TLG) hypothesis, performed by establishing a link between tourism performance and economic growth. This has been widely tested in different moments and locations (Brida, Cortes-Jimenez & Pulina, 2016). The analysis performed in this work partially confirms the TLG by identifying a positive correlation between tourism demand and economic growth. However, different impacts of regional specialisation in tourism are observed when examining the share of the sector within the regional value added (positive effect) or within the regional employment (negative effect). These results confirm the conclusions recently obtained byRomão and Nijkamp (2018)for a broader set of European regions. In terms of policies for regional tourism development, a focus on increasing value added is preferable compared with the efforts to increase tourism demand through the development of labour-intensive services.
The second perspective offers new opportunities for the analysis of the economic impacts of tourism, once it allows for the identification of different types of effects on regional resilience - the ability of regional economic structures to recover after the impact of a negative economic shock (Martin, 2012;Modica & Reggiani, 2014). Inspired by the formulations proposed byMartin et al. (2016), vulnerability, shock absorption, and recovery processes are observed. Constituting afirst empirical assessment of these aspects at the international level, this is the second original contribution of this work. Examples in the literature have focused on specific regional or national cases, as exemplified byCellini and Cuccia (2015),Romão et al. (2016), orGiannakis and Bruggeman (2017). The results obtained allow the identification of different impacts from tourism demand, level of specialisation in tourism, or diverse forms of relatedness, according to the economic contexts under analysis, offering new insights when compared with the analyses that have exclusively focused on the relations between tourism and growth. In particular, policies oriented to promote the development of labour-intensive tourism services with low value added may have negative impacts on the regional economies by increasing their vulnerability and reducing resilience.
The regional level of analysis is the NUTS 2 regions (following the classification by Eurostat); it is the most common territorial level for the definition of regional innovation strategies (RIS 3) within the EU. Although they are not tourism destinations (they can be relatively heterogeneous, eventually including very different destinations), NUTS 2 regions are normally institutionally coherent along the European space and comprise different types of governance bodies with interventions at the same spatial scale (e.g. innovation policies, socioeconomic development strategies, cultural promotion, environmental protection). Additionally, these re-gions always include both urban (where the largest cities are located, normally including an administrative capital) and rural areas. This institutional frame legitimises the discussion of strategic policy implications and recommendations. For all the regions under analysis, there is a regional authority responsible for the definition and execution of the RIS.
The conceptual framework for this analysis is described in Section 2, starting with a discussion of the potential relatedness of tourism within strategies of smart specialisation and complemented by a synthesis of the literature on the relations between tourism dynamics, economic growth, and resilience. The (secondary) data and methodology are presented in Section 3, and a synthesis of the results of the different panel data model estimations is presented in Section 4. In particular, the impacts of tourism dynamics and sectorial specialisation priorities on types of economic aspects (growth, vulnerability, shock absorption, and recovery) are empha-sised because this constitutes the main novelty of this work. Section 5 concludes with a discussion on the implications of the types of relatedness for the tourism sector on regional growth and resilience, and policy implications and the (re)formulation of RIS are highlighted.
Conceptual framework
Tourism, relatedness, and regional innovation networks
This work analyses the role of tourism within broad regional economic development and innovation strategies, rather than focusing on destination management. Relying on contributions from different economic sectors, tourism generally includes the traditional hospitality services related to accommodation and food provision, characterised by a high ‘knowledge proximity’ (Boschma et al., 2013;Davids & Frenken, 2018) based on common products, services, organisations, processes, technologies, or markets. However, tourism may also establish relations with activities with lower knowledge proximity, for example, the production of food and beverages, retail and entertainment, mobility and transports, or energy production. In this case, geographical, cultural, and institutional proximity may play a relevant role enabling such interactions (Aarstad et al., 2016;Erkuş-Öztürk, 2016).
Other activities potentially included in the broad scope of tourism supply are the environmental services and open-air activities related to natural features and landscapes, which may contribute to destination differentiation while requiring measures for the protection of sensitive ecosystems (Hassan, 2000), potentially involving specialised scientific knowledge and technologies. Moreover, the emergence of new patterns of consumption and production in contemporary creative economies (Scott, 2007) increases the
relevance of educational and cultural services and facilities, including the material and immaterial aspects of local heritage shaping the uniqueness of tourism experiences (Tussyadiah, 2014). Acknowledging the importance of these activities, theOECD (2014, p.14) identifies a set of ‘creative industries’ with relevance to the development of ‘creative tourism’, including advertising, animation, architecture, design,film, gaming, gastronomy, music, performing arts, software and interactive games, and ‘traditional’ television and radio. These are defined as ‘knowledge-based creative activities that link producers, consumers and places by utilising tech-nology, talent or skill to generate meaningful intangible cultural products, creative content and experiences’.
Place-based determinants of destination attractiveness that influence the set of services available are complemented by other characteristics of tourism activities that reinforce the importance of local and regional networks (European Commission, 2006; Hjalager, 2010; Racherla et al., 2008). Co-terminality (direct interaction between producers and consumers of tourism services), temporality, and spatiality (production and consumption occur simultaneously, in the same place) potentially contribute to en-hancing the role of tourism for the development of practice and place-based innovation processes, supported by co-creation me-chanisms (Binkhorst & Dekker, 2009;Boes et al., 2016;Brouder & Eriksson, 2013). However, it is also commonly observed that most of the services involved in the value chain of tourism are provided by small and medium companies, with limited resources and capabilities for the implementation of effective learning processes, constraining the innovation capacity of the sector (Rodríguez et al., 2014;Romão & Nijkamp, 2019;Strambach & Klement, 2012).
These co-creation processes relate to interactions among companies, policy institutions, or technology producers (Wiliams & Shaw, 2011;Rodríguez et al., 2014;Romão, 2018: chapter 4). They are framed by the regional territorial capital (Capello et al., 2011), defined as a set of characteristics and conditions in each region, shaping its selection environment (enabling and constraining the conditions for innovation) and influencing the possible growth trajectories. The institutions and interrelations established within these co-creation processes can also be considered regional innovation systems or networks (Asheim et al., 2011;Cooke, 2001). Tourism and smart specialisation
Relatedness—or the cognitive proximity between economic sectors—may play an important role in boosting sectorial interac-tions, technological development, innovation processes, and regional development (Aarstad et al., 2016;Boschma & Gianelle, 2014). One of the few attempts to analyse this question at the international level was developed byBalland and Boschma (2019), who proposed a sectorial disaggregation of regional employment and patent registration to identify different patterns of relatedness in each region. However, the multisectorial character or tourism activities (notably, tourism is normally not defined as a sector for statistical purposes) constitutes an important obstacle for the assessment of transmission mechanisms related to relatedness. Thus, that type of analysis is not possible to replicate for the tourism industry, considering its multisectorial composition. However, the model developed in this work (presented in the following Section) allows for the identification of different sectors that contribute to regional economic growth and/or resilience, in combination with tourism activities. A more detailed analysis of the related trans-mission mechanisms requires other types of methodologies (e.g. individual case studies rather than international comparisons), and it may constitute an important further development of this work.
The smart specialisation approach suggests that such a process should be based on entrepreneurial initiatives or processes of discovery while considering the specific characteristics of each regional economic systems. This theoretical framework (Foray & Hall, 2011) has been quickly adopted as a core concept inspiring the definition of RIS within the European Union (Foray et al., 2012), which is a pre-condition to access regional development funds. Such strategies should be based on a limited number of priority sectors that already have strong regional dynamics and support from local resources and capabilities. Questions and problems may arise, for example, when the regional specialisation patterns do not generate, historically, positive economic dynamics. Additionally, the involvement of local stakeholders in such a bottom-up strategic approach does not necessarily emerge, as observed byBoschma et al. (2017). Despite these (and other) remarks, a critical discussion of the smart specialisation approach is not a purpose of this work: In this case, the sectorial strategic options defined by each region are assumed as specific characteristics of the RIS, which are integrated into an economic analysis of the contributions of tourism (and its relatedness) for regional economic performance.
The reinforcement of sectorial interrelations (by exploiting local related variety, or the synergies between related activities) is expected to generate spillover effects of innovation processes, boosting regional economic development (Basile et al., 2012;Piirainen et al., 2017). The importance of tourism for these regional innovations strategies is emphasised by theEuropean Commission (2016), when mentioning that tourism is the third-largest economic sector of the European Union, with a significant impact on European society. Tourism has been defined as a priority sector within RIS by many regions where it already plays a prominent role. As the type of relatedness strategically defined for each region varies according to path-dependent processes (Boschma & Martin, 2010) of the historical evolution of their economic structures (Ma & Hassink, 2013), many sectors must be considered for this analysis. For this reason, this study focuses exclusively on regions where tourism is one of the strategic regional priorities.
In the particular case of tourism, possible sources of path-dependence (as defined byMartin, 2014) are natural resources (when attractiveness is related to natural conditions, e.g. ecotourism, sun-and-sea, or winter sports destinations); infrastructural sunk costs (large-scale investments in transport infrastructures, e.g. airports, or entertainment facilities, e.g. thematic parks); agglomeration economies, local external economies of specialisation, or localised spin-off firm birth (related to the agglomeration, interaction, and dependence between economic agents operating in tourism, e.g. travel agencies, hotels, restaurants, shops, tour guides, and transfer services); or interregional linkages and dependencies (once travellers often visit several destinations). These processes also enable and constrain the potential development of other economic sectors, their interrelations, or the emergence of new branches of economic activity (Boschma et al., 2017;Neffke et al., 2009).
potentially created with related sectors—and then the type of externalities arising from these interactions (Aarstad et al., 2016). Marshallian-type externalities may emerge through the geographical concentration of tourism and hospitality services. This related variety of companies and institutions, with high cognitive proximity, normally generates knowledge spinoffs and incremental in-novations that can easily spread within a network (Boschma et al., 2013). However, the development of some specialised types of tourism services (e.g. health and wellness tourism, ecotourism, creative tourism)—along with aspects related to logistics and/or environmental protection (e.g. energy saving, water management, advanced mobility systems)—may contribute to the generation of Jacobs-type externalities (Content et al., 2019;Frenken et al., 2007) and strong interactions and interdependencies between tourism activities and economic sectors with relatively high cognitive distance (unrelated variety), as observed byErkuş-Öztürk (2016)or broadly discussed byAarstad et al. (2016).
Considering its potential to create and to reinforce linkages with economic activities with different types of relatedness, tourism may assume a central role within smart specialisation strategies through the mobilisation of local knowledge and resources, as observed byWeidenfeld (2018). As discussed, while potentially contributing to the creation of a unique, differentiated tourism destination, such a process of mobilisation of endogenous resources and capabilities may reinforce regional innovation networks involving different types of sectors and activities, with diverse types of proximity. When the European RIS (based on the concept of smart specialisation) reaches thefinal stage of their implementation, this will be a crucial moment for their assessment and eva-luation, to support possible strategic reorientations.
Tourism, (endogenous) growth, and resilience
Economic impacts of tourism have been widely analysed (Pablo-Romero & Molina, 2013). Until recently, a certain consensus on the concept of TLG was observed in the literature once many studies had tested and confirmed this hypothesis (Brida et al., 2016). Positive relations between tourism and growth were identified in different periods and places (Nowak et al., 2007;Chen & Chiou-Wei, 2009;Dritsakis, 2004, 2012; orMérida & Golpe, 2016). However, ambiguous results were observed in other international analyses (Chou, 2013;Lee & Chang, 2008), or even the inexistence of a significant relation (Tang & Jang, 2009). Moreover, studies have revealed the decreasing impacts of tourism as a result of the transformation of regional economic structures (Adamou & Clerides, 2009; Antonakakis et al., 2015;Capó et al., 2007a, 2007b). A recent study involving many European regions revealed different impacts on the growth of the diverse aspects of tourism dynamics (Romão & Nijkamp, 2018): Gross value in tourism was found to be positively correlated with growth, but that was not the case for high employment in this sector or the level of tourism demand.
In general, these analyses are supported by methodologies based on time series or cross-sectional data (e.g. panel data models), using Cobb–Douglas production functions, in which an output (economic growth) is related to several inputs (production factors). There are, however, other possible formulations: neoclassical approaches (Solow, 1956) consider technological development exo-genous to the economy, and returns to scale (the increase in output as a result of a proportional increase in the inputs) always tend to decrease (thus implying a long-term convergence between smaller and larger economies); by contrast, endogenous growth ap-proaches (Lucas, 1988;Romer, 1986) perceive technological development as endogenous to the economy, potentially contributing to the creation of increasing returns to scale and eventually to a process of divergence between larger and smaller economies.
Other types of variables—not strictly related to the traditional endowments on labour or capital—would be later introduced in these models to identify and measure the actions of private and public agents, or to characterise aspects of the economies (Barro, 1991;Barro & Sala-i-Martin, 1992). Studies on the economic impacts of tourism activities have often used this type of augmented model by adding some variables to capture tourism dynamics. What is also common is to use the level of the GDP or gross value added as a proxy for the availability of capital (and also to identify possible processes of convergence or divergence). Examples of works that have used these approaches areCortes-Jimenez (2008),Holzner (2011),Paci and Marrocu (2014),Liu, Nijkamp & Lin (2017), or Romão and Nijkamp (2018).
Most of the aforementioned studies were conducted during periods of relatively stable growth for tourism activities and the overall economies; however, this changes after the international crisis starting in 2007. A significant decline was identified in tourism activities in Asia (Song & Lin, 2010) and Europe (Smeral, 2009), and differences in travel behaviour were also identified, for example, a decrease in visits abroad (Caletrío, 2012). However, although a very quick recovery was observed for tourism demand, problems within the overall economic structures in tourism-dependent regions persisted for a relatively long period, with high levels of un-employment and an inability to return to the path of economic growth (Romão et al., 2016). Moreover, the recent pandemics related to COVID-19 and the related implications on economic systems—and in particular on the tourism industry, as observed in detail by Gössling et al. (2020)—reinforced the importance of analysing questions related to the impacts of external shocks.
The diverse difficulties and rhythms of the processes of recovery observed in different regions that have similar negative impacts from a global recession contributed to the popularisation of the concept of resilience—the ability of a system to recover to a stable evolution path after a negative external shock (Modica & Reggiani, 2014)—in economic studies. These differences also confirmed the importance of historical processes and path-dependences for economic analysis (Boschma & Martin, 2010) and in particular for tourism studies (Brouder & Eriksson, 2013). In this work, resilience is analysed and modelled by considering three aspects by following (and adapting) the formulation proposed byMartin et al. (2016): vulnerability (the degree to which a region is affected by the negative shock), shock absorption (the ability to control the negative impacts of the shock), and recovery (the ability to return to a growth path). This analysis complements the estimation of the impacts of territorial characteristics and tourism dynamics on regional growth. In both cases, aspects related to smart specialisation strategic priorities are considered.
Data and methodology
The period under analysis (2006–2017) has three stages with different economic performances, allowing for the analysis of the relations between tourism, smart specialisation, and growth (considering the overall period) and of the implications of tourism dynamics and specialisation strategies on regional vulnerability and resilience. The delimitation of these periods was made by considering the growth of the overall gross value added (GVA) for all the regions under analysis (considering purchasing power parities): positive for 2007 and 2008, negative or very close to 0 between 2009 and 2013, positive and above 2% per year from 2014 onwards. However, these stages do not occur exactly simultaneously (and with the same magnitude) in all the regions under analysis, for example, the negative impacts of the crisis are observed in almost all the Greek regions before they are identified in the German regions of this sample.
Cobb–Douglas production functions inspired by the early works ofSolow (1956), relating the output of an economy with the inputs of capital and labour, are common tools to analyse the relations between tourism and growth. In this analysis, the growth of the GVA (at constant prices and considering purchasing power standards) is the measure of the regional economic output. The level of regional GDP in the previous year (also at constant prices, with purchasing power standards) allows for the assessment of a possible process of convergence or divergence regarding the development levels of each region. This variable can also be considered a proxy for the availability of capital, as discussed. The qualification of the workforce (percentage of the active population with tertiary education) measures the available human resources.
This focus on educational aspects—rather than the quantity of workers available—is inspired by endogenous growth approaches (Jones, 1995; Martin & Sunley, 1998), emphasising the importance of immaterial aspects related to knowledge and innovation capabilities to increase productivity levels and the efficiency of the economic system. In this sense, the production functions used in the models presented in this study also include regional investment in research and development (as a percentage of the GVA) as a proxy for the regional innovation potential. These production functions are also augmented with variables characterising regional tourism dynamics, as regularly proposed in similar studies (Lee & Chang, 2008;Pablo-Romero & Molina, 2013). In this work, regional specialisation in tourism is considered, both by measuring the percentage of the workforce employed in tourism and the share of the total GVA generated by tourism activities. Additionally, the volume of tourism demand (overnights spent in regional accommodation establishments per habitant) is considered.
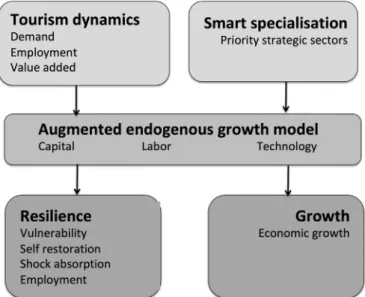
All this information was collected in Eurostat (regional statistics, tourism statistics, and structural business statistics). Very oc-casional missing data were computed considering the tendencies immediately before and/or after the missing information. Natural logarithms were applied to regional GVA and tourism demand for the computation of all the models. Similar information and methods have often been applied in the literature, as observed in a recent study focusing on the relation between tourism and growth in a larger number ofEuropean regions with a shorter period of analysis (Romão & Nijkamp, 2018). Information related to the priority sectors defined by each region for their RIS3 was collected on the website of the S3P platform. Because the analysis focuses on the tourism sector, only regions where tourism and/or hospitality services were defined among the priorities were considered. The other priority sectors were integrated into the regression models by using dummy variables (0 when the sector is not a priority and 1 when it is). Including a wider range of regions would imply the utilisation of toomany dummy variables, creating significant problems for the estimation of relevant results. These econometric models are represented by the diagram inFig. 1, and the variables used (and corresponding units) are presented inTable 1.
Considering these conditions (tourism and/or hospitality as priority sectors, availability of statistical information, and comparable
territorial units), 55 NUTS2 regions are analysed. Although most of the regions are located in the South of Europe, 10 countries are represented: Hovedstaden, Midtjylland, and Nordjylland (Denmark); Brandenburg and Niedersachsen (Germany); Burgenland and Tirol (Austria); Centru and Sud-Est (Romania); Anatoliki Makedonia, Kentriki Makedonia, Dytiki Makedonia, Ipeiros, Thessalia, Ionia Nisia, Dytiki Ellada, Sterea Ellada, Peloponnisos, Attiki, Voreio Aigaio, Notio Aigaio, and Kriti (Greece); Valle d'Aosta, Friuli-Venezia Giulia, Emilia-Romagna, Toscana, Lazio, Molise, Campania, Puglia, Calabria, Sicilia, and Sardegna (Italy); Galicia, Cantabria, Navarra, La Rioja, Aragón, Castilla-la-Mancha, Extremadura, Cataluña, Valencia, Illes Balears, Andalucía, Murcia, and Canarias (Spain); Norte, Algarve, Centro, Lisboa, Alentejo, Açores, and Madeira (Portugal); Cyprus; and Malta. These regions are depicted in the map presented inFig. 2, including a representation of the average growth rate of regional GVA observed during the period under
Table 1
Variables used in the econometric models (and corresponding units). Dependent variables
Economic growth Growth of GVA pc (PPS) %
Employment (resilience) Employment rate %
Explanatory variables
Tourism demand Overnight stays pc LN
Specialisation in tourism Employment Tourism %
Specialisation in tourism GVA Tourism %
Capital GVA pc (PPS) [t-1] Ln
Labor Tertiary education % workers
Technology R&D expenses [t-1] % GVA
Priority sector 1 Agriculture and food (42) Dummy
Priority sector 2 Energy (27) Dummy
Priority sector 3 Health (35) Dummy
Priority sector 4 Environmental technologies (19) Dummy
Priority sector 5 Mobility and transports (13) Dummy
Priority sector 6 Logistics (5) Dummy
Priority sector 7 Culture and creativity (32) Dummy
Priority sector 8 ICT (9) Dummy
Priority sector 9 Manufacture (19) Dummy
Priority sector 10 Technologies of the sea (15) Dummy
Priority sector 11 Biotechnologies (7) Dummy
Priority sector 12 Housing and construction (6) Dummy
Priority sector 13 Advanced materials and technologies (12) Dummy
analysis.
A minority of regions where tourism is identified as a smart specialisation priority do not have all the statistical information available at Eurostat (one region in France and several regions in Poland). In some cases, the strategies were oriented to different territorial units, larger than the NUTS2 (almost all the regions in the Netherlands) or only at the national level (Scotland or Slovenia). Regions with strong tourism dynamics but not defining tourism and/or hospitality as strategic priorities (e.g. Berlin or Madrid) were not considered. Smart specialisation priorities were integrated into the models according to priorities defined in regional strategies, independent of the achievements effectively obtained in each region (which can also be an important aspect for further research). Multicollinearity was tested for all these variables by using a VIF test—using the ‘car’ package in R (Fox & Weisberg, 2019)—and no problems were identified because all the scores were below the threshold of five (O'Brien, 2007). Using the plm package in R (Croissant & Millo, 2008), the stationarity of the data was tested by using the Im–Pesaran–Shin unit-root test (Pesaran, 2007). Four tests were computed for trends and for the individual intercepts, with the number of lags being defined by the Akaike information criteria and limited to 2 or 4. In all cases, the stationarity of the data was confirmed after the p values obtained were below 2.2e-16. Panel data models (Baltagi, 1998) are suitable tools for this analysis because they allow for the inclusion of temporal and geo-graphical units. The models were computed with the package‘plm’ for R. When possible, fixed effects models (allowing for the identification of individual characteristics of the regions under analysis) were estimated; when not possible (due to the existence of time-invariant variables for the period under analysis), a pooling effects approach was used. Alternative specifications are presented to assess the robustness of the models.
Tourism, smart specialisation, and growth
Thefirst model analyses the impacts of tourism dynamics, other aspects characterising regional economic structures (previous level of development, qualifications of the workforce and innovation potential), and smart specialisation sectorial priorities on regional economic performance (measured according to the annual growth of the regional GVA, at constant prices and considering purchasing power standards). The results for the model estimation including all the variables are presented inAppendix 1, along with a different model specification, using pooling effects. It is observed that the signs and statistical significance of the variables are the same in both models, except for the dummy variables. Thefixed effects model, however, reveals higher goodness of fit, according to the scores observed for the R-squared. After eliminating the explanatory variables without statistical significance, the estimations for the parameters are presented inTable 2, and the estimations for the individual effects are presented inAppendix 2.
A process of convergence is observed between the levels of development of the regions under analysis, with a negative correlation between the level of the regional GDP (in the previous year) and economic growth. Thus, there is a general tendency for a reduction of the development gap between the most and the least advanced economies, as it is commonly observed. A positive correlation between investment in R&D (in the previous year) and economic performance is also verified. In combination with the previous observation, this result suggests that the less-developed regional economies are using the efforts in R&D to reduce the gap with the most developed. Qualifications of the workforce do not seem to exert a significant impact on growth.
In terms of tourism dynamics, contradictory impacts are observed: A high tourism demand and a high specialisation level (measured according to the importance of the tourism sector within the regional GVA) exert a positive impact on regional economic performance. However, a high specialisation in tourism, when measured according to the share of the workforce employed in the sector, is negatively correlated with economic growth. The combination of these results suggests that the potential benefits of a strong tourism dynamics only have a relevant impact on economic growth when the services provided reveal relatively high productivity; otherwise, if they rely on labour-intensive service provision, the impact on growth can be negative. Notably, these results are consistent with those recently obtained byRomão and Nijkamp (2018)for a larger number of European regions.
The sectorial priorities that reveal higher positive impacts on growth (in combination with tourism) are agriculture and food production (with relatively high connectivity with hospitality activities related to restaurants and bars) and health services (with lower connectivity, but still relevant for the development of wellness tourism).
Table 2
Determinants of regional growth.
Dependent Variable: Growth of the GVA pc (PPS) 2007–2017
Estimate Std.Er. Sign.
GVA pc (PPS) [t-1] −18.361 1.879 ***
Employment Tourism −0.330 0.113 **
GVA Tourism 0.747 0.098 ***
Overnight stays pc 1.341 0.536 *
Agriculture and food 2.457 0.477 ***
Health 1.190 0.495 * R Square 0.28 F-statistic p-value 36.5546 on 6 and 564 DF < 2.22e-16
Tourism, smart specialisation, and resilience
The impacts of tourism, territorial characteristics, and smart specialisation priorities on regional resilience are analysed by considering three aspects (or three approaches to resilience) inspired by the evolutionary approach proposed byMartin et al. (2016). Three stages in the reaction to a negative external shock are considered: vulnerability (how the regions were prepared to manage the impacts of a recession, shock absorption (how the regional economic structure absorbed the negative impacts of the negative shock), and recovery (how the region returned to a growth path). The models used are similar to the model we already used and have the same explanatory variables. However, the dependent variable now used is the employment rate, which is a better indicator for regional socioeconomic conditions.
Vulnerability
For the assessment of vulnerability, the model considers the period of recession (200−−2013), in comparison with the precedent period of growth (2007–2008). To achieve this objective, the dependent variable is calculated by considering the employment rate in each year minus the average observed in 2007 and 2008 for the region concerned. Next, the smart specialisation strategies are defined for the period 2014–2020 (after the period under analysis in this model); the dummy variables for sectorial priorities are not included. The estimation is also made with afixed effects model. The results for the computation of the model with all the variables considered are presented inAppendix 3, which also includes an alternative estimation using random effects (with very similar results, like in the previous case). Thefinal results of the model, after eliminating the variables without statistical significance, are presented inTable 3. The individual effects are depicted inAppendix 4.
Contrary to what was observed for the impacts on growth, in this case, the level of development (GDP in the previous year) has a positive impact on regional resilience, implying that the most developed regions are better prepared (more protected) against the negative impacts of an international recession.
The model also shows notable results regarding the impacts of tourism specialisation: a high share of tourism activities within regional GVA contributes to reducing regional vulnerability, and a high share of employment in tourism is linked to higher levels of vulnerability. Thus, regions where the tourism supply is based on labour-intensive and low value-added services (again, suggesting a low productivity) are more vulnerable. By contrast, vulnerability is lower when a high value added (and implicitly higher pro-ductivity) is linked to the provision of tourism services. Notably, tourism demand does not have a significant impact.
Shock absorption and recovery
Finally, the regional performance observed after the period of recession (2014–2017)—which (accidentally) coincides with the implementation of the smart specialisation strategies—is compared with two different periods. The shock absorption capacity (re-gional ability to manage the immediate negative consequences of the recession) is assessed by comparison with the period im-mediately before (by considering as the dependent variable the employment rate for each year minus the average observed during the period 2009–2013). The recovery process (ability to return to a path of growth) is evaluated by a comparison with the precedent period (2007–2008) by following the same methodology for the calculation of the dependent variable. When a fixed effects model cannot be estimated in the presence of time-invariant variables (the dummies), a pooling effects model is used. The models including all the variables are presented inAppendix 5, and theirfinal versions (after eliminating the variables without statistical significance) are presented inTable 4.
Some similarities with the results presented inTable 4are observed when comparing them with those of analysis of vulnerability. The levels of development are also positively correlated with both shock absorption and recovery, showing that the most developed regions are those with the highest levels of resilience, independent of the method used to assess it. Tourism dynamics also has a similar impact, with specialisation in tourism measured by the weight of the sector within the regional GVA being positively cor-related with these two new forms of resilience. High levels of employment in the tourism sector have a negative impact on recovery (although this is not confirmed for shock absorption). Tourism demand exerts a positive impact on the recovery process but does not affect the ability to absorb the shock.
The results obtained for the negative impact of the investment in R&D on both forms of resilience are not intuitive but are Table 3
Regional vulnerability (2009–2013: compared with 2007–2008).
Dependent Variable Employment rate
[2009–2013: compared with 2007–2008]
Explanatory Variables Sign.
GVA pc (PPS) [t-1] 35.579 *** Employment Tourism −0.363 * GVA Tourism 0.246 . Tertiary education −1.019 *** R Square 0.68 F-statistic p-value 96.5713 on 5 and 223 DF < 2.22e-16 Significance Codes 0‘***’ 0.001 ‘**’ 0.01 ‘*’ 0.05 ‘.’ 0.1 ‘‘1
consistent with the analysis performed for the impacts on growth. In that case, regions with higher levels of growth were those with higher investment in R&D and also lower levels of development (implying the aforementioned process of convergence). In this case, the most resilient regions are those most developed, implying (considering the previous results) that they are also those where investments in R&D are currently relatively lower.
Regarding the impacts of sectorial strategic priorities, several sectors reveal a positive impact on resilience, suggesting that each region may follow a specific diversification strategy based on its strengths and path-dependent historical development, as proposed by the smart specialisation approach. In particular, agriculture and food production or mobility and transport services (both with relatively high connectivity with tourism activities) exert a positive impact on regional resilience. Similar positive impacts are observed for some of the more sophisticated (in terms of potential incorporation of advanced knowledge and technology) sectors, for example, technologies of the sea, biotechnologies, or advanced materials and technologies.
On the other hand, sectors such as ICT and manufacturing exert important positive impacts for shock absorption, which is not confirmed when assessing the recovery process. On the other hand, environmental technologies or culture and creativity have the contrary positive impact (only for the recovery). By contrast, logistics has a negative correlation with the recovery process (which does not seem to have a clear explanation), and construction appears as an obstacle to efficient shock absorption (confirming the results obtained byMilio, 2014).
Notably, the methodology adopted for this analysis is constrained by the relatively short period observed after the international recession (2014–2017). Eventually, shock absorption and recovery could be analysed by examining two consecutive periods (one immediately after the recession, for the shock absorption, and another after this, for the recovery). However, a longer series of observations are necessary, which could constitute a further development of this analysis.
Results
The results of the regressions computed in the previous section are summarised inTable 5, showing the sign (positive or negative) of the impact of each explanatory variable on the different aspects under analysis: regional economic growth and the three ap-proaches to resilience scrutinised (vulnerability, shock absorption, and recovery). As in the previous cases, the table only shows the signs when there is a statistically significant correlation. All the variables contribute to the analysis of the questions under discussion, suggesting the adequacy of the model for these purposes.
Afirst significant observation relates to the impact of the existing level of development (measured according to the regional GDP per habitant) on growth and resilience. The negative sign observed for the correlation with regional growth confirms the existence of a process of convergence between the most and the least developed regions, as it was also identified by a recent study involving a broader set of European regions (Romão & Nijkamp, 2018). However, a significant new contribution of this analysis is the observation of a positive correlation between the pre-existing levels of development and regional resilience, which can be verified in all three approaches to resilience. Thus, the most developed regions are more resilient, revealing less vulnerability, a higher ability to absorb a negative shock, and quicker progress towards a new growth path.
Table 4
Regional shock absorption and recovery.
Dependent variable Employment rate [2014–2017: recovery compared with…]
Explanatory Variables [Expansion: 2007–08]
Pooling Effects [Recession: 2009–13] Pooling Effects GVA pc (PPS) [t-1] 11.477 *** 8.067 *** Employment Tourism −0.767 *** GVA Tourism 0.354 *** 0.082 * Overnight stays pc 1.145 * R&D expenses [t-1] −1.353 ** −1.399 *** Tertiary education −0.113 * 0.086 **
Agriculture and food 1.620 * 0.086 **
Environmental technologies 1.259 *
Mobility and transports 1.896 ** 2.454 ***
Logistics −1.846 .
Culture and creativity 2.020 **
ICT 1.431 *
Manufacture 1.578 **
Technologies of the sea 2.440 *** 1.080 *
Biotechnologies 3.016 ** 1.888 **
Housing and construction −2.019 **
Advanced materials and technologies 2.290 *** 1.114 *
Intercept −119.840 *** −86.673 *** R Square 0.67 0.44 F-statistic p-value 31.4233 on 14 and 213 DF, < 2.22e-16 14.3205 on 12 and 215 DF < 2.22e-16 Significance codes 0‘***’ 0.001 ‘**’ 0.01 ‘*’ 0.05 ‘.’ 0.1 ‘‘1
The analysis of the impacts of specialisation in tourism also offers clear and new insights. When measuring specialisation while considering the share of tourism within the regional value added, the contributions of this sector are positive for all three forms of resilience under analysis. However, when specialisation is measured by considering the weight of tourism within the regional em-ployment, the impacts are negative in terms of growth and resilience (increasing vulnerability and delays for a recovery). Thus, high value-added tourism services may offer a high positive contribution to regional economies, and labour-intensive tourism services (implicitly, with low productivity) exert negative impacts on regional growth and resilience. Finally, tourism demand exerts positive impacts when observing a period of growth or recovery but not necessarily when examining vulnerability or shock absorption. This set of results—new for the analysis of resilience—suggests that the TLG hypothesis is only partially confirmed, namely, when the impacts of tourism on regional growth depend on the characteristics of the tourism sector.
Regarding the specialisation priorities defined within RIS—in conjugation with tourism activities—the results show that different options (exploiting both related or unrelated forms of sectorial variety) can provide a positive contribution to the regional economies. Notably, activities with relatively strong connectivity to tourism (agriculture and food production or mobility and transports) or to specific tourism segments (health services, ICT or culture, and creativity) can offer positive contributions to growth and/or resilience. However, some sectors not directly connected to tourism can provide positive socioeconomic impacts (technologies of the sea, biotechnologies, manufacture of advanced materials, and technologies). As discussed, different types of knowledge externalities can spread between different activities due to geographical, cultural, and institutional proximity. Additionally, the only impact identified for the construction sector (often very closely linked to tourism activities) is a negative impact on shock absorption.
Conclusion
In this work, we aimed to analyse the relation between tourism dynamics, specific features of territorial capital, smart specia-lisation strategic sectorial options, economic growth, and regional resilience. A relatively broad set of European regions was con-sidered, with diverse characteristics regarding their levels of economic development, growth performance, tourism specialisation, or technological and innovation capabilities. The period under analysis comprises a stage of economic growth, the negative impact of an international crisis (with implications on tourism dynamics and regional growth) and a process of recovery. By analysing the role of tourism within the undergoing RIS (2014–2020) at the EU level, the main innovative conceptual contributions of this work rely on the analysis of the relatedness between tourism and other economic sectors within smart specialisation strategies and on a combined modelling study of the determinants of growth and resilience in regions where tourism plays a prominent role.
Focusing on the policy and managerial implications for the tourism sector, the results obtained show that tourism demand has a positive impact on regional growth and resilience. However, the benefits of tourism are mostly related to the creation of high value added, and the development of the tourism sector based on a labour-intensive service provision has negative impacts in terms of economic growth and regional resilience. Thus, policies oriented to increase the number of visitors may not achieve the expected results if they are not supported by differentiation strategies oriented to the creation of services with higher value added and incorporation of knowledge, rather than massive and low-cost labour-intensive services. Despite the differences in methods, objec-tives, variables, and territorial units, these results confirm the heterogeneity of the impacts of tourism on growth, which are de-pendent on the local characteristics of the tourism sector and the interactions established within regional economic structures, as observed byCapó et al. (2007a, 2007b),Adamou and Clerides (2009), orAntonakakis et al. (2015).
Table 5
Summary of results.
Impacts on:
Growth Vuln. Absorption Recovery
Capital GVA pc (PPS) [t-1] − + + +
Tourism specialisation Employment Tourism − − −
GVA Tourism + + + +
Tourism demand Overnight stays pc + +
Technology R&D expenses [t-1] − −
Labor Tertiary education − −
Priority sectors Agriculture and food + +
Energy
Health +
Environmental tech. +
Mobility and transports + +
Logistics −
Culture and creativity +
ICT +
Manufacture +
Technologies of the sea + +
Biotechnologies + +
Housing and construction −
Regarding the strategic options for smart specialisation, the results reveal a diverse set of possible successful options in terms of the impacts on growth and resilience. Thisfinding suggests that a choice of priority sectors based on the existing regional strengths and path-dependence of historical constraints and opportunities (instead of attempting to focus on specific sectors, e.g. high-tech industries) may lead to positive results. In this analysis of regions where tourism is one of the strategic options, we observed positive results from related (agriculture and food or mobility and transports) and unrelated (manufacture of advanced materials and tech-nologies) sectors of economic activity.
As the magnitude of external shocks (positive or negative) affecting one sector tends to be magnified along related sectors, relatedness has benefits when a positive shock emerges; however, it also contributes to the spread of problems related to the emergence of negative shocks. In this sense, the results of this analysis support a combination of unrelated clusters of related activities (as proposed byBoschma et al., 2017), with tourism playing a potential central role within one of these clusters. Moreover, we observe that a much large number of unrelated sectors had a positive impact on resilience (and regional employment) than we observed for the impact on economic growth, which seems to support the results ofFrenken et al. (2007)when identifying that related variety has a positive impact on regional growth, whereas unrelated variety contributes to positive achievements in regional employment. Thus, strategic development options based on a diversified, balanced economic structure appear to be more suitable to promote economic growth while reinforcing regional resilience.
As a preliminary and early study on the consequences of the strategic choices assumed with RIS in European regions, further research can be pursued by considering this analysis as a contribution or a starting point. First, the data available (until 2017) only cover half of the period, justifying a confirmation of the results and/or the identification of new impacts when the period of im-plementation isfinished. Additionally, modelling the strategic sectorial options was performed based on dummy variables, but other types of indicators could be used (i.e. economic indicators, e.g. sectorial exports or GVA). A broader set of regions could be considered in the analysis, including those where tourism is not a priority (allowing for a comparison of performances). Moreover, other types of outputs of RIS (reinforcement of regional social capital or innovation networks) were expected when the strategies were defined and implemented, implying that other types of output variables (apart from growth and employment) can be used in the models. Finally, as discussed, the crucial aspect of the transmission mechanisms related to knowledge externalities arising from different types of interactions and relatedness could also be addressed because it requires different methodologies and data.
Acknowledgement
The author is pleased to acknowledgefinancial support from Fundação para a Ciência e a Tecnologia and FEDER/COMPETE, Portugal (grants UIDB/04007/2020 and SFRH/BPD/98938/2013).
Appendix 1. Determinants of regional growth
The equation for thefixed effects model used in the main text is given by the expression:
= + + + + + + + + +
+ + + + + + + + + + +
+ +
− −
u
GVAgr α ß lnTD ß EMPT ß GVAT ß GVATS ß lnGVA ß EdT ß RD ß SS1 ß
SS2 ß SS3 ß SS4 ß SS5 ß1 SS6 ß SS7 ß SS8 ß SS9 ß SS10 ß SS11 ß SS12 ß SS13 it i 1 it 2 it 3 it 4 it 5 it 1 6 it 7 it 1 8 it 9 it 10 it 11 it 12 it 3 it 14 it 15 it 16 it 17 it 18 it 19 it 20 it it with:
idefining the region
tdefining the year (from 2007 to 2017)
Dependent Variable Growth of Gross Value Added pc (PPS) [2007–2017]
Name (model) Fixed (individual) effects Pooling effects
Estimate Std.Er. Sign. Estimate Std.Er. Sign.
GVA pc (PPS) [t-1] lnGVA −20.236 2.140 *** −3.544 0.839 ***
Employment Tourism EMPT −0.328 0.117 ** −0.340 0.054 ***
GVA Tourism GVAT 0.751 0.101 *** 0.062 0.050
Overnight stays pc lnTD 1.469 0.563 ** 1.096 0.289 ***
R&D expenses [t-1] RD 0.174 1.188 0.528 0.311 .
Tertiary education Ed −0.075 0.077 0.015 0.026
Agriculture and food SS1 1.992 0.641 ** 0.793 0.557
Energy SS2 0.063 0.635 0.973 0.578 .
Health SS3 1.011 0.728 1.592 0.641 *
Environmental technologies SS4 0.632 0.673 0.759 0.609
Mobility and transports SS5 −0.049 0.848 0.932 0.747 *
Logistics SS6 −0.182 1.257 0.247 1.143
Culture and creativity SS7 0.063 0.630 −0.543 0.579
Manufacture SS9 0.848 0.682 1.093 0.621 .
Technologies of the sea SS10 0.904 0.785 0.677 0.692
Biotechnologies SS11 1.889 1.069 . −0.096 0.914
Housing and construction SS12 −0.516 1.193 −0.741 1.060
Advanced materials and technologies SS13 0.210 0.846 −0.219 0.764
Intercept 31.509 7.149 *** R Square 0.29 0.22 F-statistic p-value 11.8955 on 19 and 551 DF < 2.22e-16 9.271 on 19 and 607 DF < 2.22e-16 Significance levels 0‘***’ 0.001 ‘**’ 0.01 ‘*’ 0.05 ‘.’ 0.1 ‘‘1
Appendix 2. Determinants of regional growth (individual effects)
Valle d'Aosta 116.7 Sud-est 112.9 Peloponissos 108.1
Centru 115.4 Sud-Vest Oltenia 112.8 Andalucia 107.6
Dytiki Makedonia 115.4 Midtjylland 112.3 Centro 107.5
Nordjylland 115.4 Galicia 111.9 Thessalia 107.2
Lazio 115.2 Extremadura 111.8 Campania 107.0
Aragon 115.1 Cataluna 111.4 Hovedstaden 106.1
La Rioja 115.0 Alentejo 111.3 Illes Balears 106.1
Brandenburg 114.8 Cantabria 111.0 Anatoliki Makedonia 104.8
Emilia-Romagna 114.8 Murcia 110.7 Tirol 104.6
Niedersachsen 114.4 Cyprus 110.3 Madeira 104.2
Friuli-Venezia Giulia 114.2 Sardegna 110.0 Kentriki Makedonia 103.7
Sud-Muntenia 114.1 Lisboa 109.8 Dytiki Ellada 103.3
Navarra 113.9 Puglia 109.5 Algarve 103.2
Molise 113.8 Sterea Ellada 109.5 Canarias 103.0
Castilla-la-Mancha 113.6 Açores 109.4 Ipeiros 102.8
Malta 113.3 Com. Valenciana 109.2 Voreio Aigaio 102.2
Toscana 113.3 Sicilia 109.1 Kriti 96.2
Attiki 113.2 Calabria 108.3 Notio Aigaio 95.6
Burgerland 113.0 Norte 108.3 Ionia Nisia 94.4
Appendix 3. Vulnerability
The equation for thefixed effects model used in the main text is given by the expression:
− = + + + + + − + + − +u
EMPit AEMPi(2007–2008) αi ß lnTD1 it ß EMPT2 it ß GVAT3 it ß GVATSit4 ß lnGVA5 it 1 ß EdT6 it ß RD7 it 1 it
with:
idefining the region.
tdefining the year (from 2009 to 2013).
AEMPi(2007–2008)as the average employment level observed in regioniduring the period 2007–2008: AEMPi(2007–2008)= [(EMPi2007+ EMPi2008)/2]
Dependent variable Employment rate [2009–2013: compared with 2007–2008]
Fixed (individual) effects Random effects
Explanatory variables Estim. Std. Er. Sign. Estim. Std. Er. Sign.
GVA pc (PPS) [t-1] 35.731 2.890 *** 17.942 1.810 *** Employment Tourism −0.357 0.171 * −0.794 0.125 *** GVA Tourism 0.236 0.129 . 0.352 0.107 ** Overnight stays pc 0.954 0.672 −0.679 0.564 R&D expenses [t-1] 2.744 1.853 −0.640 0.786 Tertiary education −1.019 0.116 *** −0.584 0.064 *** Intercept −152.575 16.168 *** Idiosyncratic 5.725 2.393 Individual 6.614 2.572 Theta 0.616 R Square 0.69 0.48 F-statistic p-value 81.1776 on 6 and 222 DF < 2.22e-16 Significance codes 0‘***’ 0.001 ‘**’ 0.01 ‘*’ 0.05 ‘.’ 0.1 ‘‘1
Appendix 4. Regional vulnerability model - individual effects
Sud-Vest Oltenia −308.7 Com. Valenciana −332.6 Murcia −337.0
Sud-est −314.1 Dytiki Makedonia −332.6 Sterea Ellada −337.3
Sud-Muntenia −316.2 Norte −332.6 Sardegna −337.7
Centru −317.5 La Rioja −333.5 Midtjylland −337.8
Brandenburg −318.8 Centro −333.7 Canarias −338.0
Cyprus −320.3 Andalucia −333.8 Attiki −338.1
Thessalia −321.7 Puglia −333.9 Madeira −338.5
Ipeiros −322.2 Alentejo −334.3 Açores −339.8
Kentriki Makedonia −324.3 Hovedstaden −334.5 Illes Balears −342.3
Cantabria −326.2 Molise −334.7 Niedersachsen −342.6
Dytiki Ellada −327.5 Nordjylland −334.7 Cataluna −343.2
Voreio Aigaio −327.9 Kriti −334.8 Notio Aigaio −343.7
Anatoliki Makedonia −328.4 Campania −335.5 Lisboa −344.4
Galicia −329.2 Aragon −335.8 Toscana −347.4
Peloponissos −330.2 Algarve −336.2 Friuli-Venezia Giulia −350.2
Sicilia −330.2 Burgerland −336.2 Lazio −350.7
Calabria −330.8 Navarra −336.2 Emilia-Romagna −352.9
Extremadura −330.8 Ionia Nisia −336.4 Tirol −355.3
Malta −332.0 Castilla-la-Mancha −336.9 Valle d'Aosta −357.0
Appendix 5. Regional resilience
The equations for the model used in the main text are given by the expressions: A) recovery (2014–2017) compared with expansion (2007–2008)
− = + + + + + + + + + + + + + + + + + + + + + + + − − u EMP AEMP
ß ß lnTD ß EMPT ß GVAT ß GVATS ß lnGVA ß LabT ß RD ß SS1 ß SS2 ß
SS3 ß SS4 ß SS5 ß1 SS6 ß SS7 ß SS8 ß SS9 ß SS10 ß SS11 ß SS12 ß SS13 it i(2007–2008) 0 1 it 2 it 3 it 4 it 5 it 1 6 it 7 it 1 8 it 9 it 10 it 11 it 12 it 3 it 14 it 15 it 16 it 17 it 18 it 19 it 20 it it with:
idefining the region andtdefining the year (from 2014 to 2017).
AEMPi(2007–2008)as the average employment level observed in regioniduring the period 2007–2008: AEMPi(2007–2008)= [(EMPi2007+ EMPi2008)/2].
B) recovery (2014–2017) compared with recession (2009–2013) − = + + + + + + + + + + + + + + + + + + + + + + + − − u EMP AEMP
ß ß lnTD ß EMPT ß GVAT ß GVATS ß lnGVA ß LabT ß RD ß SS1 ß SS2 ß
SS3 ß SS4 ß SS5 ß1 SS6 ß SS7 ß SS8 ß SS9 ß SS10 ß SS11 ß SS12 ß SS13 it i(2009–2013) 0 1 it 2 it 3 it 4 it 5 it 1 6 it 7 it 1 8 it 9 it 10 it 11 it 12 it 3 it 14 it 15 it 16 it 17 it 18 it 19 it 20 it it with:
AEMPi(2009–2013)as the average employment level observed in regioniduring the period 2009–2013: AEMPi(2009–2013)= [(EMPi2009+ EMPi2010 +EMPi2011+ EMPi2012+ EMPi2013) /5].
Dependent variable Employment rate [2014–2017: recovery compared with…]
Explanatory Variables [Expansion: 2007–08]
Pooling Effects
[Recession: 2009–13] Pooling Effects
Estimate Std. Er. Sign. Estimate Std. Er. Sign.
GVA pc (PPS) [t-1] 11.405 1.479 *** 7.295 1.217 *** Employment Tourism −0.740 0.091 *** −0.094 0.075 GVA Tourism 0.340 0.090 *** 0.125 0.074 . Overnight stays pc 1.150 0.508 * 0.244 0.418 R&D expenses [t-1] −1.222 0.508 * −1.572 0.418 *** Tertiary education −0.109 0.047 * 0.109 0.039 **
Agriculture and food 1.838 0.679 ** 1.563 0.558 **
Energy −0.389 0.594 0.374 0.488
Environmental technologies 1.198 0.590 * −0.196 0.486
Mobility and transports 1.587 0.745 * 2.308 0.613 ***
Logistics −1.667 1.135 −0.019 0.934
Culture and creativity 1.842 0.696 ** 0.402 0.572
ICT 0.684 0.794 1.370 0.653 *
Manufacture 0.654 0.653 1.656 0.537 **
Technologies of the sea 0.654 0.728 ** 1.176 0.600 .
Biotechnologies 3.237 1.073 ** 1.538 0.883 .
Housing and construction −0.310 1.032 −1.973 0.849 *
Advanced materials and technologies 2.231 0.729 ** 1.167 0.849 .
Intercept −120.054 13.159 *** −80.306 10.825 *** R Square 0.68 0.45 F-statistic p-value 23.0537 on 19 and 208 DF < 2.22e-16 9.04044 on 19 and 208 DF < 2.22e-16 Significance codes 0‘***’ 0.001 ‘**’ 0.01 ‘*’ 0.05 ‘.’ 0.1 ‘‘ References
Aarstad, J., Kvitastein, O. A., & Jakobsen, S. (2016). Related and unrelated variety in a tourism context. Annals of Tourism Research, 57, 234–278.
Adamou, A., & Clerides, S. (2009). Prospects and limits of tourism-led growth: The international evidence. The Rimini Centre for Economic Analysis Working Papers, 41-09. (Rimini).
Antonakakis, N., Dragouni, M., & Filis, G. (2015). How strong is the linkage between tourism and economic growth in Europe? Economic Modelling, 44, 142–155.
Asheim, B., Smith, H. L., & Oughton, C. (2011). Regional innovation systems: Theory, empirics and policy. Regional Studies, 45(7), 875–891.
Balland, P.-A., & Boschma, R. (2019). Smart specialisation: Beyond patents. Luxembourg: European Union.
Balland, P. A., Boschma, R., Crespo, J., & Rigby, D. L. (2019). Smart specialization policy in the European Union: relatedness, knowledge complexity and regional diversification. Regional Studies, 53(9), 1252–1268.
Baltagi, B. (1998). Panel data methods. In A. Ullah, & D. Giles (Eds.). Handbook of applied economic statistics (pp. 61–97). New York: Marcel Dekker.
Barro, R. J. (1991). Economic growth in a cross-section of countries. Quarterly Journal of Economics, 45, 407–443.
Barro, R. J., & Sala-i-Martin, X. (1992). Convergence. Journal of Political Economy, 100, 223–251.
Basile, R., Capello, R., & Caragliu, A. (2012). Technological interdependence and regional growth in Europe: Proximity and synergy in knowledge spillovers. Papers in Regional Science, 91(4), 697–722.
Bellini, N., Grillo, F., Lazzeri, G., & Pasquinelli, C. (2017). Tourism and regional economic resilience from a policy perspective: Lessons from smart specialization strategies in Europe. European Planning Studies, 25, 140–153.
Binkhorst, E., & Dekker, T. (2009). Towards the co-creation tourism experience? Journal of Hospitality Marketing and Management, 18(2–3), 311–327.
Boes, K., Buhalis, D., & Inversini, A. (2016). Smart tourism destinations: Ecosystems for tourism destination competitiveness. International Journal of Tourism Cities, 2(2), 108–124.
Boschma, R., Coenen, L., Frenken, K., & Truffer, B. (2017). Towards a theory of regional diversification: Combining insights from evolutionary economic geography and transition studies. Regional Studies, 51(1), 31–45.
Boschma, R., & Gianelle, C. (2014). Regional branching and smart specialisation policy. S3 platform, Seville.
Boschma, R., & Martin, R. (2010). The aims and scope of evolutionary economic geography. In R. Boschma, & R. Martin (Eds.). The handbook of evolutionary economic geography (pp. 3–39). Cheltenham: Edward Elgar.
Boschma, R., Minondo, A., & Navarro, M. (2013). The emergence of new industries at the regional level in Spain: A proximity approach based on product relatedness. Economic Geography, 89, 29–51.
Brida, J. G., Cortes-Jimenez, I., & Pulina, M. (2016). Has the tourism-led growth hypothesis been validated? A literature review. Current Issues in Tourism, 19(5), 394–430.
Brouder, P., & Eriksson, R. (2013). Tourism evolution: On the synergies of tourism studies and evolutionary economic geography. Annals of Tourism Research, 43, 370–389.
Caletrío, J. (2012). Simple living and tourism in times of‘austerity’. Current Issues in Tourism, 15(3), 275–279.
Capello, R., Caragliu, A., & Nijkamp, P. (2011). Territorial capital and regional growth: Increasing returns in knowledge use. Tijdschrift voor Economische en Sociale Geografie, 102(4), 385–405.
Capó, J., Font, A., & Nadal, J. (2007a). Tourism and long-term growth: A Spanish perspective. Annals of Tourism Research, 34(3), 709–726.
Capó, J., Font, A., & Nadal, J. (2007b). Dutch disease in tourism economies: Evidence from the Balearics and the Canary Islands. Journal of Sustainable Tourism, 15(6), 615–627.
Cellini, R., & Cuccia, T. (2015). The economic resilience of tourism industry in Italy: What the‘great recession’ data show. Tourism Management Perspectives, 16, 346–356.
Chen, C., & Chiou-Wei, S. (2009). Tourism expansion, tourism uncertainty and economic growth: New evidence from Taiwan and Korea. Tourism Management, 30(6), 812–818.
Chou, M. (2013). Does tourism development promote economic growth in transition countries? A panel data analysis. Economic Modelling, 33, 226–232. Content, J., Frenken, K., & Jordaan, J. A. (2019). Does related variety foster regional entrepreneurship? Evidence from European regions. Regional Studies.https://doi.
org/10.1080/00343404.2019.1595565.
Cooke, P. (2001). Regional innovation systems, clusters, and the knowledge economy. Industrial and Corporate Change, 10(4), 945–974.
Cortes-Jimenez, I. (2008). Which type of tourism matters to the regional economic growth? The cases of Spain and Italy. International Journal of Tourism Research, 10, 127–139.
Croissant, Y., & Millo, G. (2008). Panel data econometrics in R: The plm package. Journal of Statistical Software, 27(2), 1–43.
Davids, D., & Frenken, K. (2018). Proximity, knowledge base and the innovation process: Towards an integrated framework. Regional Studies, 52(1), 23–34.
Dritsakis, N. (2004). Tourism as a long-run economic growth factor: An empirical investigation for Greece using causality analysis. Tourism Economics, 10(3), 305–316.
Dritsakis, N. (2012). Tourism development and economic growth in seven Mediterranean countries: A panel data approach. Tourism Economics, 18(4), 801–816.
Erkuş-Öztürk, H. (2016). (Un)related variety, urban milieu and tourism-company differentiation. Tourism Geographies, 18(4), 422–444.
European Commission (2006). Innovation in tourism– How to create a tourism learning area. Brussels: European Commission.
European Commission (2016). Guide on EU funding for the tourism sector 2014–2020. Brussels: European Union.
Foray, D., Goddard, J., Beldarrain, X., Landabaso, M., McCann, P., Morgan, K., Nauwelaers, C., & Ortega-Argilés, R. (2012). Guide to research and innovation strategies for smart specialisation. Brussels: S3P - European Union.
Foray, D., & Hall, B. (2011). Smart specialisation: From academic idea to political instrument. MTEI working paper 2011–001. Lausanne.
Fox, J., & Weisberg, S. (2019). An R companion to applied regression (3rd ed.). Thousand Oaks CA: Sage.