M
ASTER IN
F
INANCE
M
ASTER
’
S
F
INAL
W
ORK
D
ISSERTATION
G
AZELLES AND THEIR INITIAL CAPITAL STRUCTURE
F
ILIPA
A
LEXANDRA
N
ORTE
P
INA
M
ASTER IN
F
INANCE
M
ASTER
’
S
F
INAL
W
ORK
D
ISSERTATION
G
AZELLES AND THEIR INITIAL CAPITAL STRUCTURE
F
ILIPA
A
LEXANDRA
N
ORTE
P
INA
S
UPERVISOR:
P
ROFESSORA
NAI
SABELO
RTEGAV
ENÂNCIO“A person who never made a mistake never tried anything new.” Albert Einstein
Acknowledgments
For me, the most deep acknowledge is for those who never do anything with the desire of a thank you in the end. And for all of them in my life that contributed to this crazy but rewarding journey of completing this work I have a few, simple but meaningful, words.
First of all, I want to thank my advisor, Professor Ana Venâncio, for the
recommendations, support and meaningful thoughts which were vital for the success of this work.
To Bank of Portugal, in special to the Economic Studies Department for providing me access to “Central de Balanços” database.
To all my family, specially my beloved parents, for all the support not only during the elaboration of this work but during my entire life. Without you none of this would be possible. You are an inspiration and no words can describe how grateful I am to have you in my life.
To the best friends I could have, for all the support and patience during this long period and during the entire time, because I know sometimes you really need it! They say friends are the family you chose and I’m pretty sure I choose right! Thank you for all the long night conversations, for helping me answering all the questions that came into my mind, and for all the support you gave me in the most challenging periods where I only wanted to quit! You are the best!
Abstract
Gazelle firms have been the center of many studies given their important
contribution for the economy. According to OECD, they are firms with less than 5 years that, have a minimum number of employees, achieve an annualized growth of 20% a year for three consecutive years. The goal of this study is to understand the differences in the capital structure between gazelle and non-gazelle firms. More specifically, we evaluate if gazelle present higher financial needs and if the sources of financing differ from non-gazelle firms.
In order to achieve this goal, we used the “Central de Balanços” database that includes data from all Portuguese firms from 2006 to 2015. Thus, we identify 94 066 non-financial firms born between 2006 and 2011, from those only 307 are gazelles firms.
Our results suggest that gazelle firms raise higher amounts of initial capital, suggesting that these firms have higher financial needs than non-gazelle firms. To finance their activities, gazelle firms tend to use more internal funds, since they present lower debt-to-capital ratios, even considering that the financial and sovereign crisis tend to increase the D/C ratio for companies born between 2008 and 2011.
JEL Classification: M13 M10 G32 G30
Resumo
Empresas gazelas têm sido alvo de muitos estudos dado o seu importante contributo para a economia. Elas são, segundo a OCDE, empresas com menos de cinco anos que, tendo um número mínimo de trabalhadores, atingem um crescimento anualizado de 20% ao ano durante três anos consecutivos. O objetivo deste trabalho é perceber se existem diferenças que distingam a estrutura de capital de empresas gazelas de empresas não gazelas. Mais especificamente, nós avaliamos se as gazelas apresentam maiores necessidades de capital e se as fontes de capital divergem entre os dois tipos de empresa.
A fim de cumprimos o objetivo deste trabalho, utilizámos a base de dados “Central de Balanços” que é composta por dados de todas as empresas portuguesas criadas entre 2006 até 2015. Assim, identificámos cerca de 94 066 empresas não financeiras nascidas entre 2006 e 2011 das quais apenas 307 são gazelas.
Os nossos resultados sugerem que as empresas gazelas obtêm valores mais elevados de capital total inicial, sugerindo que estas empresas têm maiores necessidades de financiamento do que as não-gazelas. A fim de financiarem as suas atividades, as gazelas tendem a usar mais capitais próprios do que dívida, uma vez que apresentam valores do rácio debt-to-capital inferiores às empresas não gazelas, mesmo
considerando que a crise financeira e soberana influenciou a subida deste rácio para empresas nascidas entre 2008 e 2011.
Classificação JEL: M13 M10 G32 G30
Palavras chave: gazelas, empresas de elevado crescimento, estrutura de capital,
Table of Contents
Acknowledgments ... ii Abstract ... iii Resumo ... iv Table of Contents... v List of Tables ... viList of Figures ... vii
List of Abbreviations ... viii
1. Introduction ... 1
2. Literature Background and Hypothesis ... 4
2.1. Gazelle firms... 4
2.2. Initial Capital ... 5
2.3. Sources of financing ... 7
3. Data and Descriptive Statistics ... 9
3.1. Data ... 9
3.2. Sample ... 9
3.3. Descriptive Statistics ... 11
4. Methodology and Results ... 14
4.1. Gazelles ... 14 4.2. Total Capital ... 15 4.3. Sources of financing ... 17 5. Conclusions ... 21 6. References ... 24 7. Tables... 29 8. Figures ... 39
List of Tables
Table I. Definitions of gazelles... 29
Table II. Quartile distribution of number of employees in the first year of activity ... 29
Table III. Distribution of firms by gazelles and non-gazelles in the birth year ... 29
Table IV. Distribution of firms by gazelles and non-gazelles in 5th year ... 30
Table V. Variable description ... 30
Table VI. Employees mean in the birth year and in the 5th activity year ... 31
Table VII. Mean of employees in the birth year... 31
Table VIII. Mean of employees in the end of the growth period ... 31
Table IX. Firms’ distribution by Portuguese region ... 32
Table X. Distribution of firms by sector... 33
Table XI. Average values observed in y1... 34
Table XII. Average values observed in y5 ... 34
Table XIII. Mean and standard deviation analysis y1 ... 35
Table XIV. Mean and standard deviation analysis y5 ... 35
Table XV. Gazelle’s Main Characteristics (Equation 1) ... 36
Table XVI. Start-up’s Initial Capital (Equation 2) ... 36
Table XVII. Start-ups Capital Structure (Equation 3) for First and Fifth Year of Activity ... 37
Table XVIII. Tobit equation 3 estimation for crisis effect evaluation in the first and fifth activity years ... 38
List of Figures
List of Abbreviations
BERR: Department for Business Enterprise & Regulatory Reform
CAE rev3: Classificação Portuguesa de Actividades Económicas – third revision CB: Central de Balanços
HGE: High Growth Enterprise HGF: High Growth Firms
IES: Informação Empresarial Simplificada - Portuguese report mandatory for all firms,
containing accounting, fiscal and statistical information.
OECD: Organisation for Economic Co-operation and Development
POC: Plano Oficial de Contabilidade - Portuguese accounting system until 2009 SME: Small and Medium Enterprise
SNC: Sistema de Normalização Contabilística - Portuguese accounting system used
1. Introduction
Gazelles are a subset of high growth firms (HGF)1, and they are known for their
high growth rates in terms of turnover and employees (OCDE; 2007). Many authors have studied the gazelles phenomenon, however the definition used are not the same, making these studies quite heterogeneous (Daunfeldt, Elert, & Johansson, 2010). Even though previous studies use different definitions, all of them present common characteristics for the gazelle firms: this type of firm are from all sizes but start-ups are overrepresented and they come from all industries (Henrekson, 2009). Most importantly, gazelles are
important players in job creation (Acs & Mueller, 2008).
To achieve higher growth, gazelles require large financial needs (St-Jean, Julien, & Audet, 2008). However, start-ups face difficulties raising financial resources because of their lack of resources and reputation (Huyghebaert & Van de Gucht, 2007). The initial capital provides the firm with the required funding to achieve growth and survive in the first years (Stam & Garnsey, 2007). In fact, we can say that firms with higher access to financial capital tend to present higher growth rates (Audretsch, Keilbach, & Erik, 2004). On the other hand, HGF and gazelles tend to present greater access to capital than non-growth firms (BERR, 2008).
Although start-ups have access to both equity and debt, their first sources of financing are personal funds as owner’s savings and family and friends borrowings (Ang, 1991). This source of funding are of a great importance in the first stage of development of the firm since start-ups do not yet have retained earnings and similar resources (Lucey & Mac an Bhaird, 2006), and thus they have to rely on personal assets (Cassar, 2004). As firms age, they tend to become less opaque and hence their access to bank loans and other
1 High growth firms present an annualized growth greater than 20% for at least three consecutive years
sources of financing become easier (Berger & Udell, 1998). This happens because banks tend to be sceptic regarding new and innovative firms (Audretsch, 2012). To make matters worse, start-ups are also very exposed to asymmetric information: they are new and have no operational data to prove their prospects (Cassar, 2004; Huyghebaert et al., 2007). This means that outsiders do not have access to the same information to evaluate the firm as managers do (Myers, 1984). Asymmetric information represents, then, an extra difficulty in their way of getting their activities financed in the market (Cassar, 2004; Huyghebaert et al., 2007). In addition, start-ups have high probabilities of default than established firms, which may increase the cost of debt and the agency and bankruptcy costs (Cassar, 2004).
Consequently, start-ups prefer to finance their activities with equity (Myers, 1984). In this study, we compare the capital structure of gazelles with non-gazelles firms. Our main goals are: first, understand if gazelles need more funds to finance their high growth and evaluate if they used larger amounts of initial capital.2 Second, evaluate the type
of funds raised by gazelles to finance their activities. More specifically, evaluate if gazelles use more equity or if they use more debt to finance their growth.
For that purpose, we use the Central de Balanços database which allow us not only identify the gazelle and non-gazelle firms among all non-financial private firms born in Portugal but also its capital structure. The database provides accounting information, therefore we are able to identify the sources of funding for gazelle and non-gazelle firms.
Our results suggest that gazelle firms raise higher amounts of initial capital, suggesting that these firms have higher financial needs than non-gazelle firms. To finance their activities, gazelle firms tend to use more internal funds, since they present lower debt-to-capital ratios, even considering that the financial and sovereign crisis tend to increase the D/C ratio for companies born between 2008 and 2011.
Gazelle firms are major job contributors (Acs et al., 2008) and therefore they are a target of interest for policy makers. However, the majority of studies has focused on their characteristics or on demographical and education characteristics of the founders. This work present a different approach, by focusing on the sources of funding of gazelle firms. The results of this study present an opportunity for policy maker to diversify their
strategies when it comes to decide which incentives or programs they should give to promote high growth firm entry.
The remainder of this dissertation is structured as follow. In the section 2, we provide an overview of the previous literature explaining who are gazelles and what are their growth factors. We also provide an overview of sources of financing and capital structure available for start-ups, explaining the specific case of HGF. This section also presents the main hypothesis of this study. Section 3 provides a description of the
database, sample and descriptive statistics. In section 4, we provide the methodology and present the results and finally we present our main conclusions in Section 5.
2. Literature Background and Hypothesis
2.1. Gazelle firms
Until the end of the 80’s decade only a few studies looked at the phenomena of start-ups. Birch (1979) was the first author to state the importance of start-ups in job creation. He distinguishes three types of firms: gazelles, elephants and mice. Gazelles were defined as the fast-growing firms in opposition to mice, defined as start-ups who have no influence in job creation and elephants who are big firms with a high rate of employment but with low growth rates (Birch, 1979).
Previous studies use different definitions for gazelle firms and different measures of growth.3 Because of this fact, the results of these studies are quite
heterogeneous (Daunfeldt et al., 2010). According to OECD (2007), gazelles are a subgroup of HGF, defined as firms presenting an annualized growth greater than 20% for at least three consecutive years with more than ten employees and less than five years of age. The type of measure used to compute growth also affects the definition of gazelle firms. When we consider absolute measures to compute the growth of the firm we find that large firms have more probabilities of being a gazelle firm. In contrast, start-ups are more likely to be classified as gazelles when relative measures are used as criteria (Henrekson, 2009).
Previous studies on HGF and gazelles have usually looked at their economic contribution. These firms generate, on average, more jobs than non-gazelle firms (Henrekson, 2009). In fact, several authors agree on their role as job creators. For example, using data from different countries, Fritsch & Mueller (2004), Mueller, van Stel, & Storey (2008) and Acs et al. (2008) find that gazelle firms are responsible for a large share of employment creation.
The economic contribution of gazelles is not specific to one industry: gazelles are established in all industries (Bos & Stam, 2011; Henrekson, 2009; Autio, 2000; Davidsson & Delmar, 2006; Acs et al., 2008) and, contrarily to the general intuition, they are not over represented in high-technological industry (Henrekson, 2009; Acs et al., 2008). The education of the entrepreneur is one of the determinants of firm growth for start-ups. Founders of HGF are, on average, more educated than other entrepreneurs (Sapienza & Grimm, 1997; Baum, Locke, & Smith, 2001). This happens because education and experience increase the ability of the entrepreneur to present better business plans and to take advantage of market opportunities (Colombo & Grilli 2005). Growth also depends on the size of the team. A founding team instead of an individual have more possibilities of accessing capital and they present a more diverse range of skills and experiences, which may lead to higher of growth (Watson, Stewart, & BarNir, 2003). Two other factors widely discussed in the previous literature also affect firm growth: the age and the size of the start-up. According to Becchetti & Trovato (2002), in their study about Italian firms, growth is dependent on the size of the firm. Also, Levratto, Zouikri, & Tessier (2010) found that larger firms experience lower growth rates. Regarding the age of the firm, the conclusions are similar to the ones concerning the size. High growth firms are, on average, younger than other non-growing firms (Lopez-Garcia & Puente, 2012). According to Audretsch (2012), firms presenting higher growth rates are younger and smaller.
2.2. Initial Capital
Start-ups can raise both, debt and equity. Debt represents the capital borrowed from external parties and that needs to be repaid in a defined period of time (Coleman, 2008). The more common sources of debt are bank loans (both short and long term),
trade credit and leasing (Ang, 1991). In the other hand, equity is the money available permanently to the firm (Coleman, 2008). Equity is mainly raised from shareholders, private investors and venture capitalist (Ang, 1991).
The modern theory of corporate finance is not always applicable to start-ups (Ang, 1991; Berger et al., 1998; Walker, 1989). This happens because start-ups do not have the same access to debt and equity markets as large firms have (Fazzari, Petersen, Blinder, Poterba, & Hubbard, 1988). In fact, start-ups face several problems in raising enough capital to start their business (Beck, Demirgüç-Kunt, & Maksimovic, 2005; Korosteleva & Mickiewicz, 2011). In their beginning, start-ups do not have any operational history or reputation and hence they face more problems when it comes to fund their operations (Huyghebaert et al., 2007).
The investment plan of a firm is closely connected with the firm access to resources. This means that the financial resources availability is also closely connected with firm growth. Thus, firms with more liquidity constraints face more difficulties in reaching their investment plans and to achieve higher growth rates. (Fazzari et al., 1988). Therefore, in order to achieve high growth rates, gazelles tend to present higher financial needs and this means that the access to resources is one of variables that contributes to the growth of a firm (St-Jean et al., 2008).
Funding activities of gazelles are not very different from non-gazelles’ (Cunneen & Meredith, 2007) however, the need of financial resources is connected with the growth ambitions of a firm (BERR, 2008), and initial capital plays an important role in the growth path of a start-up. Following this, firms with access to financial capital tend to present higher growth rates (Audretsch et al. 2004) and in the opposite way firms with more financial constraints are more likely to growth less present an higher volatility (Fagiolo, 2006). Therefore, HGF as gazelles require higher access to financial capital than
non-growth firms (BERR, 2008)
H1: Gazelles require more initial capital than non-gazelles firms to start their activity
2.3. Sources of financing
To finance their activities, start-ups can use debt and equity. Nevertheless, their main funding sources are personal funds (owner’s savings and family and friends borrowings). In the debt side, start-ups prefer bank loans and leasing (Ang, 1991).
Due to the difficulties in getting access to financial markets, bank loans and trade credit are, following the personal assets, two of the most used tools to finance start-ups (Walker, 1989). The idea of not having a clear distinction between formal and informal sources of financing, supported by Berger et al. (1998), is very important in the access of bank loans. Banks rely on the personal assets of the owner to give them the credit they need to operate . The simple fact that entrepreneurs must use their personal assets and savings to finance the operations of the firm or use them as collateral to access external financing implies that the bankruptcy of the firm may also lead to the bankruptcy of the owner (Ang, 1991).
The financial challenges faced by start-ups change according to the development stage of the firm (Walker, 1989; Cassar, 2004). As it ages, the start-up can use the retained earnings to finance its operations (Walker, 1989; Lucey et al., 2006). Nevertheless, in the earlier stages of development, personal funds and informal
investment of family and friends are main sources of financing (Walker, 1989; Lucey et al., 2006; Cassar, 2004; Ang, 1991; Berger et al., 1998).
Banks tend to be more sceptic regarding new and innovative start-ups (Audretsch, 2012) and because of that, the access to resources can represent a challenge for the
founder and, hence, a constraint to the growth of a start-up (Parker, Storey, & van Witteloostuijn, 2010). In fact, in the beginning of their existence start-ups depend on inside capital, and as they mature and growth, firms tend to become less opaque and gain more experience and hence have access to more sources of financing which may include bank loans and external equity (Berger et al., 1998). This fact connects with the life cycle theory which suggests that until a start-up reaches the maturity, it will pass through different stages and this different stages bring new challenges, new resources and new sources of funding (Berger et al., 1998; Cassar, 2004; Lucey et al., 2006).
Start-ups face also another important challenge: higher probabilities of default which in the end raises their agency and bankruptcy costs and the cost of debt (Cassar, 2004). The opaqueness mentioned previously is also connected with an important common problem:, asymmetric information. This problem is, according to Ang (1991), very serious in start-ups because they do not have historical and operational data to prove their future
prospects. Thus, asymmetric information makes it difficult to raise funds (Cassar, 2004; Huyghebaert et al., 2007; Nofsinger & Wang, 2011). This argument is connected with the pecking order theory, which assumes that managers of the firm have better information than outsiders and try to signal their quality to the market to distinguish themselves from low quality start-ups (Myers, 1984). To distinguish themselves from low quality ventures, founders might invest more of their own money. This will signal to the market that the founder is committed to the new venture and that he/she believes in their quality and profitability. The arguments presented above suggest that gazelles will prefer to finance their activities using internal capital.
H2: Gazelles are more likely to use equity than non-gazelles to finance their initial activities
3. Data and Descriptive Statistics
3.1. Data
Our empirical analyses are based on the Central de Balanços (CB) database. This database is built with the annual information from Informação Empresarial Simplificada (IES), that contains tax, accounting and statistical information at the firm level for all non-financial firms4 between 20065 and 2015. The database provides
information of, on average, around 400 000 firms. All with a unique identifier that make possible to match the different variables and the firm. Every year firms report
accounting information, including balance sheet variables as debt and equity amounts, sales and also non-accounting information as the number of employees, industry, location and relevant events that may cause structural changes. The database also includes the firm’s entry year.
Note that during the year of 2009, the Portuguese accounting system changed from Plano Oficial de Contas (POC) to Sistema de Normalização Contabilística (SNC) and this changed the way that Portuguese firms reported their accounting information and thus in the information presented in the database.
3.2. Sample
From CB database, we excluded all firms operating in fishing and agriculture sectors and all non-profit or social organizations since they present special
characteristics that differ from the others in the sample. Then, we select all new start-ups that have experienced organic growth as suggested by Holzl & Friesenbichler
4 This discrimination in financial and non-financial firms is made according to the European System of
(2007), excluding firms that experienced structural changes such as mergers, acquisitions and splits over.
In order to avoid considering firms that could be considered as ghost we excluded from our dataset all firms with zero employees. We also excluded firms with negative total debt, we consider them as outliers.
Next, we select all the start-ups born between 2006 and 2011 and followed their performance until their 5th year. Therefore we achieved six different cohorts of firms:
2006-2010, 2007-2011, 2008-2012, 2009-2013, 2010-2014 and 2011-2015. To distinguish between gazelle and non-gazelle firms we follow OECD ‘s (2007) definition. Gazelles are start-ups with a maximum of five years that accomplish an annualized growth rate of 20% for three consecutive years. OECD (2007)
recommends a threshold for the number of employees but do not consider the birth year for the growth period. The reason for this last recommendation is to avoid the
overgrowth measures since start-ups may experience growth in different periods of the year. Note that OECD’s (2007) definition recommends a threshold of at least ten initial employees, however this number should be adjusted to the context of country. For the case of Portugal using the ten employees the sample gazelles firms would be very small. Thus we decided to consider the fourth quartile of the initial size distribution as
threshold. Table presents the quartile distribution for the size of start-ups and shows that the size in the third quartile is three employees.
To sum up, for start-ups born in 2006 we considered the years between 2007 and 2010 the growth period, following in this way the age criteria and we define as gazelles those firms that achieved an annualized growth of more than 20% in their number of employees and have at least 3 employees in 2007. We followed the same logic for all the other five cohort of startups.
Our sample includes 94 066 start-ups of which 93 759 are non-gazelles and 307 are gazelles, representing 0,3% of the total amount of firms as shown in Table . In the end of the growth period (fifth activity year), 30 026 were no longer in activity. Thus, in the fifth year, our sample included 64 040 firms, 63 733 non-gazelles and 307 gazelles. The weight of gazelles increased to 0,5% as shown in Table .
3.3. Descriptive Statistics
Table presents the description of the relevant variables on this study.
Table 6 to Table 14 presents the descriptive statistics of the sample for the first and fifth year of activity separated by gazelle and non-gazelle firms. Start-ups in our sample are, on average, small with 2,91 employees in the birth year (y1) and it increases to 4,26 in the fifth activity year (y5). On average, gazelles employ more people in both the first and fifth years of activity (see Table 6). In Tables 7 and 8, we divide our sample per birth year and analyze the average number of employees in the first and fifth year of activity, respectively. In the end of the growth period, gazelles have more employees independently of the cohort considered (see Table ). However when we look at the number of employees in the birth year, gazelle firms born in 2006, 2008, 2009 and 2010 present lower average employees that non-gazelles and these are the years with less gazelles created (Table ).
The majority of firms, both gazelles and non-gazelles are located in Lisbon and Oporto. As can be seen in Figure 1 and Table more than 20% of gazelles are located in Oporto (24,1%) followed by Lisbon (21,5%) districts. Braga has also a significant amount of gazelles (15,96%), representing the third district with more gazelles in the country. For non-gazelles, the higher amount of firms is located in Lisbon (26,46%) followed by Oporto (19,77%) district (Table 9). The distribution of firms by districts in
fifth year did not present major changes and the weights presented in Figure 1 are also valid in y5. Non-gazelle firms decreased in Lisbon district to 25,44% and Oporto have almost 20% of firms (19,99%). In the fifth year of activity, the regional distribution of gazelles remained unchanged.
Table presents the distribution of our sample by sector of activity6. The sectors
with more gazelle representativeness are in the construction (20.5%) and manufacturing sectors (20,2%), which includes the textile and food and beverage industries. Following those are wholesale and retail trade (16,6%) and administrative activities and support services (11,7%). Non-gazelle firms are most represented in wholesale and retail trade sectors (27,5%) followed by construction (14,1%). As in the regional distribution, data for the fifth year shows that the relevant sectors are remain the same as in the birth year.
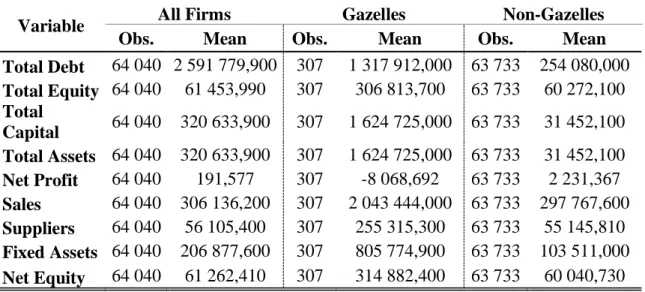
Table 11 presents the summary statistics for the financial variables. On average, capital and assets are higher for gazelles than non-gazelle firms in their birth year. In the liabilities side, the amount of trade credit and loans are substantially higher. The total amount of equity follows the same tendency presenting higher values for gazelle firms, in accordance with previous literature. However, the average of net profit for gazelle firms is negative while non-gazelles present, on average, positive amounts.
Our main goal is to evaluate the initial capital structure of gazelle firms thus, the growth period considered to define if a firms is a gazelle or not is from the second to the fifth activity year, the data we used are from the birth year. However, our data refers to the end of the year, and thus equity includes the net profit, which is not considered a primary source of financing (Lucey et al., 2006). Thus, in order to get the closest approximation for the initial capital structure, we also analyzed the amount of equity excluding the net profit (net equity). With this we have excluded the effect of a
6 The sector of activity follows the third revision of Portuguese industry codes (Classificação Portuguesa
primary source of financing in the initial capital structure. The values for the net equity are higher for gazelles compared to non-gazelles. Therefore, in the first year of activity, firms with higher growth rates present higher amounts of capital, debt and assets. This is consistent with Audretsch et al. (2004), which claim that firms with greater access to financial capital tend to present greater growth rates.
Table 12 presents the summary statistics for the fifth year of activity. As expected, gazelles experienced a substantial growth in size. When comparing gazelles with non-gazelles, the conclusions are the same as the ones mentioned for birth year: only net profit is, on average, lower for gazelles.
Table and Table shows the summary statistics for the dependent and
independent variables of our models in the first and fifth year of activity. In both, first and fifth years, gazelles have higher size, higher amounts in trade credit and, despite of their lower net profit, they are more profitable. In the birth year, the proportion of fixed assets to total assets is higher for non-gazelles but this change in the fifth year where gazelles present higher values.
We also analyzed the debt-to-capital ratio (DC). This ratio represents the weight of debt in the total capital computed as Total Debt / (Total Debt + Total Equity – Net Profit). The total debt includes all short term and long terms liabilities. It is included, among others with smaller influence, provisions, financial debt (securities and bank loans), accruals and deferrals, accounts payable (including debts to suppliers) and government payables. In both years, gazelles present lower values of debt to capital than non-gazelles. This means that the weight of debt in total capital is lower for gazelle firms.
4. Methodology and Results
The goal of this study is to understand if the gazelles’ capital structure is different from non-gazelle firms. For that purpose, we analyze the total capital (equity + debt) and the debt-to-equity and debt-to-capital ratios and compare if there are significant differences between gazelles and non-gazelles.
4.1. Gazelles
To better frame the empirical results, we start by understanding the main
characteristics of gazelle compared to non-gazelle firms in the birth year, by estimating the following equation:
𝑦𝑖𝑡𝑗𝑐 = 𝛽𝑡+ 𝛽𝑗 + 𝛽𝑐 + 𝑋𝑖𝑡′𝛽 + 𝜖𝑖𝑡𝑗𝑐 [1]
where i is the firm, t is the entry year of the startup, j is the district where the firm is located and c corresponds to the industry at two-digit level according to CAE rev 3.
Our dependent variable, gazelle, is a dummy variable equaling one when a startup has less than 5 years of age and presents an annualized growth in the number of employees of at least 20% for a least 3 consecutive years, and zero otherwise.
X’i is a vector of financial variables namely: initial size, profitability, fixed
assets and sales, following Cassar & Holmes (2003) and trade credit. Size is the natural logarithm of the number of employees of the firm in the birth year. Profitability is a ratio between the net profit and sales. This ratio presents the proportion of the sales that actually remains in the firm. FixedA is the ratio between the amount of fixed assets (both tangible and intangible7) in total assets. FixedA ranges from zero to one and the
closer to one the higher the weight of fixed assets in the size of the firm. Sales is the
7 Cassar & Holmes (2003) suggest the use of ratio between fixed tangible assets and the total assets. In
our database, we did not have the division between tangible and intangible assets so we used both variables to compute the ratio.
natural logarithm of firm’s revenue. We also include TCredit computed as the natural logarithm of trade credit, since it represents one of the primary sources of financing for start-ups.
Table shows the coefficients estimates for Equation 1 using the Probit model. Gazelles have larger initial sales and trade credits. To define gazelles, we use OECD (2007) definition and used the growth in employees. However, OECD (2007) also considers the use of sales to determine the growth of firms so it is not surprising to see sales being statistically significant variable for gazelle firms. Trade credit is one of primary sources of funding for start-ups (Walker, 1989). Consistent with previous literature, we find a positive and significant coefficient. Size is one of the characteristics most studied in the gazelle literature. According to previous literature, gazelles can exist with all sizes. Consistent with prior studies, the coefficient on size is negative and not statistically significant, suggesting that gazelle and non-gazelle have similar sizes. The coefficients on Profitability and FixedA are also a not statistically significant suggesting that gazelle and non-gazelles have similar net profit margins and similar ratio of fixed assets to total assets.
4.2. Total Capital
Next, we evaluate the amount of funding of gazelle and non-gazelle firms. Total capital represents the total financial needs of the firm and include equity and debt. To understand if the financial needs of gazelle and non-gazelle are different we estimate the following equation for the birth year:
𝑇𝑜𝑡𝐶𝑎𝑝𝑖𝑡𝑗𝑐= 𝛽𝑡+ 𝛽𝑗 + 𝛽𝑐 + 𝛽 𝑔𝑎𝑧𝑒𝑙𝑙𝑒 + 𝑋𝑖𝑡′𝜔 + 𝜖
𝑖𝑡𝑗𝑐 [2]
where i is the firm, t is the entry year of the startup, j is district where the firm is located and c corresponds to the industry at two-digit level according to CAE rev 3.
The dependent variable TotCap is the natural logarithm of the total capital excluding the net profit (total equity + total debt – net profit).
Our variable of interest is Gazelle, is a dummy variable equaling one when a startup has less than 5 years of age and presents an annualized growth in employees of at least 20% for at least 3 consecutive years, and zero otherwise. In accordance with previous literature, the coefficient associated with Gazelle variable should be
statistically significant and positive, suggesting that gazelles need more initial capital to finance their growth.
X’i is a vector of relevant financial variables namely: size, profitability, fixed
assets and sales, as explained in Section 4.1.
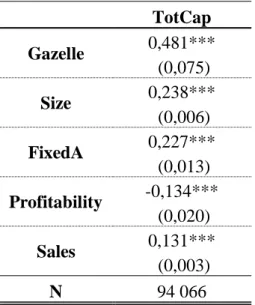
Table presents the coefficient estimates for Equation 2 using Tobit model. As expected, the total amount of capital is higher for gazelle firms than for non-gazelle firms in the birth year. The coefficient associated with gazelle variable is positive and statistically significant. This is in accordance with Audretsch et al. (2004) and suggest that gazelles present higher financial needs than non-gazelle firms and that they tend to finance their growth with more funds.
In terms of control variables, start-ups with higher initial sales, employees and fixed assets are also more likely to raise more capital. According to the results presented in Table , the effect in the total capital caused by a 1% increase in the assets of the firm is 0,238%. This effect is close to the one caused by an increase of 1% in the ratio between the fixed assets and the total assets of the company, which is 0,227%. As mentioned, sales has also a positive impact in the total capital, in fact, an increase of 1% causes a change of 0,131% in the total capital of the company.
Table also shows us that the profitability ratio is statistically significant. It has, in contrast with the other statistically significant variables mentioned, a negative impact in the explanation of the total capital.
In conclusion, the results presented above give us proof to confirm our H1 since gazelles have the tendency to present higher amounts of total capital.
4.3. Sources of financing
Finally, the type of funds raised may also determine the growth of start-ups. In this subsection, we evaluate if there is substantial differences in the type of funds raised by gazelles and non-gazelles. To understand this, we estimate the following equation:
𝐷𝐶𝑖𝑡𝑗𝑐= 𝛽𝑡+ 𝛽𝑗+ 𝛽𝑐 + 𝛽 𝑔𝑎𝑧𝑒𝑙𝑙𝑒 + 𝑋𝑖𝑡′𝜔 + 𝜖
𝑖𝑡𝑗𝑐 [3]
The dependent variable DC is the debt-to-capital ratio. This ratio represents the weight of debt in the total capital and it is computed as Total Debt / (Total Debt + Total Equity – Net Profit). DC ranges between zero and one. The closer the ratio is to one, the higher the weight of debt in the total capital. As explained previously in Section 3.3, in order to make this ratio closer to the initial ratio, we excluded net profit from the total equity. The remaining variables were explained in the previous section.
Once again, Gazelle is our variable of interest. Previous literature show that start-ups tend to use personal funds as a primary source to finance their growth (Myers, 1984). Thus, our expectations is that the coefficient associated with gazelle variable is negative and statistically significant.
X is a vector of financial variables: size, profitability, fixed assets and sales and trade credit. FixedA reflects the capital intensity of the start-ups. Start-ups with larger amount of fixed assets require larger amounts of funds, which could be finance with bank loans or leasing. According to Ang (1991), leasing is one of the most common
debt sources. Therefore, we expected a significant and positive coefficient associated with this variable
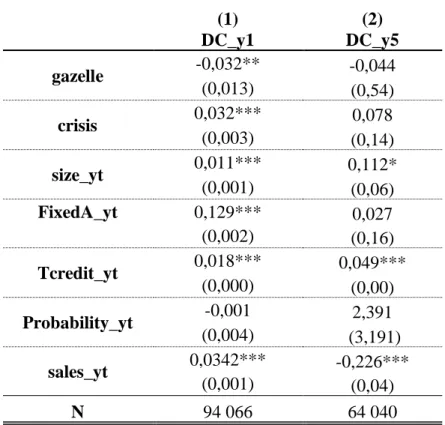
The results of our estimation (using Tobit model) are presented in Table . The first column presents the estimation for the first year of activity, while the second one present the results for fifth year. In the first year, the coefficient associated with gazelle variable is negative and statistically significant, which suggests that gazelle firms present lower debt-to-capital ratios meaning that the weight of debt in the total capital is lower. However, when we considered the fifth year of activity, the coefficient
associated with gazelle variable is no longer significant. The initial capital structure is relevant in the first year of activity of gazelles, nevertheless along the time its structure is no longer different between gazelle and non-gazelle firms.
Although size has a positive impact in debt-to-capital in both first and fifth years of activity this impact is higher in the fifth year. When we increase 1% in the assets of the firm in its birth year we achieve a change of 0,011% in the debt-to-capital, however the same increase in the fifth year causes a change of 0,112%.
Trade credit has the same behavior decreasing its effect on the debt-to-capital ratio from birth year to fifth activity year. The increase of 1% in the trade credit causes a change of 0,018% and 0,049% in the debt-to-capital in the birth and fifth years,
respectively.
Sales and fixed assets ratio (fixed assets by total assets) presents the inverse behavior. The impact in the debt-to-capital of an increase of 1% in fixed asset ratio decreases from 0,129% in the birth year to 0,027 in the fifth activity year.
The decrease is even more drastic when we analyze sales. The impact that an increase in sales has in the debt-to-capital changes from positive to negative in five years of
increases by 0,034%, however, the same increase in the fifth year of activity causes a decrease of 0,226%.
Our sample includes firms born between 2006 and 2011. During this period, Portuguese economy suffered a severe financial and sovereign crises, which culminated in 2011on asking for a bailout from the European Union, International Monetary Fund and European Central Bank. To extrapolate the effect of financial crisis in gazelle’s capital structure, we estimated Equation 4 for start-ups established between 2006 and 2010:
𝐷𝐶𝑖𝑡𝑗𝑐= 𝛽𝑡+ 𝛽𝑗+ 𝛽𝑐 + 𝛽1𝑔𝑎𝑧𝑒𝑙𝑙𝑒 + 𝛽2𝑔𝑎𝑧𝑒𝑙𝑙𝑒𝑥𝑐𝑟𝑖𝑠𝑖𝑠 + 𝑋𝑖𝑡′𝜔 + 𝜖
𝑖𝑡𝑗𝑐 [4]
The variable crisis is a dummy variable that equals zero for the period before the financial crisis, for firms born in 2006 and 2007and one for firms born between 2008, 2009 and 2010 after crisis period.
The results of this estimation are presented in Table . The first column presents the estimation for the first year of activity, while the second one present the results for fifth year. As can be seen in the first column of Table in the first year of activity crisis presents a positive and statistically significant coefficient. This means that firms born between 2008 and 2011 had their capital structure choices conditioned by the
restrictions caused by the financial and sovereign crisis. Since crisis has a positive coefficient its effect on the Debt to Capital ratio, one can conclude that firms born in the mentioned cohort are more likely to present higher D/C ratios which means that they are more likely to use more debt to finance their activities.
When we look at the fifth of activity (second column of Table ) the conclusions differ from the previous analysis. Five years after the creation of the firm, the timing of the start of business (before or after crisis) seems to be not significant in the capital
structure choices. This is because the variable crisis is not statistically significant in the explanation of the Debt to Capital ratio in the fifth year of activity.
To sum up, it is possible to say we proved H2 since our results suggested that capital structure is an important aspect to consider while funding a startup since the weight of debt in the total capital is lower for gazelles, even considering that the
financial and sovereign crisis tend to increase the D/C ratio for companies born between 2008 and 2011.
5. Conclusions
Gazelles are firms that present extraordinary growth and consequently are major contributors for the economy. Gazelles are a very interesting topic to study in the entrepreneurship literature. In this study, we evaluate if there were relevant differences in the initial capital structure of gazelle and non-gazelle firms.
For that purpose, we used a sample of 94 066 non-financial firms born between 2006 and 2011We used data from the “Central de Balanços”, a database with
information of balance sheet of all Portuguese firms. We also analyzed their situation in the fifth activity year using a sample of 64 040 firms.
We started by analyzing the main characteristics of gazelles. Gazelles have larger trade credits and sales. As suggested by previous literature, trade credit is one of the primary sources for a startup to get financed when facing financial constraints. Sales is, an alternative to employees to compute the growth of a company, this the higher sales presented by gazelles in our sample are in accordance with previous literature.
Previous literature firms with higher access to capital present higher growth rates (Audretsch et al., 2006). Our results suggest that, in order to start up their activities, gazelles raise more capital that non-gazelles. Start-ups with higher initial sales, such as gazelles, as mentioned above, are also more likely to raise more capital. Given that, we can say we are in accordance with our first hypothesis.
In order to understand if the capital structure of gazelle and non-gazelle firms were different, we estimated the debt-to-capital ratio. We used the total capital
excluding net profit in order to use an amount closer to the real initial value. Our results suggest that gazelles raise less debt as a percentage of total capital when compared with non-gazelle firms. We also estimated the same regression for the fifth year of activity –
the end of the growth period of gazelles. We reached the conclusion that capital structure is no longer different between gazelle and non-gazelle firms..
To bring some robustness to our study we studied the impact of the financial and sovereign crisis in the debt to capital ratio including a dummy variable, crisis, equaling zero for firms born between 2006 and 2007 and one for firms born between 2008 and 2011. The first one represents firms before the financial crisis and the second one firms from the subsequent period. The main conclusion of our analysis was that crisis had a positive impact in the D/C ratio which means that companies born in the period between 2008 and 2011 tend to present higher demand for debt, causing an increase in the ratio.
To sum up, in order to finance their activities, gazelle firms tend to use more internal funds, since they present lower debt-to-capital ratios, even considering that the financial and sovereign crisis tend to increase the D/C ratio for companies born between 2008 and 2011 which proves our second hypothesis.
This dissertation presents some limitations. First, we only had data from 2006 to 2015 and this limited our sample to firms born between 2006 and 2011, resulting in a small number of gazelles in our sample. Second, some of the variables we used presented negative values which made more difficult to apply the logarithmic
transformation. Second, we used accounting variables, and the Portuguese accounting system suffered a severe transformation and there was some variables we weren’t able to use since there is no perfect match between both systems.
For future matters and given our limitations, it would be interesting to use a larger sample, this way we would have a higher number of gazelles in the sample. It would be also important to study more deeply the impact on the financial crisis in the capital structure of gazelles. Venture capitalists and business angels also play an important role in financing business start-ups. In this work we didn’t have the data to
identify these type of financing sources, but future research can focus their attention in these sources and try to understand if gazelles were able to get better access to these funds. Finally, in our work we used the number of employees as a measure of growth, however, it is also possible to use sales or both and it would be interesting to understand if there are significant changes when we use different variables to estimate growth.
6. References
Acs, Z., & Mueller, P. (2008). Employment effects of business dynamics: Mice, gazelles and elephants. Small Business Economics, 30, 85–100.
Ang, J. (1991). Small Business Uniqueness and the Theory of Financial Management. The Journal of Entrepreneurial Finance, 1, 1-13.
Audretsch, D. (2012). Determinants of high-growth entrepreneurship. OECD/DBA report, 1-37.
Audretsch, D., Keilbach, M., & Erik, L. (2004). Entrepreneurship and Economic Growth. New York: Oxford University Press., 949–959.
Autio, E. A. (2000). Economic impact of gazelle firms in Finland. Working Papers Series 2000:3, Helsinki University of Technology, Institute of Strategy and International Business, Helsinki.
Baum, R., Locke, E., & Smith, K. (2001). A Multidimensional Model of Venture Growth. Academy of management journal, 44(2), 292-303.
Becchetti, L., & Trovato, G. (2002). The determinants of growth for small and medium sized firms. The role of availability of external finance. Small Business
Economics 19, 291–30.
Beck, T., Demirgüç-Kunt, A., & Maksimovic, V. (2005). Financial and Legal Constraints to Growth: Does the Firm Size Matter? Journal of Finance, 137– 177.
Berger, A., & Udell, G. (1998). The Economics of Small Business Finance: The Roles of Private Equity and Debt Markets in the Financial Growth Cycle. Journal of Banking & Finance, 22(6-8), 613–673.
BERR, Department for Business Enterprise & Regulatory Reform (BERR). (2008). High Growth Firms in the United Kingdom: Lessons from an Analysis of
Comparative UK Performance. BERR Economics Paper No. 3, November, 1-54. Birch, D. L. (1979). The job generation process. Cambridge, MA: MIT Program on
Neighborhood and regional Change., 1-295.
Bos, J., & Stam, E. (2011). Gazelles, industry growth and structural change. Discussion Paper Series/Tjalling C. Koopmans Research Institute,11(02)., 145-169.
Cassar, G. (2004). The financing of business start-ups. Journal of Business Venturing, 19(2), 261–283.
Cassar, G., & Holmes, S. (2003). Capital structure and financing of SMEs: Australian evidence. Accounting and Finance, 261-283.
Coleman, S. (2008). The Determinants of Capital Structure in Small Firms: New Evidence From the 2003 Survey of Small Business Finance. International Council for Small Business World Conference, 1-28.
Colombo, M., & Grilli, L. (2005). Young Firms' Growth in High-Tech Sectors: The Role of Founders' Human Capital. Research Policy, 34, 795-816.
Cunneen, D., & Meredith, G. (2007). Entrepreneurial Founding Activities that Create Gazelles. Small Enterprise Research, 15(1), 39-59.
Daunfeldt, S., Elert, N., & Johansson, D. (2010). The economic contribution of high-growth firms : Do definitions matter ? Stockholm: The Ratio Institute, 1-20. Davidsson, P., & Delmar, F. (2006). High-growth firms and their contribution to
employment: The case of Sweden. Entrepreneurship and the growth of firms, 156-178.
Fagiolo, G. (2006). Do liquidity constraints matter in explaining firm size and growth? Some evidence from the Italian manufacturing industry. Industrial And
Corporate Change, 15(1), 1-39.
Fazzari, S., Petersen, B., Blinder, A., Poterba, J., & Hubbard, R. (1988). Financing Constraints and Corporate Investment. Brookings Papers On Economic Activity, 1988(1), 141.
Fritsch, M., & Mueller, P. (2004). The Effects of New Business Formation on Regional Development over Time. Regional Studies, 38(8), 961-975.
Henrekson, M. &. (2009). Gazelles as job creators: A survey and interpretation of the evidence. . Small Business Economics, 35, 227-244.
Holzl, W., & Friesenbichler, K. (2007). Are gazelles more innovative than other firms? WIFO, Austria (mimeo).
Huyghebaert, N., & Van de Gucht, L. (2007). The Determinants of Financial Structure: New Insights from Business Start-ups. European Financial Management, 13(1), 101-133.
Korosteleva, J., & Mickiewicz, T. (2011). Start-Up Financing in the Age of Globalization. Emerging Markets Finance And Trade, 47(3), 23-49.
Levratto, N., Zouikri, M., & Tessier, L. (2010). The Determinants of Growth for SMEs - A Longitudinal Study from French Manufacturing Firms. SSRN Electronic Journal. http://dx.doi.org/10.2139/ssrn.1780466.
Lopez-Garcia, P., & Puente, S. (2012). What makes a high-growth firm? A dynamic probit analysis using Spanish firm-level data. Small Business Economics, 39(4), 1029–1041.
Lucey, B., & Mac an Bhaird, C. (2006). Capital Structure and the Financing of Smes: Empirical Evidence From an Irish Survey. SSRN Electronic Journal.
http://dx.doi.org/10.2139/ssrn.905845\.
Mueller, P., van Stel, A., & Storey, D. J. (2008). The Effects of New Firm Formation on Regional Development over Time: The Case of Great Britain. Small Business Economics, 30-59.
Myers, S. (1984). Capital structure puzzle. The Journal of Finance, 39(3), 574-592. Nofsinger, J., & Wang, W. (2011). Determinants of start-up firm external financing
worldwide. Journal of Banking & Finance.
OECD. (2007). Eurostat − OECD Manual on Business Demography Statistics. OECD Publishing.
Parker, S., Storey, D., & van Witteloostuijn, A. (2010). What happens to gazelles? The importance of dynamic management strategy. Small Business Economics, 35(2), 203-226.
Sapienza, H., & Grimm, C. (1997). Founder Characteristics, Start-Up Process, and Strategy/Structure Variables as Predictors of Shortline Railroad Performance. Entrepreneurship: Theory & Practice, 22(1), 5-24.
Stam, E., & Garnsey, E. (2007). Entrepreneurship in the Knowledge Economy. Centre for Technology Management Working Paper Series No: 2007/04, 1-30.
St-Jean, E., Julien, P., & Audet, J. (2008). Factors Associated With Growth Changes in “Gazelles”. . Journal Of Enterprising Culture, 16(02), 161-188.
Walker, D. (1989). Financing the small firm. Small Business Economics, 1(4), 285-296. Watson, W., Stewart, W., & BarNir, A. (2003). The effects of human capital,
perceptions of firm profit and growth. Journal of Business Venturing, 18(2), 145-164.
7. Tables
Table I. Definitions of gazelles
Author Definition of gazelle
Birch (1979) Gazelles are compared to elephants and mice. Gazelles are businesses with a threshold of $100,000 in revenue and achieved at least 20% yearly growth in sales Daunfeldt, Elert, &
Johansson (2010)
Gazelles are the 1% of the firms with higher growth in 3, 5 and 7 years of activity.
OECD (2007) Gazelles are firms presenting an annualized growth greater than 20% for at least three consecutive years, achieving a threshold in terms of employees and with less than five years.
Acs & Mueller (2008) Gazelles are new firms presenting rapid growth rates. They define gazelles in opposition to "Elephants" and "Mice"
Bos & Stam (2011) Gazelles are firms with age between 5 and 10 years that has achieved 20 employees.
Autio (2000) Gazelles are all firms that, for three years, are capable of increase their sales by at least 50%
Davidsson & Delmar
(2006) Gazelles are the 10% of the firms with fastest growth
Table II. Quartile distribution of number of employees in the first year of activity quartile obs. employees
2nd quartile 94 066 1
3rd quartile 94 066 2
4th quartile 94 066 3
Table III. Distribution of firms by gazelles and non-gazelles in the birth year Absolute Relative
Gazelles 93 759 99,674%
Non-Gazelles 307 0,326%
Table IV. Distribution of firms by gazelles and non-gazelles in 5th year
Variable Absolute Relative
Gazelles 63 733 99,521%
Non-Gazelles 307 0,479%
64 040 100,0%
Table V. Variable description
Variable Description
gazelle Dummy variable equalling one when a start-up has less than 5 years of age and presents an annualized growth in employees of at least 20%
during 3 consecutive years, and zero otherwise
size_yt Natural logarithm of the annual number of employees in a given year. y1 represents the first activity year while y5 presents the fifth year of
activity.
FixedA_yt
Ratio between the amount of fixed assets in relation to the total assets of the firm in a given year (y1 represents the first activity year while y5 presents the fifth year of activity). Fixed assets include both
tangible and intangible assets. FixedA ranges from zero to one and the closer to one the higher is the weight of fixed assets in the size of the firm.
Tcredit_yt
Natural logarithm of the total amount of trade credit in a given year. y1 represents the first activity year while y5 presents the fifth year of activity.
Profitability_yt
Profitability is a ratio between the net profit and the total amount of sales of a firm. This ratio presents the proportion of the sales that actually remains in the firm. y1 represents the first activity year while y5 presents the fifth year of activity.
TotCap
Natural logarithm of the total amount capital discounted with the net profit to get a more accurate amount of initial capital (debt + equity – net profit) in the birth year.
DC_yt
The debt-to-capital ratio compares the amount of debt and total amount of capital used to finance the firm in a given year. y1 represents the first activity year while y5 presents the fifth year of activity.
DC ranges from zero to one and the closer to one and the higher the weight of debt in the total capital
Table VI. Employees mean in the birth year and in the 5th activity year
Variable All Firms Gazelles Non-gazelles Obs. Mean Obs. Mean Obs. Mean
Birth year 94 066 2,910 307 3,140 93 759 2,910 End of growth
period (y5) 64 040 4,255 307 31,009 63 733 4,126 Note: The 5th activity year corresponds to the end of growth period for gazelles.
Table VII. Mean of employees in the birth year
birth year reference year
All Firms Gazelle Non-gazelle Obs. Obs. Mean Obs. Mean
2006 2006 12 198 54 3,050 12 144 3,202 2007 2007 16 575 65 4,175 16 510 2,980 2008 2008 16 191 47 2,534 16 144 2,966 2009 2009 12 133 34 2,626 12 099 2,835 2010 2010 16 826 42 2,595 16 784 2,944 2011 2011 20 143 65 3,230 20 078 2,626
Table VIII. Mean of employees in the end of the growth period
birth year reference year
All Firms Gazelle Non-gazelle Obs. Obs. Mean Obs. Mean
2006 2010 8 496 54 41,796 8 442 5,238 2007 2011 11 325 65 32,061 11 260 4,258 2008 2012 11 023 47 24,170 10 976 4,116 2009 2013 8 183 34 25,470 8 149 4,209 2010 2014 11 357 42 28,642 11 315 3,708 2011 2015 13 656 65 30,369 13 591 3,631
Table IX. Firms’ distribution by Portuguese region
Region
1st activity year 5th activity year
Gazelles Non-gazelles Gazelles Non-gazelles Obs. Percentage Obs. Percentage Obs. Percentage Obs. Percentage
Aveiro 19 6,189% 5 883 6,275% 19 6,189% 4 127 6,475% Beja 3 0,977% 752 0,802% 3 0,977% 542 0,850% Braga 49 15,961% 8 720 9,300% 49 15,961% 6 105 9,579% Bragança 2 0,651% 803 0,856% 2 0,651% 614 0,963% Castelo Branco 1 0,326% 1 147 1,223% 1 0,326% 853 1,338% Coimbra 7 2,280% 3 184 3,396% 7 2,280% 2 247 3,526% Évora 3 0,977% 1 023 1,091% 3 0,977% 718 1,127% Faro 13 4,235% 4 927 5,255% 13 4,235% 3 053 4,790% Guarda 4 1,303% 871 0,929% 4 1,303% 670 1,051% Leiria 9 2,932% 4 182 4,460% 9 2,932% 3 011 4,724% Lisboa 66 21,498% 24 807 26,458% 66 21,498% 16 215 25,442% Portalegre 1 0,326% 635 0,677% 1 0,326% 438 0,687% Porto 74 24,104% 18 538 19,772% 74 24,104% 12 738 19,987% Santarém 6 1,954% 3 090 3,296% 6 1,954% 2 169 3,403% Setúbal 23 7,492% 6 159 6,569% 23 7,492% 3 885 6,096% Viana do Castelo 1 0,326% 1 761 1,878% 1 0,326% 1 263 1,982% Vila Real 5 1,629% 1 388 1,480% 5 1,629% 997 1,564% Viseu 7 2,280% 2 659 2,836% 7 2,280% 1 942 3,047% Angra do Heroísmo 2 0,651% 293 0,313% 2 0,651% 214 0,336% Horta 1 0,326% 157 0,167% 1 0,326% 123 0,193% Ponta Delgada 4 1,303% 604 0,644% 4 1,303% 435 0,683% Funchal 7 2,280% 2 176 2,321% 7 2,280% 1 374 2,156% Total 307 100% 93 759 100% 307 100% 63 733 100%
Table X. Distribution of firms by sector
Sector
1st activity year 4th activity year
Gazelles Non-Gazelles Gazelles Non-Gazelles Obs. Percentage Obs. Percentage Obs. Percentage Obs. Percentage
Extractive industries 1 0,326% 103 0,110% 1 0,326% 82 0,129%
Transformative industries 62 20,195% 8 392 8,951% 62 20,195% 5 949 9,334%
Electricity, gas, steam, hot and cold water and cold air 0 0,000% 84 0,090% 0 0,000% 63 0,099% Collection, treatment and water distribution,
sanitation, waste management and depollution 0 0,000% 277 0,295% 0 0,000% 208 0,326%
Construction 63 20,521% 13 188 14,066% 63 20,521% 8 437 13,238%
Wholesale and retail trade; automobile and
motorcycle repair 51 16,612% 25 827 27,546% 51 16,612% 17 479 27,425%
Transportation and storage 16 5,212% 2 887 3,079% 16 5,212% 2 073 3,253%
Accommodation, catering and similar 16 5,212% 9 398 10,024% 16 5,212% 5 618 8,815%
Information and communication activities 15 4,886% 3 343 3,566% 15 4,886% 2 339 3,670%
Real estate activities 3 0,977% 3 571 3,809% 3 0,977% 2 587 4,059%
Consulting, scientific, technical and similar activities 31 10,098% 10 757 11,473% 31 10,098% 7 928 12,439% Administrative activities and support services 36 11,726% 4 615 4,922% 36 11,726% 2 955 4,637%
Education 3 0,977% 1 452 1,549% 3 0,977% 968 1,519%
Health and social services 4 1,303% 4 781 5,099% 4 1,303% 3 882 6,091%
Artistic and sports activities 1 0,326% 1 602 1,709% 1 0,326% 1 090 1,710%
Other services 5 1,629% 3 482 3,714% 5 1,629% 2 075 3,256%
Table XI. Average values observed in y1
Variable All Firms Gazelles Non-Gazelles Obs. Mean Obs. Mean Obs. Mean Total Debt 94 066 103 626,600 307 289 701,900 93 759 103 017,500 Total Equity 94 066 24 675,800 307 60 639,310 93 759 24 557,070 Total Capital 94 066 128 302,600 307 350 638,200 93 759 127 574,600 Total Assets 94 066 128 302,600 307 350 638,200 93 759 127 574,600 Net Profit 94 066 -4 214,931 307 -9 119,001 93 759 -4 198,873 Sales 94 066 102 495,30 307 147 542,200 93 759 102 347,800 Suppliers 94 066 26 743,450 307 36 316,280 93 759 26 712,110 Fixed Assets 94 066 50 344,320 307 203 327,800 93 759 49 843,390 Net Equity 94 066 28 890,730 307 70 055,310 93 759 28 755,950
Table XII. Average values observed in y5
Variable All Firms Gazelles Non-Gazelles Obs. Mean Obs. Mean Obs. Mean Total Debt 64 040 2 591 779,900 307 1 317 912,000 63 733 254 080,000 Total Equity 64 040 61 453,990 307 306 813,700 63 733 60 272,100 Total Capital 64 040 320 633,900 307 1 624 725,000 63 733 31 452,100 Total Assets 64 040 320 633,900 307 1 624 725,000 63 733 31 452,100 Net Profit 64 040 191,577 307 -8 068,692 63 733 2 231,367 Sales 64 040 306 136,200 307 2 043 444,000 63 733 297 767,600 Suppliers 64 040 56 105,400 307 255 315,300 63 733 55 145,810 Fixed Assets 64 040 206 877,600 307 805 774,900 63 733 103 511,000 Net Equity 64 040 61 262,410 307 314 882,400 63 733 60 040,730
Table XIII. Mean and standard deviation analysis y1
Variable All Firms Gazelles Non-Gazelles
Obs. Mean S.D. Obs. Mean S.D. Obs. Mean S.D.
FixedA 94 066 0,317 0,347 307 0,296 0,291 93 759 0,316 0,347 size 94 066 0,634 0,758 307 0,846 0,723 93 759 0,634 0,759 Tcredit 94 066 6,068 4,254 307 7,034 4,181 93 759 6,065 4,250 profitability 94 066 -2,649 0,209 307 -0,001 0,004 93 759 -0,003 0,210 sales 94 066 10,384 1,594 307 11,054 1,455 93 759 10,382 1,590 TotCap 94 066 8,789 1,332 307 9,559 1,461 93 759 8,786 1,330 DC 94 066 0,706 0,706 307 0,686 0,297 93 759 0,706 0,275
Table XIV. Mean and standard deviation analysis y5
Variable All Firms Gazelles Non-Gazelles Obs. Mean S.D. Obs. Mean S.D. Obs. Mean S.D.
FixedA 64 040 0,236 0,281 307 0,278 0,252 63 733 0,236 0,282 size 64 040 0,976 0,921 307 3,111 0,695 63 733 0,964 0,908 Tcredit 64 040 7,041 4,354 307 10,387 3,506 63 733 7,025 4,352 profitability 64 040 (0,012) 2,580 307 (0,000) 0,000 63 733 (0,012) 2,587 sales 64 040 11,410 2,584 307 13,695 1,155 63 733 11,402 1,577 DC 64 040 4,207 228,402 307 0,852 0,383 63 733 4,220 228,952
Table XV. Gazelle’s Main Characteristics (Equation 1) gazelle Size -0,013 (0,029) FixedA 0,046 (0,060) Tcredit 0,012* (0,006) Profitability -0,025 (0,614) Sales 0,912** (0,018) N 94 066
Standard errors in parentheses *p<0,1, **p<0,05, ***p<0,01
Table XVI. Start-up’s Initial Capital (Equation 2) TotCap Gazelle 0,481*** (0,075) Size 0,238*** (0,006) FixedA 0,227*** (0,013) Profitability -0,134*** (0,020) Sales 0,131*** (0,003) N 94 066
Standard errors in parentheses *p<0,1, **p<0,05, ***p<0,01
Table XVII. Start-ups Capital Structure (Equation 3) for First and Fifth Year of Activity (1) DC_y1 (2) DC_y5 gazelle -0,032** -0,044 (0,013) (0,538) size_yt 0,011*** 0,112* (0,001) (0,063) FixedA_yt 0,129*** 0,027 (0,002) (0,158) Tcredit_yt 0,018*** 0,0486*** (0,000) (0,003) Probability_yt -0,001 2,391 (0,004) (3,191) sales_yt 0,034*** -0,226*** (0,001) (0,040) N 94 066 64 040
Standard errors in parentheses *p<0,1, **p<0,05, ***p<0,01
Note: yt in the variables denote the year in analysis. For 1st column is the first year of activity, while in the second is the fourth year.
Table XVIII. Tobit equation 3 estimation for crisis effect evaluation in the first and fifth activity years
(1) DC_y1 (2) DC_y5 gazelle -0,032** -0,044 (0,013) (0,54) crisis 0,032*** 0,078 (0,003) (0,14) size_yt 0,011*** 0,112* (0,001) (0,06) FixedA_yt 0,129*** 0,027 (0,002) (0,16) Tcredit_yt 0,018*** 0,049*** (0,000) (0,00) Probability_yt -0,001 2,391 (0,004) (3,191) sales_yt 0,0342*** -0,226*** (0,001) (0,04) N 94 066 64 040
Standard errors in parentheses *p<0,1, **p<0,05, ***p<0,01
Note: yt in the variables denote the year in analysis. For 1st column is the first year of activity (y1), while in the second is the fifth year (y5).