2019
UNIVERSIDADE DE LISBOA
FACULDADE DE CIÊNCIAS
DEPARTAMENTO DE BIOLOGIA VEGETAL
Brewery and olive oil industries: wastes valorisation by
anaerobic digestion
André Filipe Martins das Neves
Mestrado em Microbiologia Aplicada
Dissertação orientada por:
Doutora Ana Eusébio
Professora Margarida Barata
This Dissertation was fully performed at LNEG – National Laboratory
of Energy and Geology under the direct co-supervision of Doctor Ana
Eusébio and Doctor Isabel Paula Marques
Professor Margarida Barata was the internal supervisor designated in the scope of the
Master in Applied Microbiology of the Faculty of Sciences of the University of Lisbon
IV
Acknowledgments/agradecimentos
À Doutora Ana Eusébio por me ter dado a oportunidade de trabalhar neste projeto e também pelos conselhos que me deu ao longo destes anos, tanto na organização do trabalho como nos procedimentos. Agradeço também pelo tempo despendido e paciência que teve para comigo para me ajudar no laboratório nas situações mais complicadas, e também durante a escrita da tese.
À Doutora Isabel Paula Marques também pela oportunidade que me deu para participar no projeto, mas também pelo tempo, e paciência, que despendeu para me dar todo o apoio, conselhos e ajudas quando eu mais precisava durante o trabalho no laboratório, em termos de organização, de procedimentos e de explicar o funcionamento dos métodos e dos reatores usados, e também durante a escrita da tese.
À Natércia Santos e Graça Gomes pela assistência laboratorial e por me terem ensinado os métodos laboratoriais necessários para este trabalho. Agradeço também pelo tempo e paciência que tiveram para comigo nos primeiros meses no laboratório devido à minha falta de habilidade que tinha na altura.
À Doutora Luísa Roseiro e Doutor Luís Ramalho pelo apoio e ajuda que prestaram na avaliação dos compostos fenólicos e caracterização cromatográfica, e por me terem explicado as metodologias usadas.
Ao Doutor Francisco Gírio, coordenador da Unidade de Bioenergia por ter autorizado o estágio, e por me ter dado a oportunidade de trabalhar neste projeto.
À Professora Margarida Barata pelo apoio e orientação prestados durante este trabalho, e pelo ensino que me deu durante este mestrado que frequentei.
Ao Laboratório Nacional de Energia e Geologia (LNEG) pelas instalações e por ter fornecido o material necessário para o trabalho.
À Sociedade Central Cervejas e Bebidas (SCC), à Valorgado, à Companhia do azeite de Rio Maior e à SIMARSUL por terem fornecido os efluentes.
À minha família, especialmente aos meus pais e irmão, pelo todo o apoio que me deram ao longo deste trabalho, pela paciência que tiveram para comigo e por estarem sempre presentes para que eu me sentisse em casa no final de um dia de trabalho.
Aos colegas que conheci e aos amigos que fiz enquanto estive neste trabalho, à Alice, Carolina, Marta, Mariana, João, Joana, e outros tantos, pelas dicas e ajudas que me deram e pelos momentos de descontração e de convívio.
Este trabalho foi financiado através de fundos nacionais por meio da FCT – Fundação para a Ciência e a Tecnologia, I.P. no projeto ERANETLAC/0001/2014, GREENBIOREFINERY - Processing of brewery wastes with microalgae for producing valuable compounds.
V
RESUMO
A produção do azeite é uma indústria importante em Portugal, bem como em toda a região Mediterrânica. É feito a partir do fruto da azeitona (Olea europaea), esmagando-a e extraindo o óleo da pasta resultante através de prensagem ou centrifugação. A cerveja é uma bebida consumida mundialmente e com grande impacto económico, em Portugal inclusivamente. Na sua produção são utilizados malte e lúpulo que são fervidos em caldeiras de cobre e depois são fermentados pelas leveduras até obter o produto final. A produção suinícola é outra área comercial importante, com instalações estabelecidas no território nacional. Todas estas produções geram grandes volumes de águas residuais e, devido à sua elevada carga orgânica e toxicidade, levantam preocupações ambientais, quer das zonas aquáticas (lagos e rios, por exemplo) quer a nível do ar e solo. A fim de minimizar a potencial capacidade poluidora destes efluentes, é necessário providenciar a devida gestão tendo em conta, sempre que possível, a respetiva valorização. Este trabalho visa a valorização e tratamento de efluentes/resíduos orgânicos através da sua degradação em condições anaeróbias, como método de tratamento biológico de efluentes que utiliza microrganismos com a capacidade de degradar a matéria orgânica e compostos tóxicos na ausência de oxigénio. O processo de digestão anaeróbia foi aplicado a efluentes industriais – água ruça (OMW) e águas residuais da indústria cervejeira (BWW), obtidos da produção de azeite e de cerveja, respetivamente - por meio do conceito de complementaridade de efluentes, para melhorar o tratamento dos substratos e a produção de biogás/metano. A digestão da água ruça (“OMW”) em mistura com um substrato concentrado (efluente suinícola, “PE”: primeiro ensaio) foi realizada em condições mesófilas de temperatura (37°C ± 1ºC) e em condições de alimentação em descontínuo, utilizando diferentes proporções volumétricas de efluentes: 100%PE, 30%OMW+70%PE, 50%OMW+50%PE, 80%OMW+20%PE. As unidades com uma proporção baixa de OMW (30%OMW) e apenas com PE (100%PE) forneceram a maior quantidade de biogás (780 mL, 70% CH4), enquanto que as unidades contendo 80% OMW geraram os menores volumes (120 mL, 6% CH4), possivelmente devido à influência negativa da OMW, em elevadas quantidades, sobre as populações microbianas. Nas misturas com idênticas proporções de efluentes (50%OMW+50%PE), foi observada uma fase inicial de latência sem a produção de gás, de cerca de 25 dias, interpretada como um período de inibição do processo em que a população microbiana se foi adaptando ao longo do tempo e veio a proporcionar a evolução da produção do gás até ao volume de 327 mL (60% CH4). Em concordância com as produções em gás, as unidades 100%PE e 30%OMW+70%PE apresentaram uma maior capacidade de remover/converter a matéria orgânica, tendo-se registado valores de 63% e 75% na Carência Química de Oxigénio (CQO), respetivamente. Nas restantes unidades, as remoções em CQO foram de 48% (50%OMW+50%PE) e 29% (80%OMW+20%PE). Quanto à atividade antioxidante (Capacidade Antioxidante Equivalente em Trolox, TEAC), verificou-se que o decréscimo originado pelo processo de digestão anaeróbia é também mais acentuado nas primeiras duas situações do que nas restantes. Alterações de 1,11 para 0,64 mmol TEAC (100%PE) e de 1,07 para 0,39 mmol TEAC (30%OMW+70%PE) foram registadas. Os resultados obtidos indicam que o efluente da indústria do azeite tem um efeito negativo sobre os microrganismos, inibindo o bom desenvolvimento do processo anaeróbio de tratamento dos efluentes, quando presente em volumes da ordem dos 50%. No entanto, verificou-se que o efluente da indústria do azeite em misturas com proporções inferiores (30%), tem efeitos benéficos e que, comparado com as unidades com apenas o efluente suinícola, revela maior capacidade de remoção da matéria orgânica, apesar de apresentar idênticas produções em biogás e metano. Na segunda experiência, o OMW foi digerido com um substrato diluído (efluente de cervejaria, “BWW”), a 37°C ± 1ºC e em condições de alimentação em descontínuo, utilizando inóculo (I) a 30% v/v. Todas as unidades testadas das diferentes misturas - 70%BWW+I, 50%BWW+20%OMW+I, 30%BWW+40%OMW+I, 10%BWW+60%OMW+I, I+H2O -
VI geraram baixos volumes de biogás. A produção mais elevada foi 66 mL, obtida nas unidades sem OMW (70%BWW+I). É de referir que, à semelhança da experiência anterior, na mistura com a menor proporção de OMW (50%BWW+20%OMW+I) foi identificada uma fase de inibição do processo, de cerca de 20 dias, durante a qual a população microbiana teve possibilidade de se adaptar às condições operacionais e de gerar uma produção média de biogás de 42 mL, decorridos 34 dias de ensaio. O incremento da proporção de OMW nas misturas testadas ocasionou um aumento na concentração de diversos parâmetros nos substratos a digerir (e.g. CQO, AGV, sólidos, azoto), os quais, após digestão anaeróbia, não foram sujeitos a grandes alterações, constatando-se haver uma diminuta/nula capacidade de remoção por parte do processo. O aumento da concentração em CQO e AGV, bem como o decréscimo do pH para valores na gama ácida (pH 4,8, 10%BWW+60%OMW+I), observada nas misturas com OMW, está de acordo com as baixas produções em biogás obtidas e que confirmam a ação inibidora por parte da OMW. Um aspeto relevante desta experiência diz respeito ao aparecimento de depósitos de cor avermelhada no meio de cultura. A análise microscópica mostra a existência de aglomerados da mesma cor que são identificados por espectrofotometria como corresponderem aos pigmentos bacterioclorofila a e carotenoides, típicos de bactérias púrpura não sulfúricas. Posteriormente, por análise molecular, verificou-se a presença de populações do género das Rhodobacter. Os resultados obtidos nesta segunda experiência, em que o OMW foi digerido com um substrato diluído (BWW), confirmam a existência de um efeito negativo por parte do OMW sobre a atividade da população microbiana, indicando que não há vantagem em usar as águas residuais de cervejaria em mistura com OMW. O reator anaeróbio híbrido foi alimentado com BWW em mistura com PE (60:40% v/v, respetivamente), tendo funcionado sob regime semi-contínuo de alimentação e com três diferentes tempos de retenção hidráulica (TRH). Operando com 5,7 dias de TRH (carga orgânica de 5,2 kg m-3 d-1), a produção de biogás evoluiu de 0,4 para 1,2 L L-1 d-1, com um teor em metano de 63-78%. Com a diminuição do tempo de residência para 3 dias, e o consequente aumento da carga orgânica para 10,0 kg m-3 d-1, houve uma melhoria na produção de biogás e na sua qualidade (2,3 L L-1 d-1, 79,5% de teor em metano). Sujeitando o reator anaeróbio híbrido a TRH de 1 dia, correspondente à máxima carga orgânica ensaiada (33,6 kg m-3 d-1), obteve-se um novo aumento na produção de biogás, tendo-se alcançando volumes próximos de 3 L L-1 d-1 e mantido a quantidade de metano na mesma gama de valores (79,5%). No que respeita à capacidade de remoção do processo levado a cabo no híbrido anaeróbio, obtiveram-se remoções de 52% em CQO dos substratos digeridos na primeira fase da experiência (TRH=5,7d). Contudo, este comportamento não se veio a verificar nas fases seguintes devido, possivelmente, à saída de partículas/flocos do interior do híbrido em conjunto com o substrato digerido, em resultado do aumento do fluxo do alimento. O bom funcionamento do hibrido, ao longo das três condições operacionais estudadas, é suportado pela produção em biogás e metano e pela capacidade em remover/converter os AGV contidos no alimento (64 e 87-95%). A análise ao perfil do híbrido anaeróbio permitiu verificar que existe uma diminuição acentuada de AGV no troço inferior da coluna, sugerindo que estes compostos são maioritariamente degradados nesta seção da unidade. Quanto aos outros parâmetros (CQO, ST e SV), observa-se um aumento das respetivas concentrações também neste troço e que é interpretado como corresponder à existência de um manto de lamas na base da coluna. Nas restantes tomas até ao topo do híbrido, onde é recolhido o substrato tratado, verifica-se um decréscimo gradual da concentração da matéria orgânica, indicando que a degradação do substrato continua nas zonas superiores do reator. Os resultados obtidos durante a operação do híbrido anaeróbio permitem confirmar que a digestão combinada das águas residuais da produção de cerveja e da suinicultura foi realizada com sucesso mesmo quando o reator anaeróbio híbrido funcionou um tempo de residência tão baixo quanto o de 1 dia. A estrutura da comunidade microbiana foi caracterizada por Next Generation Sequencing (NGS) do gene 16S rRNA nos substratos, no inóculo e nas amostras com melhor produção de biogás/metano. Relativamente ao domínio Bacteria, Proteobacteria (54,6%) e Chloroflexi (18,4%) foram os filos dominantes detetados no inóculo. Durante os ensaios de digestão anaeróbia, as populações microbianas Pseudomonadales e
VII Anaerolineales, pertencentes àqueles filos, mantiveram-se predominantes em todas as amostras que foram inoculadas. Bacteroidetes (53,2%) foi o filo dominante encontrado na BWW, e Firmicutes (65,1%) em PE, mantendo-se predominantes as populações Clostridiales em todos os ensaios complementados com PE. Relativamente ao domínio Archaea, as populações dominantes pertencem aos géneros Methanosaeta (99,7%) e Methanobrevibacter (72,1%), detetadas nas amostras de inóculo e PE, respetivamente. O BWW não revelou populações de árqueas presentes nas amostras. No final do processo da digestão anaeróbia de amostra de OMW complementada com PE, detetou-se a predominância de Methanosarcina em todas as amostras. No segundo e terceiro ensaios, Methanosaeta apresentou a maior abundância relativa. A predominância de Methanosarcina e Methanosaeta é consistente com a maior produção obtida de biogás nas amostras caracterizadas.
Palavras-chave: digestão anaeróbia, biogás/metano, efluentes agropecuários e industriais, populações de bactérias e árqueas
VIII
ABSTRACT
Anaerobic digestion process was applied to the industrial effluents valorisation – olive mill wastewater (OMW) and brewery wastewater (BWW), obtained from olive oil and beer productions - by means of the effluent complementarity concept, to improve the substrates treatment and the biogas/methane production. The digestion of OMW in admixture with a concentrated substrate (piggery effluent, PE: first essay) was carried out at mesophilic conditions of temperature (37 ºC ± 1ºC) and batch conditions, using different volumetric proportions of effluents: 100%PE, 30%OMW+70%PE, 50%OMW+50%PE, 80%OMW+20%PE. The units with low proportion of OMW (30% OMW) and PE alone (100% PE) provided the highest amount of biogas (780 mL, 70% CH4), while units containing 80% of OMW generated the lowest volumes (120 mL, 6% CH4), possibly due to the OMW negative influence on microbial populations when present in large amounts. In the second experiment, OMW was digested with a diluted substrate (brewery wastewater, BWW), at 37 ºC ± 1ºC, under batch conditions, using inoculum (I) at 30% v/v. All tested units - 70%BWW+I, 50%BWW+20%OMW+I, 30%BWW+40%OMW+I, 10%BWW+60%OMW+I, I+H2O - generated low volumes of biogas (less than 70 mL), confirming the negative effect of OMW on the microorganisms activity and indicating there is no advantage in using brewery wastewater in admixture with OMW. Hybrid anaerobic reactor was feed with brewery wastewater and piggery effluent mixture (60:40% v/v, respectively), under semi-continuous mode and three different hydraulic retention times (HRT). Operating at HRT of 5.7 days (loading rate of 5.2 kg m-3 d-1), the biogas production evolved from 0.4 to 1.2 L L-1 d-1, with a methane content of 63-78%. By decrease HRT to 3 days (loading rate of 10.0 kg m-3 d-1), biogas production was improved and its quality as well. Biogas values of 2.3 L L-1 d-1 and methane of 79.45% were recorded. When the hybrid reactor operated with an even lower HRT (1 day), and the highest organic loading rate tested (33.6 kg m-3 d-1), biogas production was enhanced reaching volumes close to 3 L L-1 d-1 while the methane amount was maintaining in the previous range (79.5%). The combined digestion of brewery wastewater and piggery effluent, using the hybrid anaerobic reactor, was successfully performed, even when it was working with an HRT as low as 1 day. The microbial community composition was characterized by Next Generation Sequencing of 16S rRNA gene. Proteobacteria (54.6%) and Chloroflexi (18.4%) were the dominant phyla present in the inoculum. These bacterial populations maintained their predominance in all inoculated samples during anaerobic digestion. Bacteroidetes (53.2%) was the dominant phylum found in BWW, and Firmicutes (65.1%) was the dominant phylum found in PE, maintaining its predominance in all essays complemented with PE during anaerobic digestion. Archaeal populations were only detected in inoculum and PE samples, mainly assigned to Methanosaeta (99.7%) and Methanobrevibacter genera (72.1%), respectively. At the end of anaerobic digestion of OMW complemented with PE, the genus Methanosarcina was dominant in all samples. In the second and third essays, Methanosaeta represented most of Archaea domain.
Keywords: anaerobic digestion, biogas/methane, brewery and olive mill wastewaters, piggery effluent, populations of bacteria and archaea
IX INDEX Acknowledgements/agradecimentos………..…IV Resumo………...………..…...V Abstract………..………..VIII Index………..………...IX Table index………XII Figure index………...XIV 1. Introduction………...1
1.1. Olive oil industry……….……….1
1.1.1. Olive oil: production and wastes……….………...1
1.1.2. Olive oil wastewater: characteristics………..………...2
1.2. Brewery industry……….………...2
1.2.1. Brewery: production and wastewater………..………2
1.2.2. Brewery wastewater: characteristics………..……...2
1.3. Pig industry………...3
1.3.1. Pig industry and piggery effluent………...……….3
1.3.2. Piggery effluent: characteristics………...3
1.4. Effluent treatment………3
1.4.1. Physio-chemical treatments………3
1.4.2. Biological treatment………..………….4
1.5. Scope and objectives of the study………..………….5
2. Material and methods………...6
2.1. Substrates and inoculum sampling ..………...6
2.2. Anaerobic digestion experimental set-up……….………...6
X
2.3.1. pH……….………...7
2.3.2. Total and volatile solids………...8
2.3.3. Chemical oxygen demand………..……….8
2.3.4. Total phenolic content and electrophoretic profile…….……..………...8
2.3.5. Total nitrogen (kjeldahl)……….9
2.3.6. Ammonia nitrogen………...9
2.3.7. Volatile fatty acids………...9
2.3.8. Biogas composition………....9 2.3.9. Antioxidant activity………...10 2.3.10. Microscopy ………..………...10 2.3.11. Analysis of pigments………...10 2.4. Molecular analysis……….10 2.4.1. DNA extraction………...10
2.4.2. Next generation sequencing……….……….11
3. Results and discussion……….………...12
3.1. Effluents……….12
3.2. First essay: anaerobic digestion with piggery effluent and olive mill wastewater…………...13
3.2.1. Biogas production……….13
3.2.2. Treatment capacity………....15
3.3. Second essay: anaerobic digestion with brewery wastewater and olive mill wastewater………..17
3.3.1. Biogas production……….17
3.3.2. Treatment capacity………19
3.3.3. Microscopy and pigment analysis……….…22
3.4. Third essay: anaerobic digestion with brewery wastewater and swine wastewater……...23
3.4.1. Biogas production……….23
XI
3.4.3. Reactor profile………...26
3.5. Molecular analysis……….27
3.5.1. DNA extraction……….27
3.5.2. Next-generation sequencing……….………28
3.5.2.1. Effluents and inoculum……….………...28
3.5.2.2. First essay………30 3.5.2.3. Second essay………....32 3.5.2.4. Third essay……….…..34 4. Conclusions……….………...………...….36 References....………...37 Appendices………...……..42 Submitted works………...………...….42
Phenolic content: electropherograms………....43
XII TABLE INDEX
Table 1.1.: Anaerobic digestion in batch conditions………..6
Table 1.2.: Anaerobic digestion in semi-continuous conditions……….…...6
Table 3.1.: Characteristics of the effluents and inoculum………....12
Table 3.2.: Antioxidant activity and total phenolic (TP) content…..………...12
Table 3.3.: Volatile fatty acids and pH……….13
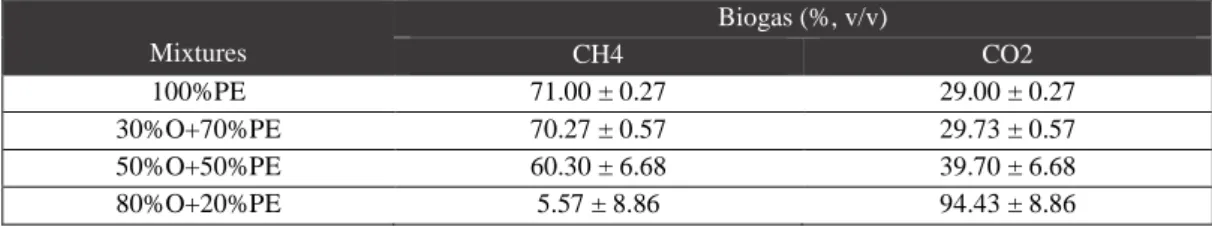
Table 3.4.: Biogas composition of the first experiment………...15
Table 3.5.: Chemical oxygen demand (COD) of the first experiment………..15
Table 3.6.: Total and volatile solids of the first experiment………...15
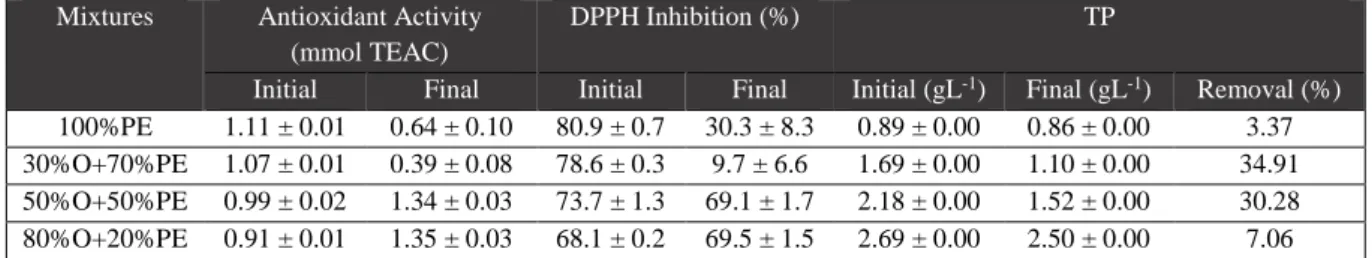
Table 3.7.: Antioxidant activity and total phenolic content (TP) of the first experiment…..………16
Table 3.8.: Total and ammonium nitrogen of the first experiment………..16
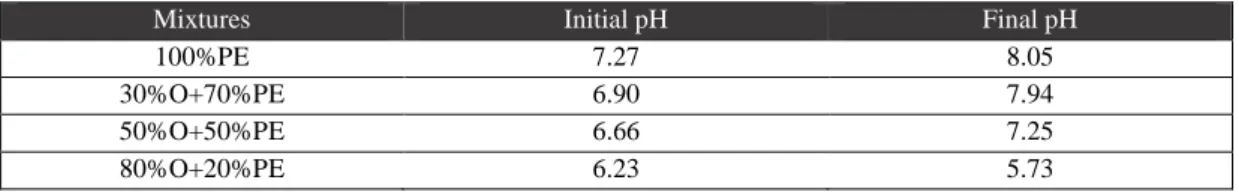
Table 3.9.: pH values of the first experiment………..17
Table 3.10.: Volatile fatty acids of the first experiment...………...17
Table 3.11.: Biogas composition of the second experiment………..….19
Table 3.12.: Chemical oxygen demand (COD) of the second experiment………...19
Table 3.13.: Total and volatile solids of the second experiment………...…..20
Table 3.14.: Antioxidant activity and total phenolic content (TP) of the second experiment…………...20
Table 3.15.: Total and ammonia nitrogen of the second experiment...………...21
Table 3.16.: pH values of the second experiment………...…...…21
Table 3.17.: Volatile fatty acids of the second experiment………....22
Table 3.18.: Biogas composition of the third experiment………...23
Table 3.19.: Chemical oxygen demand (COD) of the third experiment………24
Table 3.20.: Total and volatile solids of the third experiment………...24
Table 3.21.: Antioxidant activity and total phenolic content (TP) of the third experiment………..….25
Table 3.22.: Total and ammonia nitrogen of the third experiment………..………...25
XIII
Table 3.24.: Volatile fatty acids of the third experiment………....25
Table 3.25.: Volatile fatty acids and pH of reactor’s profiles…………...………..27
Table 3.26.: Effect of the change in conditions of DNA extraction……….27
XIV FIGURE INDEX
Figure 1.1.: Anaerobic digestion flowchart………..………….5
Figure 2.1.: Hybrid reactor schematic used for third experiment……….………….7
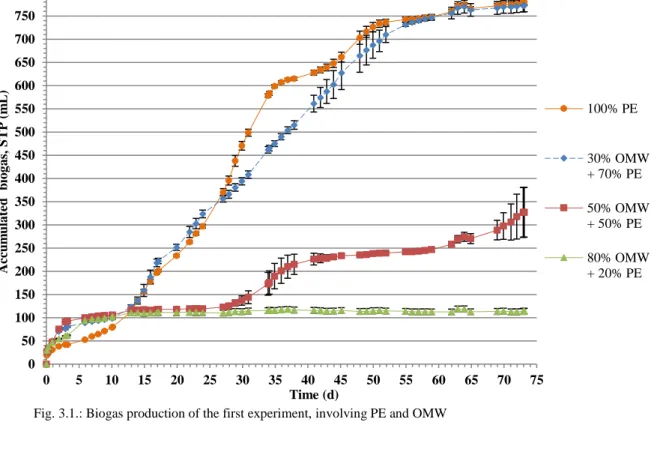
Figure 3.1.: Biogas production of the first experiment……….………..14
Figure 3.1.a.: Biogas production of 50% OMW + 50% PE units………14
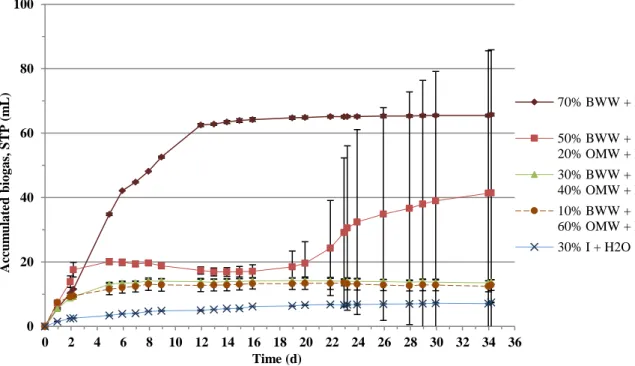
Figure 3.2.: Biogas production of mixtures from the second experiment………...…………..18
Figure 3.2.a.: Biogas production of 50% BWW + OMW 20% + I units….………..…………..18
Figure 3.3.a.: Liquid sample of culture medium analysed under light microscopy…..………...22
Figure 3.3.b.: Absorption spectrum of the whole cells sample………..…………...22
Figure 3.4.: Biogas production and percentage of methane from third experiment………...……23
Figure 3.5.: Characteristics of reactor’s profiles……….26
Figure 3.6.: Relative abundance of Bacteria and Archaea domains from the effluents and inoculum…..29
Figure 3.7.: Relative abundance of Bacteria and Archaea domains from the first experiment...31
Figure 3.8.: Relative abundance of Bacteria and Archaea domains from the second experiment…….33
Figure 3.9.: Relative abundance of Rhodobacter populations………....34
1
1. INTRODUCTION 1.1. Olive oil industry
1.1.1. Olive oil: production and wastes
Olive oil is produced from the olive fruit (Olea europaea) when it’s crushed and the resulting oil is extracted from the aqueous part (Kapellakis et al., 2008). Since the Ancient civilizations this product has multiple uses, as food, fuel source or for cosmetics (Kapellakis et al., 2008). Both the tree and the fruit still have a religious symbolism in our day. Throughout the time, the extractions techniques remained quite identical, though in the present days they have evolved to a more industrial level (Kapellakis et al., 2008). In Portugal it is one of most important food industries, with 66532 tons of virgin oil produced in 2014 (FAOSTAT, 2019).
There are three olive oil’s production techniques, having some processing steps similar to each other. Firstly, the olive is separated from the leaves and other residues and washed. Then follows the crushing to form a paste, to which water is added. The paste is then mixed in a process called malaxing, with the purpose of agglutinate the oil droplets to ease the aqueous phase’s extraction (Kapellakis et al., 2008). From this point the extraction techniques become different; the pressing technique, the most ancient, uses several stacked discs, made of synthetic fibers, and a press to crush the pulp, letting the liquid phase pass through and separating it from other phases (Dermeche et al., 2013). In the end, the liquid phase is decanted to separate the oil from the aqueous phase (Olive Mill Wastewater - OMW). The remaining two techniques apply centrifugation to separate the olive oil from the aqueous phase (El Mekawy et al., 2014). The three-phase technique uses two centrifugations, obtaining an olive oil with good quality. It generates two wastes (or byproducts): the olive pomace, a solid residue, from first centrifugation, and olive oil wastewater, from second centrifugation (Dermeche et al., 2013). The two-phase method only uses one centrifugation and the resulting wasted flow is a dense olive wastewater. Despite being used by the majority of the largest olive oil producers’ countries, the three-phase system is identified with consumption of large volumes of water and, consequently, large amounts of wastewaters to be treated (Dermeche et al., 2013 and El Mekawy et al., 2014). These are the reasons why two-phase system is being accepted, because of its low environment impact and low water consumption (Chowdury et al., 2013 and Dermeche et al., 2013).
However, there is no effective solution to get rid of these wastes mainly due to the high organic content and toxicity which make their disposal hazardous by conventional means. Several tries to give use to these byproducts such as in agriculture by spreading on olive groves, or in energy production (by incineration), but the results of the experiments are inconclusive or negative and doesn’t let use them more frequently. The high content in organic compounds means this wastewater can’t be discharged untreated to water courses because it’ll cause hypoxia, asphyxiating fish populations, and leading to eutrophication, intensified if the waters are rich in phosphorus (Dermeche et al., 2013; Kapellakis et al., 2008 and McNamara et al., 2008). The existence of phenolic compounds in big concentrations restricts the OMW use as a fertilizer because of their phytotoxicity, i.e. inhibits plant growth, affecting the arbuscular system and stopping seed germination (Amaral et al., 2008 and McNamara et al., 2008). The effluent is also toxic to microorganisms, even being capable of stopping anaerobic treatments in municipal treatment plants (Amaral et al., 2008; Beccari et al., 1996; Heredia and Garcia, 2005 and Paraskeva and Diamadopoulos, 2006). The dark colour, synthetized by oxidation and polymerization of tannins, creates visual pollution in waters (Kapellakis et al., 2008; McNamara et al., 2008 and Rahmanian et al., 2014). Also, the lipids present in OMW create a film on water surface blocking solar light and oxygen from entering the water, and the oils can make the soils less capable of retain water
2 (Dermeche et al., 2013 and Kapellakis et al., 2008). And, according to El Hajjouji et al., 2007, OMW is also genotoxic due to gallic acid and oleuropein presence, with lasting effects even under large dilutions (up to 10% v/v). Because of its dangers and the seasonality of oil production, the wastewater rather ends up in big open tanks, generating foul odours by fermentation of wastes and gas production, like methane and hydrogen sulphite, affecting neighbouring populations (Heredia and Garcia, 2005; Kapellakis et al., 2008 and Paraskeva and Diamadopoulos, 2006).
1.1.2. Olive oil wastewater: characteristics
OMW has a reddish to black colour, given by recalcitrant compounds (lignin and other polyphenols), and cellulosic compounds (Dermeche et al., 2013 and Paraskeva and Diamadopoulos, 2006). It contains water (80-95%), and is rich in organic matter, mostly sugars (fructose, mannose, glucose, saccharose, sucrose, among others), long chain and volatile fatty acids, and phenolic compounds (as mentioned earlier, they are phytotoxic) (McNamara et al., 2008 and Rahmanian et al., 2014). OMW has a high COD content, usually up to 200 g L-1, an acidic pH (between 4 and 6) and a high solid matter (up to 20 g L-1) (El Mekawy et al., 2014; Eroglu et al., 2006; Paraskeva and Diamadopoulos, 2006 and Tsagaraki et al., 2007). Additionally, it contains minerals (potassium, sodium and calcium), fermentable proteins, resinous and serous substances, vitamins and small amounts of olive oil (Dermeche et al., 2013; Kapellakis et al., 2008 and Tsagaraki et al., 2007). Also OMW comprises microbial inhibitors (e.g. catechol, 4-methyl-catechol and hydroxytyrosol; Tsagaraki et al., 2007). The composition of this wastewater changes a lot depending mainly on the type and the maturation of olive fruit, the way of processing and handling, and the region of the olives origins. The phenolic compounds present on OMW belong to the following groups: cinnamic acid derivatives, benzoic and tyrosol compounds (Borja et al., 1996). All of them have in common a hydroxyl group, an aromatic ring and a functional chain. They are found in olive fruit under glucoside, tannins, anthocyanins and lignin forms. Their role is protecting the fruit from oxidation, microorganisms and UV light, while also give a lighter colour (Dermeche et al., 2013; El Mekawy et al., 2014; Kapellakis et al., 2008 and Morillo et al., 2009). These characteristics described here mean that this effluent must be treated before being disposed safely.
1.2. Brewery industry
1.2.1. Brewery: production and wastewater
Beer is one of the most ancient and consumed beverages worldwide, being one of the most valuable in food industry, including Portugal, where 729000 tons of beer were produced in 2014 (FAOSTAT, 2019). Its production usually evolves malt, hops, yeasts of Saccharomyces genus, and some sugars or starch to add some flavour to the beer (Brito et al., 2007). The production begins when malted barley grains are mixed with water and crushed; the resulting sugars are retrieved along with water. This mixture is then boiled in copper kettles and hop is added for the liquid to get the characteristic bitterness. Finally, the mixture is fermented by yeasts and stored in barrels or in bottles.
The production of this beverage always evolves big volumes of water, and adding the water spent on washing bottles, tanks and machines (3 – 10 L for every litre of beer), the result is high volumes of wastewater discharged annually, which create pollution concerns such as eutrophication of water bodies and oxygen depletion (Simate et al., 2011).
1.2.2. Brewery wastewater: characteristics
Brewery effluent contains a great amount of organic compounds: volatile fatty acids, sugars, starches, ethanol, among others. The solid compounds consist of spent grains, waste yeast and hot trub (Brito et al., 2007 and Simate et al., 2011). The COD of the wastewater is typically 2 – 6 g L-1, depending of its
3 origins (Brito et al., 2007). The effluent’s pH can have big variations, between pH 2 – 12, depending on chemicals used for cleaning (acids, caustic soda and chlorine, for example) and disinfection of microorganisms, except yeasts (Brito et al., 2007 and Simate et al., 2011). The effluent’s temperature also varies between 18ºC and 38ºC (Brito et al., 2007). Moreover, nitrogen and phosphorus’ levels on the effluent are dependent of the quantity of spent yeast used and the way it was handled. In general, the brewery wastewater’s composition varies largely in many parameters (Simate et al., 2011).
Brewery effluent’s composition makes this flow dangerous to be discharged without any management step. To avoid and/or reduce the problem it is necessary to provide wastewater treatment.
1.3. Pig industry
1.3.1. Pig industry and piggery effluent
Pig industry is one of leading animal and food economies worldwide as well in Portugal, where about 2615000 heads in 2017 (FAOSTAT, 2019) accounted for 1.2% of European production. With this large and intensive production, it’s clear that big amounts of manure will be produced and mostly will go to the sewage. Another form of disposing, used by the farmers, is by landfilling it in the crops as a fertilizer. However, the manure poses many dangers as it is a very strong pollutant for water courses and soil. It can cause eutrophication in watercourses and water bodies due to nitrogen (Bernet and Béline, 2009 and Prapaspongsa et al., 2010). If land spreaded without precautions it will contaminate the soil, and underground water bodies due to excess in phosphorous and nitrogen compounds (Bernet and Béline, 2009 and Prapaspongsa et al., 2010). Piggery effluent is also responsible for gas emissions, notably greenhouse gases and nitrogen-based gas (ammonia and nitrous oxide), and foul odours (Bernet and Béline, 2009 and Prapaspongsa et al., 2010). So, it is always necessary to provide treatment process the manure in order to safely dispose the pig industry effluents.
1.3.2. Piggery effluent: characteristics
The piggery effluent (PE) is an animal residue and it consists of pig excretions. Usually, the solid fraction is composed by animal excretions and food leftovers, and the liquid fraction is composed by urine and water from washing and disinfections. Usually it is rich in organic matter, solid residues (usually above 40 g L-1) and nitrogen (mostly ammonia) (Bernet and Béline, 2009; Boopathy, 1998 and Hwang et al., 2010). Also it contains high amounts of phosphorus and potassium, and other compounds that create foul odours (e.g. volatile fatty acids and phenolic compounds) as well. This means that this waste has a high COD and a pH around 7.5 (Beaudet et al., 1990; Bernet and Béline, 2009; Boopathy, 1998; Hatfield et al., 1998 and Zhu, 2000). Additionally, proteins, lipids and cellulosic residues, are also present (Boopathy, 1998). It also contains many microorganisms that are potentially pathogenic for humans, such as bacteria and virus, and also protozoans (Beaudet et al., 1990; Bernet and Béline, 2009; Pagilla et al., 2000 and Zhu, 2000).
1.4. Effluent treatment
There are many methods to provide the treatment of the effluents, and they can be physical, physio-chemical and biological.
1.4.1. Physio-chemical treatments
Physical methods are used to treat wastes. Some of them are filtration, centrifugation, incineration and sedimentation (Paraskeva and Diamadopoulos, 2006 and Simate et al., 2011). Membrane filtration is another physical method in which separates bigger compounds from residual emulsion through porous
4 membranes (Simate et al., 2011). However, they are scarcely used without being associated with other methods because they can remove solid matters and suspended particles but they are rather inefficient to remove dissolved pollutants from the effluents (Paraskeva and Diamadopoulos, 2006 and Simate et al., 2011). In physio-chemical methods, both physical and chemical processes are involved and generally used to treat the wastes. Usually, the chemical treatments take priority in detriment of physical only. The pH can be adjusted given the initial value of the effluent. For example, carbon dioxide can be used to neutralize caustic effluents or making them more acidic if it’s going to be treated in a bioreactor (Simate et al., 2011). Coagulation and flocculation consists in aggregating and sedimenting organic compounds and/or colloidal substances by using coagulants. Fenton reaction (uses oxidation with free radicals), the electrochemical oxidation (using electricity as a way to eliminate the toxic compounds from the effluent), the electrocoagulation (an electrode produces a coagulant), the adsorption and ionic exchange are other examples of the physio-chemical methods (Kapellakis et al., 2008 and Paraskeva and Diamadopoulos, 2006).
1.4.2. Biological treatment
Biological methods involve microorganisms to degrade the effluents’ organic compounds. Compared to other processes, it has the ability to remove more organic loads at lower costs, in exchange for higher energy input (Paraskeva and Diamadopoulos, 2006 and Simate et al., 2011). These processes are divided in aerobic and anaerobic digestion.
Aerobic digestion uses microorganisms, mainly bacteria and fungi, which use oxygen to degrade the wastes materials to inorganic end-products (Simate et al., 2011). Activated sludge in aerated tanks and biofilms are some examples of aerobic digestion (Simate et al., 2011). However, an adaptation period is always necessary for the aerobic microorganisms to be able to remove or convert organic compounds (Paraskeva and Diamadopoulos, 2006). Anaerobic digestion is having an increasing adhesion in treating effluents because, in general, it can eliminate more effluent organic load in relation to aerobic digestion, allowing to recover chemical energy in form of methane, and with the possibility to combine with other pre-treatment processes (Kapellakis et al., 2008). The biogas produced from this process is mostly used as a fuel, for electric and thermic energy, the latter frequently directed for heating the reactor itself (Holm-Nielsen et al., 2009). Additionally, the digested flow can be reused as fertilizer in agricultural production (Holm-Nielsen et al., 2009). Anaerobic digestion uses anaerobic bacteria and archaea, which have low rate of growth and low energetic needs compared to aerobic microorganisms (Paraskeva and Diamadopoulos, 2006), and can be applied to a wide variety of residues. The most used are farming/cattle manures (for example swine and bovine) and municipal wastewaters (Holm-Nielsen et al., 2009 and Mao et al., 2015). Anaerobic digestion can occur at thermophilic (40 – 70ºC) or mesophilic (20 – 40ºC) conditions of temperature. Thermophilic anaerobic digestion has been accepted because it can provide greater biogas production rate and due to the ability of supporting high loads than mesophilic conditions. However, it has a tendency to acidify and needs to spend more energy to maintain the temperature (Mao et al., 2015). Mesophilic digestion also has been widely used due to its better stability, and greater microorganisms’ diversity, although it is less efficient in biodegrading effluents’ compounds and provide a lower methane production (Mao et al., 2015). Others drawbacks of the mesophilic digestion lies in its inability to inactivate the all effluent pathogens because of its low working temperature, (50ºC at least is necessary, only achievable in thermophilic digestions) and the need with longer retention times (Pagilla et al., 2000). It has been made experiments at 30ºC for mesophilic temperatures, but it was verified that the optimal temperature, for better methane yield, is close to 40ºC (Sakar et al., 2009).
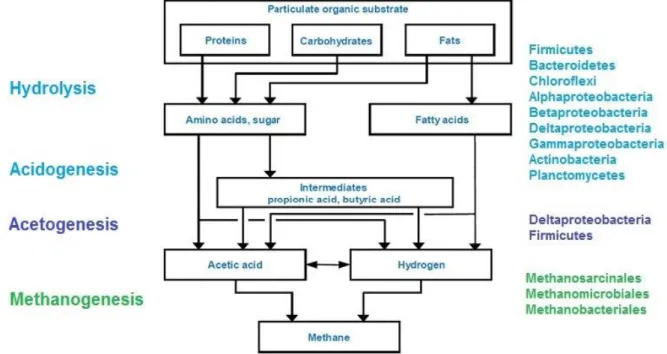
5 Anaerobic digestion can be described in three phases, all happening in sealed tanks and without oxygen, as shown in Figure. 1.1.: the first phase, the hydrolysis or liquefaction, the bacteria, able to ferment and release hydrolytic enzymes, degrade complex compounds (like polysaccharides, polyphenols, among others) into soluble monomers, mainly monossacharides, long chain acids, alcohols and amino acids. The second phase, the acidogenesis, and acetogenesis, acetogenic bacteria convert the latter compounds into alcohols and organic acids (including acetate), and H2. The last phase, considered the most important, methanogenic archaea and bacteria degrade acids and acetates into methane and carbon dioxide (Ahring, 2003; Hwang et al., 2010; Kapellakis et al., 2008; Kim et al., 2010; Kim et al., 2013 and Paraskeva and Diamadopoulos, 2006). Between these three groups there is a delicate balance to be respected in order to get the maximum yield in producing biogas from the organic load of residues used as substrates. The second group relies on the ability of the third group of microorganisms in removing hydrogen from the medium; so, the less hydrogen concentration bigger is the degradation of volatile fatty acids by the second group (Ahring, 2003). However, the bacteria (and archaea) used for this process, especially the methanogens, are sensitive to variations inside the reactor. One example is the pH, their working range is between pH 6.5 – 7.8 (Sakar et al., 2009). So it is important to maintain the conditions stable due to sensitivity of microorganisms; if a change occurs, the process would become unstable, resulting in low biogas yields (Mao et al., 2015).
1.5. Scope and objectives of the study
The principal objective of this study is to valorise energetically organic effluents - olive oil and beer industries - through the anaerobic digestion to the biogas/methane production, by means of the effluent complementarity concept. The concept of effluent complementarity has been studied and applied in anaerobic digestions of unbalanced and/or concentrated substrates, with the intention of adding certain deficit components into an effluent and/or diluting it, using another effluent/residue. In Marques, 2001 and Sampaio et al., 2011, piggery effluent was used to complement and dilute OMW. Further advantages include lowering costs, avoid substrate chemical adjustments and/or pre-treatments and improve biogas and methane production.
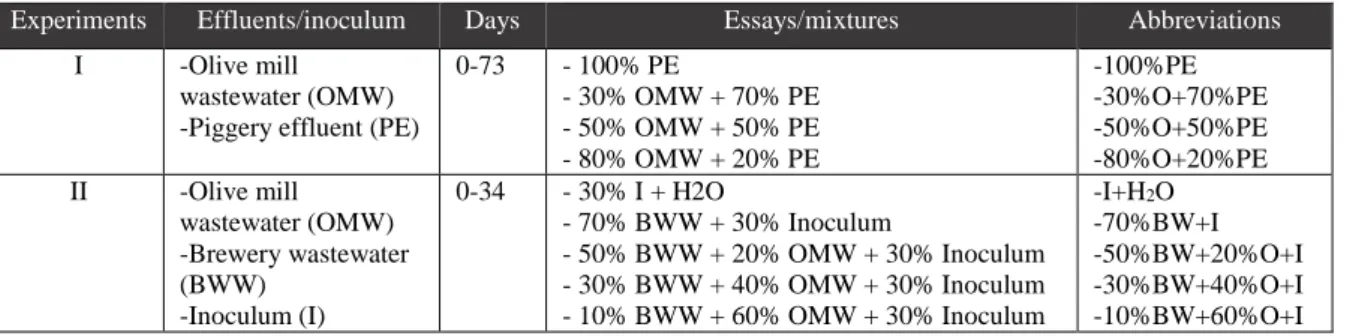
6 The present work aims to reduce the toxicity of OMW and provide nutrients, by using a concentrated and diluted substrate (piggery effluent and brewery wastewater, respectively), under batch conditions, as shown in Table 1.1. On the other hand, it was intended to test the brewery effluent as a dilution element of a concentrated substrate (piggery effluent), under semi-continuous feed conditions, according to Table 1.2.
2. MATERIAL AND METHODS 2.1. Substrates and inoculum sampling
The olive mill wastewater (OMW) was collected from an olive mill located in Rio Maior, Portugal, which work with three-phase continuous extraction process. The brewery wastewater (BWW), which was submitted to a primary treatment stage, was provided by Sociedade Central de Cervejas e Bebidas (SCC) (Vialonga, Portugal). Piggery effluent (PE) was collect at Valorgado (Salvaterra de Magos, Portugal). Valorgado has 9000 animals and the effluent produced by the farm swine facilities is estimated at 900 – 1700 m3d-1, being piped and separated into two fractions, one solid and another liquid. Experiment substrate was the liquid fraction after a removal operation of main solids by a solid-liquid separator. It was conducted by plumbing to the first pond. Experiment samples were collected at the top of this pond feed tube, making his PE an atypically concentrated piggery effluent. Biologic solids, from an anaerobic digester of a wastewater treatment plant (SIMARSUL, Quinta do Conde, Portugal), were used as inoculum (I).
2.2. Anaerobic digestion experimental set-up
In the first essay, PE and OMW were used as the substrates. The digestion was performed in triplicates under batch conditions, using glass flasks with 165 mL total volume, leaving 125 mL for headspace. Different mixtures by increasing the OMW from amounts of 30% to 80% and decreasing the PE from 70% to 20%. The essay mixtures were reported as: 30% OMW + 70% PE, 50% OMW + 50% PE, 80% OMW + 20% PE, and 100% PE for control (Table 1.1.).
In the second essay, OMW and BWW were used as the substrates, and mixtures were inoculated at 30%. The digestion was performed in triplicate under batch conditions, using glass flasks with 71.5 mL total volume, leaving 31.5 mL for headspace. Different mixtures were obtained by increasing OMW from
Experiments Effluents/inoculum Days Essays/mixtures Abbreviations
I -Olive mill
wastewater (OMW) -Piggery effluent (PE)
0-73 - 100% PE - 30% OMW + 70% PE - 50% OMW + 50% PE - 80% OMW + 20% PE -100%PE -30%O+70%PE -50%O+50%PE -80%O+20%PE II -Olive mill wastewater (OMW) -Brewery wastewater (BWW) -Inoculum (I) 0-34 - 30% I + H2O - 70% BWW + 30% Inoculum - 50% BWW + 20% OMW + 30% Inoculum - 30% BWW + 40% OMW + 30% Inoculum - 10% BWW + 60% OMW + 30% Inoculum -I+H2O -70%BW+I -50%BW+20%O+I -30%BW+40%O+I -10%BW+60%O+I
Experiment Effluents Conditions of treatment Substrate Days HRT
III -Brewery wastewater -Piggery ef-fluent Anaerobic digestion in semi-continuous condi-tions, different HRT (5.7, 3.0 and 1.0 days) 40% PE + 60% BWW 0-19 20-37 41-47 5.7 3.0 1.0 Table 1.1.: Anaerobic digestion in batch conditions
Table 1.2.: Anaerobic digestion in semi-continuous conditions for the hybrid anaerobic reactor
7 amounts of 20% to 60%, and decreasing BWW from 70% to 10%. The following mixtures were as reported: 70% BWW + 30% I, 50% BWW + 20% OMW + 30% I, 30% BWW + 40% OMW + 30% I, 10% BWW + 60% OMW + 30% I and 30% I + 70% H2O for control (Table 1.1.).
All mixtures and flasks from both essays were deaerated with nitrogen gas and sealed to ensure anaerobic conditions. The flasks were incubated at constant temperature of 37 ± 1ºC. The biogas production was monitored daily with a pressure transducer, expressed to standard conditions of temperature and pressure (STP: 0ºC, 1 bar).
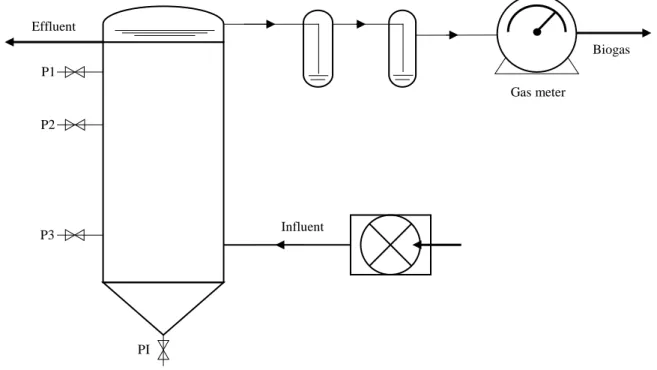
The third essay was sub divided into three phases, related to the time the substrate was maintained inside the reactor, i.e., the hydraulic retention time (HRT), as shown in Table 1.2. The first phase corresponds to HRT of 5.7 days, the second phase was 3.0 days, and the final phase was 1.0 day. A hybrid anaerobic reactor, designed and tested in LNEG, was used in this essay (Figure 2.1.). It has 1.7 L of useful volume, with a total of 2 L, and it’s equipped with a packed bed on the upper 1/3 of the reactor height, which was selected from previous studies (Marques, 2001). Also, it had no solid/liquid/gas separator device nor substrate recycler installed. For the substrate a mixture of BWW and PE was made (40% PE and 60% BWW, v/v) to feed the reactor. The reactor was fed with substrate in up-flow mode through peristaltic pump, and digested in fed-batch conditions. The reactor’s temperature was maintained at 37ºC, by using a water jacket, throughout the experiment. Before the experiment, PE was only used in the start-up phase of the reactor (data not shown). To measure the biogas production a wet gas meter was used, expressed to standard conditions of temperature and pressure (STP: 0ºC, 1 bar). Additionally, some samples were collected during the essay from the inside of the reactor to determine its profile.
2.3. Analytical and chromatograph methods 2.3.1. pH
The pH of the effluents and the mixtures for anaerobic essays was measured with SenTix 41-3 (WTW) pH electrode, according to Standard Methods (APHA, 2012), before and after each experiment.
Influent Effluent P1 P2 P3 PI Gas meter Biogas
8
2.3.2. Total and volatile solids
Total solids (TS) is the term applied to the solid residue left in the vessel after drying and evaporation of a sample in an oven, at a defined temperature. Total solids includes ‘‘total suspended solids,’’ the portion of total solids retained by a filter, and ‘‘total dissolved solids’’, the portion that passes through the filter.
Total Solids were assayed according to Standard Methods (APHA, 2012). For each experiment, 10 or 20 mL samples were weighed in crucibles, in duplicates, and dried at 103-105ºC overnight to evaporate all water. The residue was cooled, weighed, and total solids were determined. To measure Volatile Solids (VS), an ignition at 550ºC for 1 hour was made in a muffle furnace, and weighed after cooling down (APHA, 2012). The total and volatile solids were determined by comparing the mass of the sample before and after each drying step.
2.3.3. Chemical oxygen demand
Chemical oxygen demand (COD) is defined as the quantity of oxygen, which is required to oxidize the organic matter present in a sample under controlled conditions (temperature, time and oxidizing agent). For the chemical oxygen demand, the open reflux method, with potassium dichromate, was used, according to Standard Methods (APHA, 2012), as follows:
20 mL of sample, in duplicates, were diluted 1:50 (1:100, when samples had high organic load). In each COD tube, containing diluted sample, 0.5 g of HgSO4 and 5 mL of AgSO4 6.6 g L-1 in H2SO4 were added. Then 10 mL of K2Cr2O7 (0.25 N) and 25 mL of the same acid solution were added. The tubes were refluxed at 150ºC for 2 hours, cooling down, and distilled water was added until final volume of 400 mL plus 4 drops of ferroin. The color change is sharp, going from blue-green to reddish-brown. Then titration proceeded with a ferrous ammonium sulphate solution (0.25 N). In order to determine the exact normality of ferrous ammonium sulphate solution, a titrand was made with 25 mL of sulfuric acid solution, 10 mL K2Cr2O7 (0.25 N) and 400 mL of distilled water and some ferroin’s drops. The COD of the sample is given as follows (Equation 2.1.):
COD (mg/L) = [(VA-VB) x T x 8000 x DF]/V
Equation 2.1.: COD equation
where, VA = Volume, in mL, of ferrous ammonium sulfate solution required for titration of the blank; VB = Volume, in mL, of ferrous ammonium sulfate solution required for titration of sample; T = Normality of ferrous ammonium sulfate solution; DF = Dilution factor, if appropriate; V = Volume, in mL, of sample used for the test.
2.3.4. Total phenolic content and electrophoretic profile
Total phenolic content was determined by a colorimetric method (Singleton and Rossi, 1965), using caffeic acid as standard for calibration curve. The samples were centrifuged at 13000 rpm for 10 minutes, then they were filtered in a GF/C fibre glass (1.25 μm pores) filters (Whatman), and diluted (1:20, or 1:50 for higher phenolic concentration). A main solution of caffeic acid was prepared (500 mg L-1), diluted 1:5; and different concentrations (0 – 100 μg mL-1) of the same solution were prepared for the calibration curve. For each sample tube and calibration curve tube (1 mL) the next steps were as follows: addition of 5 mL of Folïn-Ciocalteau reagent (diluted 1:10), vortex and pause for 3 minutes; addition of 4 mL of Na2CO3 (7.5% m/v), vortex and pause for 2 hours. Concentration of total phenols was determined using the calibration curve of caffeic acid, at 765 nm wavelength.
9 Phenolic profiles were obtained by capillary zone electrophoresis (CZE), using an Agilent system equipped with DAD. CZE separation was performed using a fused-silica uncoated capillary with extended light path (i.d. 50 µm, 62/56-cm length). The samples were injected at 50 mbar for 6 s under a voltage of 30 kV. The temperature was maintained at 30°C. The electrolyte (15 mM borate in 10% MeOH) was adjusted to pH 9.1. The capillary was pre-conditioned by flushing with 0.1 M NaOH for 3 min and subsequently running buffer for 3 min. Compounds were detected at 200 and 280 nm and identified by comparison of their UV spectra and migration times to authentic standards. The resulting graphics are found in Appendices section.
2.3.5. Total nitrogen (kjeldahl)
To measure total nitrogen in effluents and samples this analysis was made according to Standard Methods (APHA, 2012). 5 mL of sample, in duplicates, were put in Kjeldahl tubes, in which 50 mL digestion reagent (134 g K2SO4, 200 mL H2SO4 and 2 g HgO, for 1 L solution) was added. The digestion was made in vacuum and in constant heating until the samples acquired transparent colour. After that 100 mL of distilled water without ammonia and some drops of phenolphthalein were added. To distil the nitrogen from the samples an automatic distiller unit (Büchi Distillation Unit K-350) was used with 50 mL of boric acid indicator mix solution (20 g of H3BO3, 10 mL of indicator mix of methyl red and blue methylene, for 1 L) to retain nitrogen. Also 50 mL of thiosulphate hydroxide was added to samples. The Erlenmeyer with the boric acid solution was then titrated using H2SO4 0.02 N (or 0.1 N if the samples had high concentration of nitrogen) standard solution as titrant. The total nitrogen of the sample is given as follows (Equation 2.2.):
Organic N (mg/L) = [(VD-VE) x 280]/V
Equation 2.2.: Kjeldahl nitrogen equation
where, VD = Volume, in mL, of H2SO4 solution required for titration of sample; VE = Volume, in mL, of H2SO4 solution required for titration of the blank; V = Volume, in mL, of sample used for the test.
2.3.6. Ammonia nitrogen
The ammonia nitrogen methods was described in Standard Methods (APHA, 2012). For each sample (10 mL), in duplicates, 140 mL of distilled water without ammonia and 25 mL borate buffer (88 mL NaOH 0.1N + 500 mL Na2B4O7.10H2O 0.025 M, for 1 L) were added. The distillation and titration were made in similar fashion as total nitrogen (cf. Total nitrogen), using only the boric acid solution.
2.3.7. Volatile fatty acids
To determine the presence of volatile fatty acids (VFA) 1 mL of each sample was taken and centrifuged at 13000 rpm for 15 minutes, decanted and centrifuged again, collecting the final supernatant. Then some drops of orthophosphoric acid (85% concentrated), diluted with water 1:1 were added to samples until reach the pH 2. Analyses of VFAs were performed using a gaseous chromatograph Hewlett-Packard 5890 GC-FID and a Shimadzu C-R5A register/integrator. An internal standard solution (100 μL pivalic acid 0.1% p/p) was added to the sample (400 μL), and 1 μL from the solution was injected in chromatograph. For each standard solution, 200 mg L-1 of each acid (acetic, propionic, isobutyric and butyric, with 0.1% p/p concentration) was used. Total VFA concentrations were expressed as acetic acid.
2.3.8. Biogas composition
To monitor the biogas composition in terms of methane and carbon dioxide, 0.2 mL gas samples were taken from the digester headspace and analysed weekly by gas chromatographic techniques (Varian
430-10 GC, TDC; HP-5890, FID), according to ASTM Standard Method (D1946–90, 2000). Gas chromatograph was equipped with a thermal conductivity detector and a Porapack S column of 1/8՚՚x 3 m. Column, injector and detector temperatures were 50, 60 and 100ºC, respectively. Nitrogen was utilized as the carrier gas (20 mL mn-1).
2.3.9. Antioxidant activity
To measure the antioxidant capacity, a radical scavenging activity against stable DPPH radical (2,2-diphenyl-2-picrylhydrazyl hydrate) method was used (Brand-Williams et al., 1995). Initially, 20 mL of mixtures and effluents were freeze-dried and weighed (approximately 0.5 g for all samples, but sometimes less due to low volume available or low amount of contents). Then they were dissolved in distilled water and/or methanol (at least 5 mL of volume). If it still had sediments, only the supernatant was used. 50 μL of sample were added in a tube, in triplicates, and added 1950 μL DPPH 0.06 mM solution (prepared daily). A calibration curve was made using a Trolox 1.5 mM solution as standard antioxidant (dissolved in ethanol), made in triplicate (each with 50 μL of solution) and adding 1950 μL of the same DPPH solution. Then the tubes were kept in dark for 30 minutes, and lastly, the absorption was measured spectrophotometrically at 515 nm wavelength, in a microplate reader Multiskan GO (Thermo Scientific). An increase of DPPH radical scavenging activity was detected by a decrease of DPPH solution absorbance. The radical activity was calculated by the following equation (Equation 2.3.):
%DPPH inhibition = [(Absb –Abss)/ Absb] x 100
Equation 2.3.: Antioxidant activity equation
where, Absb is the absorption of blank (t = 0 min) and Abss is the absorption of tested solution or sample (t = 30 min). The antioxidant activity was expressed in mmol TEAC (Trolox Equivalent Antioxidant Capacity).
2.3.10. Microscopy
A sample of 70%BWW+I mixture was collected after the end of the experiment, and the observation was made under optical microscopy (Olympus BX51), with a 40x ocular making a 400x total amplification.
2.3.11. Analysis of pigments
To assess the presence of pigments an aliquot of culture medium, from the 70%BWW+I mixture after the experiment, was collected and diluted in water. After that, the absorption spectrum of intact cells was measured within a range of 380 – 900 nm (Shimadzu UV – 2401PC).
2.4. Molecular analysis 2.4.1. DNA extraction
To evaluate the biodiversity present in effluents and mixtures DNA extraction was made based in method described by Zhou et al., 1996, and adapted for this samples (Eusébio et al., 2011).
The process begun with centrifuging 50 mL of samples (10000 rpm, 20 minutes), in Oakridge tubes. The pellet was ressuspended in 10 mL Extraction Buffer (100 mM Tris.HCl [pH 8.0], 100 mM EDTA Na [pH 8.0], 100 mM NaPO4 [pH 8.0], 1.5 M NaCl, 1% CTAB) and 100 μL Proteinase K (10 mg mL -1), and incubated at 37ºC and shaked at 225 rpm, for 30 minutes. Then SDS 20% was added (1.5 mL/10 mL sample) and incubated in water-bath at 65ºC for 2 hours. Then the sample was centrifuged 10000 rpm for 10 minutes and the supernatant distributed into eppendorfs (600 μL each). The pellet was
11 extracted again by repeating the following two times: 4.5 mL of Extraction Buffer and 0.5 mL SDS 20%, vortex 10 seconds, incubated in 65ºC water-bath for 10 minutes and centrifuged 10000 rpm for 10 minutes. The supernatant from these extraction cycles was distributed through eppendorfs, an equal volume of chloroform-isoamyl alcohol (24:1) was added, and centrifuged at 13000 rpm for 10 minutes; the aqueous phase was collected and this process was repeated once more. The aqueous phase was precipitated with 0.6 volume of isopropanol and 0.1 volume of 2.5 M C2H3NaO2 solution and was kept at -20ºC for 1h. The pellet of crude nucleic acids was recovered centrifuging at 13000 rpm for 20 minutes, and added cold ethanol 70%, left overnight at -20ºC, then centrifuged 13000 rpm, for 20 minutes, ressuspended in TE solution (10 mM Tris.HCl [pH 7.5], 1 mM EDTA), and stored at -20ºC. There were made optimizations of the initial method in order to optimize the yield and quality of DNA extracted. The purity was controlled through absorbance readings at 230, 260 and 280 nm, also to determine 260/280 and 260/230 ratios for protein and polysaccharide/polyphenols contaminations, respectively. If the ratio for 260/280 is superior than 1.8 and 260/230 is superior than 2.0, then the extracted DNA is considered pure. Otherwise, if it’s below it is contaminated by either proteins or humic acids, or both. Also, the reading at 260 nm gives the estimate amount of DNA present in the obtained extract (A260 = 1.0 means that there are 50 μg of DNA).
In order to avoid contamination, decrease smearing and increase integrity of genomic DNA after extraction, several trials were essayed with samples with more phenolic content and organic load, as follows:
- A) 2% CTAB on Extraction Buffer solution to eliminate humic acids from the samples (e.g. samples from piggery effluent);
- B) 2% CTAB, 100 μL lysozyme (25 mg mL-1) to eliminate the protein contaminants and 5 μL RNAse A (10 mg mL-1) after isopropanol addition (e.g. samples from piggery effluent); - C) 2% CTAB, 5 μL RNAse (10 mg mL-1) added between chloroform-isoamyl alcohol steps,
and without the extract being overnight at -20ºC after ethanol addition (e.g. samples from OMW);
- D) 2% CTAB, 75 μL RNAse A added after chloroform-isoamyl alcohol steps and the extract was left 1h at -20ºC after ethanol addition (e.g. samples from all effluents);
- E) Similar to the latter, but with 3% CTAB to eliminate the humic acids/polyphenols from the extracts that came from samples with the highest amount of them.
2.4.2. Next generation sequencing
The sequencing of the extracted DNA was carried out on Stab Vida facilities (Lisbon, Portugal) using MiSeq (Next Generation Sequencing, NGS), as followed:
the extracted DNA was pooled, quantified and checked for purity using QubitTM (Thermo Fisher Scientific) prior to storage at −20°C. For NGS, V3 and V4 regions of bacterial and archaeal 16S rRNA gene were amplified with universal primers 515F - 806R. Library construction was performed using the Illumina 16S Metagenomic Sequencing Library preparation protocol. The generated DNA fragments (DNA libraries) were sequenced with MiSeq Reagent Kit v3 in the lllumina MiSeq platform, using 300 bp paired-end sequencing reads.
The bioinformatics analysis of the generated raw sequence data was carried out using the Quantitative Insights Into Microbial Ecology (QIIME2, version 2018.11) (Caporaso et al., 2010). The reads were denoised using the Divisive Amplicon Denoising Algorithm 2 (DADA2) plugin (Callahan et al., 2016), where the following processes were applied: Trimming and truncating low quality regions; dereplicating the reads; filtering chimeras. After denoising, the reads were organized in features, which are operational taxonomic units (OTUs) and a feature Table was generated using the plugin feature-Table
(https://github.com/qiime2/q2-feature-Table), with each feature being represented by exactly one sequence. After applying the plugins Alignment (Katoh and Standley, 2013), Phylogeny (Price et al.,
12 2010) and Diversity (https://github.com/qiime2/q2-diversity), a pre-trained sk-learn classifier (Pedregosa et al., 2011) based on the SILVA (Glöckner et al., 2017) (release 132 QIIME) with a clustering threshold of 97% similarity was applied to generate taxonomy Tables. Taxonomic classification was achieved by using plugins Feature-classifier (https://github.com/qiime2/q2- feature-classifier) and Taxa (https://github.com/ qiime2/q2-taxa) where only OTUs containing at least 10 sequence reads were considered as significant.
3. RESULTS AND DISCUSSION 3.1. Effluents
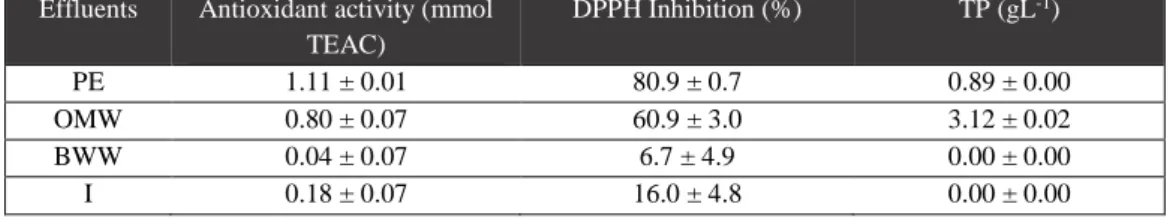
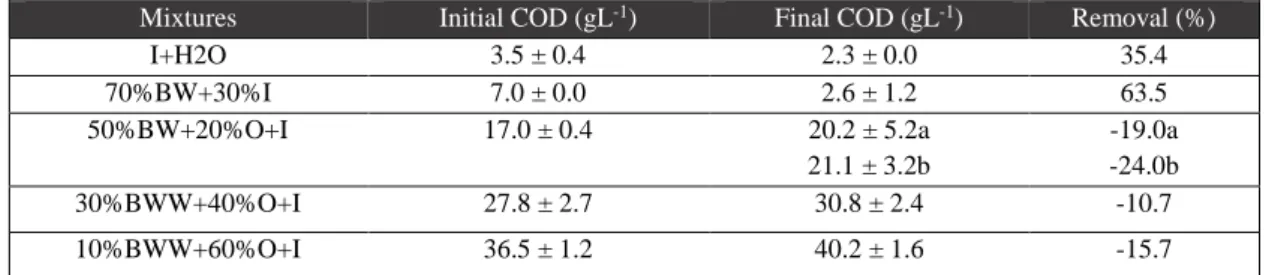
PE and OMW are substrates with very high organic compounds concentrations (93 and 106 g L-1 COD, respectively), as shown in Table 3.1., indicating a great potential for biogas/methane production. On the other hand, these effluent present complementary characteristics in terms of composition that can be used advantageously to balance the conditions of anaerobic digestion process. Effectively, the inhibitory capacity of OMW, due to the total phenolic concentration (about 3 g L-1, and containing tyrosol,
hydroxytyrosol and its derivatives, shown in Table 3.2. and Appendices figure 1.b.), associated with an acid pH, can be minimized by addition of PE. PE is also characterized by a good antioxidant activity, with more than 80% inhibition of the radical (Table 3.2.). Furthermore, the OMW nitrogen lack (determined through total and ammonia nitrogen) may also be compensated by the presence of the high nitrogen content of PE (4.9 g L-1 in total, 3.2 g L-1 in ammonium; Table 3.1.).
BWW is a very diluted effluent and, comparatively, it holds the lowest concentration of organic materials (7 g L-1 COD, 4 g L-1 TS and 1 g L-1 VS), being characterized by an acid pH, low nitrogen content and a lack of phenolic contents (Tables 3.1., 3.2. and 3.3.). These features are justified since the effluent was previously submitted to a primary treatment, before to be collected as substrate for this work.
All tested effluents had a VFA composition including different acids, with acetic acid in the majority (Table 3.3.). The largest acids amounts are present in the BWW and PE, in which the acetic acid of
Effluents COD (gL-1) Total Solids
(gL-1) Volatile Solids (gL-1) Total nitrogen (mgL-1) Ammonium nitrogen (mgL-1) PE 93.22 ± 5.01 47.4 ± 0.8 31.9 ± 0.6 4900.0 ± 277.2 3206.0 ± 19.8 OMW 105.79 ± 1.00 31.8 ± 0.0 26.1 ± 0.2 212.8 ± 15.8 1.4 ± 1.6 BWW 7.37 ± 0.00 3.6 ± 0.1 1.3 ± 0.1 25.2 ± 4.0 7.0 ± 2.0 I 17.55 ± 0.38 12.5 ± 0.1 9.6 ± 0.0 784.0 ± 79.2 351.4 ± 2.0
Effluents Antioxidant activity (mmol TEAC) DPPH Inhibition (%) TP (gL-1) PE 1.11 ± 0.01 80.9 ± 0.7 0.89 ± 0.00 OMW 0.80 ± 0.07 60.9 ± 3.0 3.12 ± 0.02 BWW 0.04 ± 0.07 6.7 ± 4.9 0.00 ± 0.00 I 0.18 ± 0.07 16.0 ± 4.8 0.00 ± 0.00
Table 3.1.: Characteristics of the effluents and inoculum
PE = piggery effluent; OMW = olive mill wastewater; BWW = brewery wastewater; I = inoculum; COD = chemical oxygen demand
Table 3.2.: Antioxidant activity and total phenolic (TP) content
PE = piggery effluent; OMW = olive mill wastewater; BWW = brewery wastewater; I = inoculum; DPPH = 2,2-diphenyl-2-picrylhydrazyl hydrate
13 BWW almost duplicates the concentration of the latter (2.27 versus. 1.37 g mL-1). In opposition, OMW presents the lowest VFA concentration and it indicates that the flow provided by the olive oil production is comparatively more preserved than the other two effluents.
3.2. First essay: anaerobic digestion with piggery effluent and olive mill wastewater 3.2.1. Biogas production
Biogas production was registered in all tested mixtures without any “lag” phase (see Figure 3.1.). The biogas production started immediately and a similar accumulated volume, around 120 mL, was observed in all units, elapsed 13 days. From then on and over the remaining experimental time, units containing 100%PE and 30%OMW+70%PE showed a similar behaviour, having provided the highest accumulated biogas amount (about 780 mL, Figure 3.1.) of all experiment.
Units containing 50%OMW+50%PE had maintained a stable period without producing biogas, for a period of about 30 days reaching a volume of 120 mL, approximately. After 30th day, the assay was able to generate some gas until the end but not exceeding the mean value of 330 mL. This performance can be understood as the result of a late process (after day 30th), in which the microorganisms were adapted to degrade polyphenols (from OMW). After that, the biogas producers (the methanogenic) were able to generate more gas. Comparatively, the gas production absence from the other essay, involving a volume participation of 80% of OMW (80%OMW+20%PE), suggests that, under the tested operating conditions, around 50% v/v the inhibitory influence of OMW starts to affect the biogas production in the blends.
The high standard deviation obtained in 50%OMW+50%PE essay (Figure 3.1.) results from a distinguished behaviour of one essay triplicate (cf. Material and Methods), in relation of the other two units. To illustrate the data, the biogas production is presented separately in the Figure 3.1.a. (unit 5 versus 4 and 6). The higher biogas production observed in unit 5, mainly at the end of experimental time, can be related to a new adaptation process of the microbial consortium that had developed in this digester.
Concerning biogas composition, the units containing 100%PE and 30%OMW+70%PE showed the highest methane concentrations (around 70% CH4; Table 3.4.), being in agreement with the previous observations and indicating the presence of an active methanogenic archaea population in both assays. The value of 60% of methane in biogas, from 50%OMW+50%PE mixture, may result from an adaption process of the remaining consortium that maintained the capacity of convert the substrate and produce biogas. As expected, a very poor biogas was obtained in 80%OMW+20%PE, confirming the negative influence in the anaerobic consortium if a higher OMW proportions are included in the unit influent.
Effluents Acetic acid (mgL-1) Propionic acid (mgL-1 in ace-tic acid) Isobutyric acid (mgL-1 in acetic acid) Butiric acid (mgL-1 in acetic acid) Total (mgL-1 in acetic acid) pH PE 1373.00 561.75 2157.74 1545.72 5638.21 7.27 OMW 213.00 64.04 110.41 159.48 546.93 5.09 BWW 2272.00 551.21 66.79 237.17 3127.18 5.10 I 1094.00 231.02 100.87 104.96 1530.85 7.43
Table 3.3.: Volatile fatty acids and pH
14 From the data recorded during the experiment it is possible to infer that OMW is a substrate with high inhibitory capacity against anaerobic digestion processes, only allowing small proportions (30% v/v) being mixed with PE. Using larger proportions in the blend (> 50%) results in deficient or non-biogas production. 0 50 100 150 200 250 300 350 400 450 500 550 600 650 700 750 800 0 5 10 15 20 25 30 35 40 45 50 55 60 65 70 75 Ac cu m u la te d b io g a s, S TP (m L) Time (d) 100% PE 30% OMW + 70% PE 50% OMW + 50% PE 80% OMW + 20% PE
Fig. 3.1.: Biogas production of the first experiment, involving PE and OMW
0 50 100 150 200 250 300 350 400 0 5 10 15 20 25 30 35 40 45 50 55 60 65 70 75 Ac cu m u la te d b io g a s, S TP (m L) Time (d) Units 4 and 6 Unit 5 a