ISSN: 1809-4430 (on-line) TECHNICAL PAPER
ANAEROBIC DIGESTION STABILITY TEST BY SHEWHART CONTROL CHART
Doi:http://dx.doi.org/10.1590/1809-4430-Eng.Agric.v37n3p618-626/2017
MICHAEL S. ALCANTARA1*, GEOVANE GRISOTTI2, MARIA H. F. TAVARES2,
SIMONE D. GOMES2
1*Corresponding author. Federal University of Technology – Paraná (UTFPR)/ Dois Vizinhos - PR, Brasil.
E-mail: [email protected]
ABSTRACT: The anaerobic digestion (AD) operation complexity raise the importance of stability
testing to verify whether the operating conditions are under control and whether the process is working as required. The current method of verifying process stability is by a range of the ratio between volatile fatty acidity and total alkalinity (VFA/ TA) within which stable conditions are brought about; these rates vary with the content of organic material. A few indicators as pH or constant biogas production are also used. Therefore, the aim of this study was to propose the use of Shewhart control chart for individual measures as a stability test for AD, as well as to demonstrate its use in poultry litter AD. The method showed to be advantageous since it standardizes a variation range for the process according to the average and verifies the stability by direct measures, such as organic material removal efficiency and biogas production.
KEYWORDS: process monitoring, statistical process control, waste treatment.
INTRODUCTION
Currently, the methods that have been used to evaluate AD stability are indicators as pH, VFA/ TA ratio and constant biogas production.
The pH measure is considered less important than the VFA/ TA ratio for representing large changes in alkalinity, with small variations on a logarithmic scale. Experimental results have shown that, in the event of a drastic pH drop due to VFA accumulation, AD process rarely returns to normal operation (MÉNDEZ-ACOSTA et al., 2010). According to AYMERICH et al. (2013), understanding the dynamic behavior and diffusion pattern of high-solid systems is a key role for the identification of inhibitory levels for different compounds, e.g. VFA, besides detecting periods of imbalance.
Continuously sought attributes for system monitoring have to be low cost, low maintenance, easy to use, and produce fast and accurate responses (JOBLING PURSER et al., 2014). In this context, a statistical process control could be used as stability test for the AD process.
A process can be understood as a system transforming “inputs” (AD) into value-added products, being influenced by natural or random factors, and special or non-random factors. Slight and inevitable variations, which are difficult to trace, result from natural process factors. Special process factors result in traceable changes, whether planned or not, which are characterized by actual changes such as in materials, the environment, or the used method.
Among the most used tools of statistical process control are the control charts. They stand for graphical analysis and monitoring of a process regarding timewise by two characteristics: centralization - the process average and dispersion, estimated by its standard deviation or range of data (HO & QUININO, 2013). The objective of a control chart is to seek for signs of special causes affecting the process stability by visual identification of the behavior of critical quality variables (HACHICHA & GHORBEL, 2012; ABBAS et al., 2013).
k: a specified number of standard deviations; : population standard deviation;
UCL: upper control limit; CL: center line,
LCL: lower control limit.
According to MONTGOMERY (2009) and MINITAB 15 (2013), the standard to build the
chart is by using (sample mean) to , k = 3, to , d2 as a factor for center line and
w = 2 to observations number used in the calculation the moving average range ( ). However, it
is also possible to use control limits narrower than three-sigma ones (3 ) in a Shewhart control chart for individual measurements, enhancing the ability to detect small process shifts.
(4)
where,
: moving average range;
i: 2, 3, …, n observations,
X: variable under analysis.
When the process shows no special causes of variation of quality characteristics, the process is considered stable. Therefore, the aim of this study was to demonstrate the use of the Shewhart control chart for individual measures in assessing the stability of poultry litter AD.
MATERIAL AND METHODS
Experimental digester
The experiment was conducted at the Laboratory of Biological Reactors and the analyses were performed at the Laboratory of Environmental Sanitation, both in the State University of
Western Paraná (UNIOESTE), in Cascavel – PR, Brazil.
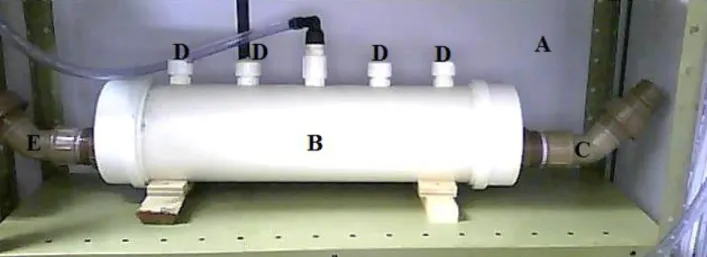
FIGURE 1. (A) Air-conditioned environment, (B) Digester, (C) Effluent input, (D) Sampling points and biogas output, (E) Effluent output.
AD was considered stable during the statistical process control by Shewhart control chart for individual measurements, with 2.5 standard deviations from the average, using MINITAB 15
software. Organic load consisted of 3 kg total volatile solids per m3 of digester working volume per
day (kg TVS m-3 day-1) and 10-day hydraulic retention time (HRT) in a semi-continuous reactor
system, being fed once a day. The AD was evaluated by the organic material removal efficiency,
which was measured by the amount of total volatile solids consumed (TVScons, %) and by the
biogas production, being expressed by the ratio between these variables (m3
biogas kg-1 TVScons-1).
Biogas volume was daily quantified by a gasometer; and the measurements were corrected for the Standard Temperature and Pressure (STP), 273.15 K and 101,325 Pa. Also, the VFA/ TA ratio of the effluent was determined weekly by the simple comparison with the results of Shewhart control chart on biogas production and on organic material removal efficiency in testing the stability of poultry litter AD.
The physicochemical parameters were analyzed by procedures described by APHA (2012) for TS and TVS (2540B method), and pH (4500B method). Yet the parameters volatile fatty acidity and total/ partial alkalinity were evaluated by methods described by JENKINS et al., (1983) and RIPLEY et. al. (1986).
Preliminary Statistical Analysis
An overview of data behavior can be obtained through preliminary analysis, calculating measures of central tendency, dispersion, asymmetry, and kurtosis.
The samples should be representative of the process; therefore, data independence and normality have to be checked. These are premises for the use of the Shewhart control chart. If these characteristics are unfulfilled, the results can be misleading due to possible false alarms (MONTGOMERY, 2009). Another premise for the use of this test is that data must be identically distributed.
Normality Test
Prior to the Shewhart control chart, data normality should be tested using methods such as Anderson-Darling, Ryan-Joiner, Shapiro-Wilk, and Kolmogorov-Smirnov. If the normal distribution is rejected, the data must be transformed for normalization, making use of transformation tools such as Box-Cox. Thereafter, transformed data should be tested again to verify normality.
Autocorrelation
Greater incidences of high-efficiency organic material removal and low biogas production were found in the analysis, being characterized by negative and positive skewness, respectively. Both variables were classified as leptokurtic since kurtosis values were lower than 0.263, i.e. a degree of flatness (sharpness) of the distribution lower than the reference degree of the Gauss curve. The organic material removal efficiency was uniform with a variation coefficient lower than 20%. On the contrary, the biogas production was non-uniform with a variation coefficient of 43.32%, being explained by the peaks of biogas production (positive skewness). The average standard deviation indicates the precision for the average estimates of both organic material removal efficiency and biogas production, being of 3.7 and 8.9%, respectively, and the sample standard deviation represents the range of sample variation.
TABLE 1. Descriptive statistics of the values of organic material removal efficiency (TVScons, %)
and biogas production (m3
biogas kg-1 TVScons-1).
Variables TVScons (%) m3biogas kg-1 TVScons-1
Average Standard Deviation 2.5 0.0245
Sample Standard Deviation 12.3 0.1198
Coefficient of Variation 18.2 43.32
Minimum 42.1 0.1199
Quartile 1 55.7 0.1877
Average 67.6 0.2766
Median 71.2 0.2653
Quartile 3 76.3 0.3437
Maximum 85.8 0.5369
Skewness -0.50 0.72
Kurtosis -0.86 -0.42
By the distribution analysis of quartile 1 and quartile 3 compared to the average, we may infer a normal distribution for both organic material removal efficiency and biogas production. However, according to MONTGOMERY (2009), even if there is a supposed normality, it must be checked when using the control chart. Thenceforth, normality was assessed by normality tests, being
confirmed by p-values, which should be greater than the significance level (α) for normal data, as in
Table 2. When one of the tests shows normality, the data distribution is already considered normal.
TABLE 2. Normality tests for organic material removal efficiency (TVScons, %) and biogas
production (m3
biogas kg-1 TVScons-1).
Normality Test (α = 5%) TVScons (%) m3biogas kg-1 TVScons-1
Anderson-Darling 0.097 0.083
Ryan-Joiner >0.100 >0.100
Data were normal according to the Anderson-Darling’s, Ryan-Joiner’s, and
Kolmogorov-Smirnov’s tests at 5% significance. MONTGOMERY (2009) stated that for more than
30 data per population, worries about sample distribution are discarded. As assured in the Central Limit Theorem (CLT), with an around 30 data, sample means tend to have a normal distribution. MONTGOMERY (2009) said that, in many times, the CLT in itself is a justification of the assumed normality.
However, MARTÍNEZ-ABRAÍN (2014) stated that the effect of a large-sized sample on distribution pattern depends both on sample size and on variability between populations. Therefore, researchers must explore beforehand the variance profiles of populations to assure they are within a safety zone (golden rule, n = 30), or whether sample size should be increased. There is no exact number of data to test for normality, the assessed values just have to show a normal distribution; however, using values equal to or greater than 30 help achieve to normality.
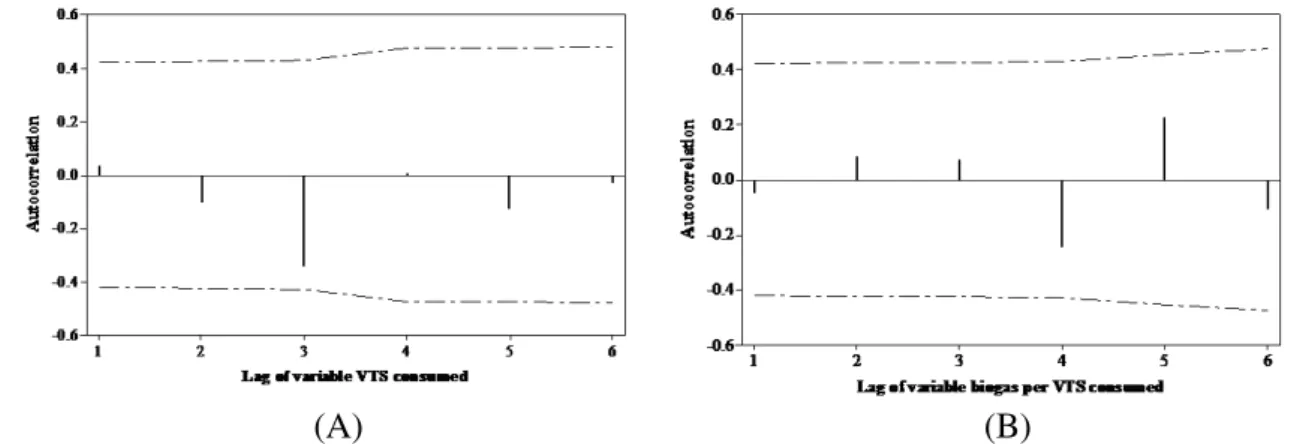
By contrast, MONTGOMERY (2009) also stated that even when normality assumption is violated until a moderate level, this control chart may still work fairly well. Nevertheless, if the independence of observations is unsupported, the results will be misleading, as many false alarms will occur by the positive correlation of the data. There was autocorrelation between the observed values by the sample autocorrelation function showed in Figures 2 (A) and 2 (B).
(A) (B)
FIGURE 2. Graph of the sample autocorrelation function for the variables: (A) organic material removal efficiency and (B) biogas production.
Since there were no correlation coefficients outside the limit of two standard deviations, the values of organic material removal efficiency and biogas production are independent. If there was autocorrelation between the observations, correlation structure should be removed from the time series that best identifies the process, such as ARIMA and SARIMA, being the analysis of the control chart through residuals.
The Shewhart control chart for individual measurements can be used for evaluation of AD stability since the observations satisfy the premises. The analyses of the Shewhart control chart and of the moving average range chart for the control of process stability depends on the desired accuracy for one or more criteria. The criteria 1, 2, 3 and 4 are suggested by the WESTERN ELECTRIC COMPANY (1956) and the others by MONTGOMERY (2009):
1. One or more points outside of the control limit (3 );
2. Two out of three consecutive points outside the two-sigma (2 ) warning limits but still within
the control limits;
3. Four out of five consecutive points beyond the one-sigma limits (1 );
all the criteria and the control limits were used as 2.5 from the average to obtain increased strictness in stability; however, only the criteria 1, 4, and 5 are frequently used in the statistical process control.
FIGURE 3. Shewhart control chart for individual measurements and moving average range chart as stability test for anaerobic digestion through organic material removal efficiency
(TVScons, %).
FIGURE 4. Shewhart control chart for individual measurements and moving average range chart as
stability test for anaerobic digestion through biogas production (m3
biogas kg-1 TVScons-1).
In this study, the experimental values of biogas production were similar to other studies, showing the test applicability. GANGAGNI RAO et al. (2013) evaluated poultry litter AD using
effluent reuse in a self-mixed anaerobic digester under high organic loading rate (4 kg TVS/m3/day
and 24 HRT days) and obtained 0.23 m3/ (kg TVS
added) of biogas production. COSTA et al. (2012)
studied poultry litter AD with 1% total solids in a batch system and achieved a methane (CH4)
production of 0.145 m3/ (kg TVS
added).
While AD was stabilized according to the Shewhart control chart, VFA/ TA ratio of the effluent output showed fluctuations (Table 3), hindering an accurate determination of the period of stability of the AD process by this variable. Furthermore, the effluent pH values remained near 7.0 during the period, which also impaired evaluation or monitoring of the AD by such variable, as there were no differences.
TABLE 3. VFA / TA ratio of anaerobic digestion under stabilized period.
Stabilized Period (days) 9 12 18 23
VFA/ TA 1.43 0.26 0.40 0.40
pH 7.10 7.23 7.09 7.10
The authors thank the CAPES for financial support and to the Graduate Program in Agricultural Engineering (PGEAGRI), State University of Western Paraná (UNIOESTE) for the infrastructural support.
REFERENCES
ABBAS, N.; ZAFAR, R. F.; RIAZ, M.; HUSSAIN, Z. Progressive mean control chart for
monitoring process location parameter. Quality and Reliability Engineering International,
Chichester, v. 29, n. 3, p. 357-367, 2013.
APHA. Standard methods for the examination of water and wastewater. 22nd ed. Washington,
DC: Ed. American Public Health Association, American Water Works Association, Water Environment Federation, 2012.
AYMERICH, E.; ESTEBAN-GUTIÉRREZ, M.; SANCHO, L. Analysis of the stability of
high-solids anaerobic digestion of agro-industrial waste and sewage sludge. Bioresource Technology, v.
144, p. 107–114, 2013. DOI: 10.1016/j.biortech.2013.06.074
COSTA, J. C.; BARBOSA, S. G.; ALVES, M. M.; SOUSA, D. Z. Thermochemical pre- and biological co-treatments to improve hydrolysis and methane production from poultry litter.
Bioresource Technology, v. 111, p. 141–147, 2012. DOI: 10.1016/j.biortech.2012.02.047
GANGAGNI RAO, A.; GANDU, B.; SANDHYA, K.; KRANTI, K.; AHUJA, S.; SWAMY, Y. V. Decentralized application of anaerobic digesters in small poultry farms: Performance analysis of high rate self-mixed anaerobic digester and conventional fixed dome anaerobic digester.
Bioresource Technology, Oxford, v. 144, p. 121–127, 2013. DOI: 10.1016/j.biortech.2013.06.076
HACHICHA, W.; GHORBEL, A. A survey of control-chart pattern-recognition literature
(1991-2010) based on a new conceptual classification scheme. Computers and Industrial Engineering,
New York, v. 63, n. 1, p. 204–222, 2012. DOI: 10.1016/j.cie.2012.03.002
HO, L. L.; QUININO, R. C. An attribute control chart for monitoring the variability of a process.
International Journal of Production Economics, Amsterdam, v. 145, p. 263-267, 2013.
JENKINS, S.R.; MORGAN, J.M.; SAWYER, C.L. Measuring anaerobic sludge digestion and
growth by a simple alkalimetric titration. Journal of Water Pollution Control Federation,
Washington, v.55, n.5, p. 448-453. 1983.
JOBLING PURSER, B. J.; THAI, S. M.; FRITZ, T.; ESTEVES, S. R.; DINDALE, R. M.; GUWY, A. J. An improved titration model reducing over estimation of total volatile fatty acids in anaerobic
digestion of energy crop, animal slurry and food waste. Water Research, Oxford, v. 61, n. 0, p.
162–170, 2014. Disponível em: <http://dx.doi.org/10.1016/j.watres.2014.05.020>.
MARTÍNEZ-ABRAÍN, A. Is the 'n = 30 rule of thumb' of ecological field studies reliable? A call
for greater attention to the variability in our data. Animal Biodiversity and Conservation,
MÉNDEZ-ACOSTA, H. O.; PALACIOS-RUIZ, B.; ALCARAZ-GONZÁLEZ, V.;
GONZÁLEZ-ÁLVAREZ, V.; GARCÍA-SANDOVAL, J. P. A robust control scheme to improve
the stability of anaerobic digestion processes. Journal of Process Control, New York, v. 20, n. 4,
p. 375–383, 2010. DOI: 10.1016/j.jprocont.2010.01.006
MINITAB®15. Minitab for Windows - version 15.0. Harrisburg, 2013.
MONTGOMERY, D. C. Introduction to statistical quality control. Arizona: John Wiley & Sons,
2009.
RIPLEY, L.E.; BOYLE, W. C.; CONVERSE, J. C. Improved alkalimetric monitoring for
anaerobic digestion of high-strength wastes. Journal Water Pollution Control Federation, New
York, v. 58, p. 406-411, 1986.
WESTERN ELECTRIC COMPANY. Statistical quality control handbook. Pennsylvania: Mack