Doi: https://doi.org/10.25186/cs.v15i.1654
Sensory quality prediction of coffee assessed by
physicochemical parameters and Multivariate model
Laricia Oliveira Cardoso Domingues1 , Aline de Oliveira Garcia1 ,
Marcia Miguel Castro Ferreira2 , Marcelo Antônio Morgano1
1Instituto de Tecnologia de Alimentos/ITAL, Centro de Ciência e Qualidade de Alimentos, Campinas, SP, Brasil 2Universidade Estadual de Campinas/UNICAMP, Instituto de Química, Campinas, SP, Brasil
Contact authors: [email protected], [email protected], [email protected], [email protected] Received in October 21, 2019 and approved in March 10, 2020
ABSTRACT
Beverages from roasted coffee can be classified according to their sensory quality into Gourmet, Superior, Traditional, and not recommended for supply coffees. However, the sensory evaluation of coffee has been questioned as it can induce a subjective bias, since the assessors may be influenced by psy-chological, physiological, and/or emotional factors. Therefore, the aim of this study was to develop multivariate models for predicting the overall quality of Gourmet, Superior, and Traditional coffees, based on the physical and physicochemical parameters. One hundred and eight ground roasted coffee sam-ples were evaluated for particle size, degree of roasting, histological identification, moisture, ash, aqueous extract, soluble solids (Brix), pH, and sensory profiling. All categories presented fine grinding. No significant differences were observed in the moisture content and soluble solids (Brix) of Gourmet, Superior, Traditional, not recommended for supply coffee samples. The Traditional and not recommended for supply presented higher levels of aqueous extract, ash, and pH. Light degree of roast and higher acidity values were observed with the increase in coffee quality grades. The results of the physical and physicochemical parameters and the principal component analysis allowed the separation of coffees into only two classes: high-quality (Gourmet and Superior) and low-quality (Traditional and not recommended). Furthermore, the one-class classification (OCC) method showed good sensitivity and was able to satisfactorily distinguish the Gourmet coffee samples from the other samples, in this way, this model can be used to corroborate but not replace the sensory analysis.
Key words: Coffee quality; sensory; chemometrics; OCC.
1 INTRODUCTION
Coffee is a plant originated from the African continent, belonging to the Rubiaceae family and the genus Coffea. Among the various species of the genus Coffea, the species Coffea arabica (Arabica coffee) and Coffea canephora (Conilon or Robusta coffee) have an economic relevance in the national and international market (Pimenta, 2003). These species have different genetic, chemical, and morphological characteristics, thus providing beverages with very distinct sensory profile (Illy; Viani, 2005). Arabica coffee produces a more delicate brew with a more intense flavor and aroma, while Conilon coffee has a lower acidity and a higher bitter taste (Kreuml et al., 2013).
Brazil is the world’s largest coffee producer and exporter, with a significant domestic consumption of coffee. From the seed to the cup, coffee beans go through a long chain of transformations, and several factors along the production chain can impact its final quality such as climate (Camargo, 2010), maturation and harvesting of beans (Giomo, 2012; Santos et al., 2018) and drying process (Arruda et al., 2012; Wintgens, 2009).
The roasted coffee market in Brazil offers the information of the coffee quality to the consumer divided in three classifications specified in the São Paulo state legislation. The São Paulo state Department of Agriculture and Supply
(SAA) have standardized the physicochemical and sensory evaluation of roasted coffee by the Resolutions 30 and 31 of 2007, and SAA 19 of 2010 which has established the identity and minimum quality parameters of roasted coffee beans and ground roasted coffee, classifying according to their sensory characteristics in Gourmet, Superior, Traditional and not recommended for supply coffees (São Paulo, 2007a; São Paulo, 2007b; São Paulo, 2010). Minas Gerais state have adopted similar criteria for evaluation of roasted coffee for consumption by decree 44.661 of 11/26/2007 (Minas Gerais, 2007). These criteria take into consideration the intrinsic quality of the coffee bean and the quality of the whole process from the crop to cup.
The sensory evaluation of coffee is performed using selected and trained assessors to express their olfactory and taste perception, which has been questioned due to their subjective bias since psychological, physiological, and emotional factors can compromise the accuracy of the evaluation (Brasil, 2010; Dutcosky, 2013; Ribeiro et al., 2012). Hence, a new analytical methodology to evaluate the chemical and physicochemical parameters or even new analytical parameters are required to contribute to the sensory evaluation of the final product.
Some authors have correlated data from chemical and physicochemical analyses of coffee beans with the sensory characteristics of the beverage. Those studies investigated the physicochemical parameters using different instrumental
techniques, such as: liquid and gas chromatography (Ribeiro et al., 2010; Bressanello et al., 2016), near infrared spectroscopy (NIR) (Santos et al., 2012; Tolessa et al., 2016) and sensory evaluation using the “cup test” method of the Specialty Coffee Association of America (SCAA) (Farah et al., 2006), which evaluates the beverage from raw coffee beans, subjected to a light roasting, which is quite different from the roasted and ground coffee commonly found on the market.
Studies on coffee properties have assessed a large number of variables and the application of chemometric methods allows to describe the data set globally, and providing relevant and reliable information about the product (Março et al., 2014).
Ribeiro et al. (2010) used Principal Component Analysis (PCA), a very popular exploratory analysis tool in chemometrics analyses (Abdi; Williams, 2010), to identify possible markers for the differentiation of the beverage quality considering its aroma, overall quality, and flavor. Arruda et al. (2012) investigated the effect of pre-processing on Catuaí amarelo coffee beans, and discriminated demucilated coffee from pulped natural coffee. Tavares et al. (2012) used PCA and partial least square (PLS) regression to detect ground roasted coffee adulteration with different percentages of fruit peel.
Data modeling is another method widely used in chemometrics. Modeling techniques, such as One-Class Classification (OCC), have been used to identify objects of a specific class within a set of evaluated objects (Oliveri, 2017; Rodionova; Oliveri; Pomerantsev, 2016). OCC was used by Zhang et al. (2015) to identify food adulterations. The authors built a classification model from the peanut oil fatty acid profile, which was able to identify adulterated oil samples. In another study, Gondim et al. (2017) investigated common adulterants in raw milk, and were able to distinguish adulterated from unadulterated samples.
The aim of this study was to develop multivariate models correlating the data of sensory evaluation of coffee brews with the physical and physicochemical parameters of ground roasted coffee, to predict the overall quality of Gourmet, Superior, and Traditional coffee samples.
2 MATERIAL AND METHODS 2.1 Sampling
One hundred and eight ground roasted coffee samples from the market were used in this study: 14 samples were classified as Gourmet (G), 35 as Superior (S), 40 as Traditional (T) and 19 samples as not recommended for supply (NR). The quality parameters were defined by the sensory panel rather than those originally informed by the manufacturers. After the sensory evaluation, the grounded coffees were subjected to physical (particle size, degree of roasting, and histological identification) and physicochemical (moisture, aqueous
extract, and ash contents) characterizations. The brews were characterized for soluble solids content (Brix) and pH.
2.2 Sensory evaluation
The coffee brew was prepared by percolating with filter paper using 50 g of ground roasted coffee and 500 ml of water at 92 °C. The samples were stored in thermal bottles for up to 1 hour and kept until the moment of analysis. The descriptive sensory analysis was performed by a selected and trained panel composed of five to nine assessors per session, using a 0-10cm unstructured scale to evaluate the coffee powder fragrance and the following coffee brew attributes: aroma, defects, acidity, bitterness, taste, aftertaste, astringency, and body. The overall quality was determined by a trained panel taking into consideration the attributes alone and the joint perception of aroma, flavor, and body of the beverage. (São Paulo, 2007a; São Paulo, 2007b; São Paulo, 2010).
The classification system of the Identity and Quality Technical Standards for roasted coffee beans and ground roasted coffee was used for the classification, as follows: Resolutions SAA 30 (Superior coffee) and 31 (Gourmet coffee) of 22/06/2007, and Resolution SAA 19 (Traditional Coffee) of 5/04/2010. These resolutions consider the range of 7.3 to 10.0 on the coffee quality grades as “Gourmet coffees”; between 6.0 and 7.2 as “Superior coffees”; between 4.5 and 5.9 as “Traditional Coffees”, and 4.5 the minimum overall quality grade recommended for supply (São Paulo, 2007a; São Paulo, 2007b; São Paulo, 2010).
2.3 Physical characterization
The particle size was determined in triplicate, based on the percentage retention in sieves # 12 (1.70 mm), 16 (1.18 mm), 20 (0.85 mm), 30 (0, 60 mm) and bottom (Lingle, 1996). The degree of roasting was determined in an Agtron Coffee Roast spectrophotometer, in triplicate, and the classification was performed using the Agtron/SCAA Roast Color Classification System, containing color disks ranging from 75-95 (light), 65-55 (medium) and 25-45 (dark). Direct readings obtained by spectrophotometer were used in this study, rather than the final degree of roast. Histological identification was performed as Gassner (1989).
2.4 Physicochemical characterization
The aqueous extract content was determined in triplicate according to Zenebon, Pascuet and Tiglea (2005). The ash content was determined in triplicate established by AOAC (2012). The moisture content was determined in duplicate detailed on ISO 11294 (1994) methodology. The pH of coffee brew was measured in a Marconi PA-200 pH meter, and the soluble solids content (Brix) was determined in a Bausch & Lomb bench refractometer applied by Zenebon, Pascuet and Tiglea (2005).
2.5 Multivariate data analysis
The means of the sensory, physical and physicochemical determinations for the four categories of coffee samples (powder and brew) studied (G, S, T, and NR) were analyzed by Analysis of Variance (Anova-Welch) and compared by the Games-Howell test.
PCA was used to evaluate the interactions between the physical and physicochemical parameters and the sensory evaluation. The one-class technique (OCC) was used to build a classification model, using a target class, consisting of Gourmet coffee samples, and an alternative class, consisting of Superior, Traditional, and not recommended for supply coffee samples. The Gourmet class model was built using two factors and the limit was plotted within 95% confidence (α = 0.05). Statistical and multivariate analyses were performed using XLSTAT (2018), (Addinsoft, 2018), Pirouette® 4.5 (Infometrix, 2011) and Matlab software.
3 RESULTS AND DISCUSSION 3.1 Sensory evaluation
Table 1 shows the results of the sensory attributes of 108 ground roasted coffees (powder) and their brews.
Significant differences were observed among the coffee brew samples for all attributes, except for acidity, with no differences between Gourmet and Superior coffees. Consequently, the final quality of coffees also differed among the samples.
Gourmet coffee exhibited strong intensity scores for the attributes studied, except for bitterness and astringency, which presented scores corresponding to weak intensity. The Superior coffees presented scores corresponding to moderate to high intensity, with the exception of the defects, bitterness
and astringency, which presented scores between weak and moderate intensity (São Paulo, 2007a; São Paulo, 2007b).
According to the descriptive terminology for the evaluation of the sensory quality of coffees, Gourmet coffee was characterized as a more aromatic powder, resembling a fresh coffee. The brew exhibited a characteristic coffee flavor, with a balance of acidity, bitterness, and astringency, with no defects. Consequently, these coffee samples had higher scores for overall quality and were considered as high-quality coffees (São Paulo, 2007b). As reported by Reis, Cunha and Carvalho (2011) coffees with Gourmet and Superior designation have higher sensory quality, as they are subjected to a careful selection of beans, as well as a greater control of the roasting process. Thus, the scores of the descriptive analysis of this study demonstrated the quality of the raw material used in coffee production.
Traditional coffee exhibited scores corresponding to moderate intensity for all attributes evaluated, except for acidity, which presented scores ranging from weak to moderate intensity.
Some coffee samples, identified as Traditional on their labels, presented scores ranging from weak and moderate intensity for the attributes powder fragrance, brew aroma, acidity, flavor, aftertaste, and body, and moderate to moderate-high intensity for bitterness and astringency (Table 1). These samples presented unsatisfactory characteristics, with a predominant taste of defective beans, with higher bitterness and astringency, thus they were classified as not recommended for supply coffees (NR) by trained panel. The Resolution SAA 19 allows the use of up to 20% defects for Traditional coffees production. However, the use of heterogeneous coffee beans (blend of defective and healthy beans) can compromise the coffee quality, resulting in coffees with undesirable characteristics (Pimenta, 2003).
Table 1: Sensory attributes of Gourmet (G), Superior (S), Traditional (T) and not recommended for supply (NR). Sensory Classification
Sensory attributes G S T NR
Powder fragrance 7.3 (0.1)a 6.3 (0.3)b 5,1 (0.3)c 4.5 (0.2)d
Aroma 7.2 (0.1)a 6.4 (0.3)b 4,8 (0.3)c 4.2 (0.2)d
Defects 1.4 (0.2)d 3.0 (0.5)c 5,0 (0.4)b 5.6 (0.2)a Acidity 4.0 (0.2)a 3.9 (0.3)a 2.8 (0.2)b 2.5 (0.1)c Bitterness 2.5 (0.1)d 3.9 (0.5)c 5.5 (0.4)b 6.0 (0.3)a
Flavor 7.3 (0.1)a 6.3 (0.3)b 4.7 (0.3)c 4.1 (0.2)d
Aftertaste 7.3 (0.1)a 6.3 (0.3)b 4.7 (0.3)c 4.1 (0.1)d Astringency 1.3 (0.2)d 3.2 (0.7)c 5.3 (0.5)b 5.6 (0.2)a
Body 6.7 (0.1)a 6.3 (0.2)b 5.1 (0.2)c 4.9 (0.2)d
Overall quality 7.4 (0.1)a 6.4 (0.3)b 4.9 (0.3)c 4.2 (0.2)d
Values expressed as mean (standard deviation) of coffees G = 14 samples; S = 35 samples; T = 40 samples and NR = 19 samples. For each attribute, the values (row) followed by different letters are statistically different at the 5% error (Games-Howell).
The sensory characteristics of the 108 coffee samples were evaluated by PCA showing a slight discrimination between samples and agreement with the results in Table 1. The separation between the categories was described in the first principal component, as can be seen in Figure 1 (PC1 versus PC2), which accounted for 97% of the total variance.
The Gourmet and Superior coffees, located to the left of the chart, were characterized for the attributes powder fragrance, brew aroma, acidity, flavor, aftertaste, and body. These samples were considered by the assessors as more aromatic and with a powder fragrance reminiscent of a fresh coffee. The brew exhibited a characteristic aroma of freshly brewed coffee and typical coffee flavor, with a balance of acidity, bitterness, and astringency, without the presence of defects.
Flavor defects is one of the attributes evaluated in this descriptive analysis focused on the sensory quality of coffees that is related to the defective beans (black, green, and burnt). The Traditional coffees and not recommended located on the right side were characterized by a lack of balance caused by intense bitterness and astringency, with a preponderant taste of defective beans.
It was also observed that Superior coffees S26, S32, S33, S34, and S35 were positioned close to Gourmet coffees, with less astringency in relation to their category.
3.2 Physical and physicochemical characterization
Regarding the coffee composition, all Gourmet coffee samples consisted of Arabica coffee. In the matter of the
Superior category, 20 samples were composed of Arabica coffee and 15 samples of Arabica and Conilon coffee blend. On the subject of the Traditional coffees, 25 samples were composed of Arabica coffee, while 15 samples consisted of Arabica and Conilon coffee blend. For the not recommended for supply, 13 samples were composed of Arabica coffee and 6 samples of Arabica and Conilon coffee blend. The results of the other physical and physicochemical parameters and the overall quality of the coffee samples are presented in Table 2.
Significant differences were observed for some physical and physicochemical parameters of coffees. No differences were observed for the samples subjected to sieves # 12, 16, and 20 all coffee classes. But with a significant difference for the retention in sieve # 30 and bottom sieve for the samples Gourmet, Superior, Traditional, and not recommended for supply coffees. Although all samples presented fine grinding (Table 2), the Traditional coffee presented a higher amount of powder retained at the bottom sieve, obtaining a higher average for this parameter (83.5%), thus it was considered with fine particle size, which was different from Gourmet coffee, which presented a lower average (64.1%). Superior and not recommended for supply coffees exhibited intermediate size at the bottom sieve (78.2% and 80.5%, respectively), with no significant differences from Gourmet and Traditional coffees.
Table 2 shows that the higher scores for overall quality were obtained for coffees with higher percentage of coarse particles that didn´t pass to the bottom, that is the particles were retained on the Sieve # 30. The particle size may
Figure 1: Loading and score plots of the first two principal components of the PCA carried out with the sensory data of the coffee samples. G = Gourmet coffee; S = Superior coffee; T = Traditional coffee and NR = not recommended for supply coffee.
influence the final quality of the brew, as it directly interferes with the brewing time and beverage extraction. A very fine grind makes the water longer in contact with the powder during the extraction process, resulting in a brew with a very bitter characteristic (Pimenta, 2003; Illy; Viani, 2005).
Regarding the degree of roasting, the Gourmet and Superior coffees obtained higher color grades (54.9 to 55.1, respectively), and were classified as medium / moderately light-roasted coffees, no significant differences between them. However, they differed significantly from the Traditional and not recommended coffee, which exhibited the lowest scores for the attribute color (44.9 and 43.6, respectively), being considered as moderately dark / dark-roasted coffees.
Coffee marketed in Brazil is usually a dark-roasted coffee (Pimenta, 2003). Not recommended for supply coffees, presenting unsatisfactory quality, showed the most intense degree of roasting (lower scores) (Table 2). It is known that the roasting intensity can greatly affect the sensory characteristics of the coffee and, consequently, its final quality. Although acidity is the predominant characteristic in light roasting, there is carbonization of some components with the increase in degree of roasting, leading to the formation of a burnt flavor in the coffee brew (Melo, 2004; Bhumiratana; Koushik; Chambers, 2011).
The Gourmet coffee obtained the lowest scores (23.9%) for aqueous extract, differing significantly from the Traditional (28.5%), Superior (26.3%) and not recommended coffees (27.7%). Spotting these findings, only the Gourmet coffee did not meet the requirements established by the Resolutions SAA
30 and 31(São Paulo, 2007) and SAA 19 (São Paulo, 2010) for the aqueous extract, which should be at least 25%.
Ground roasted coffee commonly has different degrees of roasting and grinding, consisting of different blends of coffee varieties. A higher aqueous extract content found in the Traditional coffees of this study may be due to their composition containing blends of coffee beans. Moura et al. (2007b) evaluated different Conilon and Arabica coffee blends, and found values from 27.87% to 28.89% for up to 50% replacement of Arabica to Conilon. In another study, Licciardi et al. (2005) evaluated commercial ground roasted coffees, and observed changes in the aqueous extract contents possibly due to the coffee harvesting and brewing time. The authors stated that the coffee brewed in January had aqueous extract content ranging from 24.38% to 29.73%, while those brewed in July ranged from 24.57% to 37.88%, i.e. the aqueous extract content has increased over the months.
The ash content of the samples ranged from 4.3% to 5.5% (Table 2). Gourmet an d Superior coffees had lower ash levels (4.3% and 4.4%, respectively), with no significant differences between them, w hich differed from Traditional and not recommended for supply coffees, and presented the highest ash levels (5.0% a n d 5.5%, respectively). Teixeira, Passos and Mendes (2016) found similar ash levels in different types of ground roasted coffees, with the lowest values also observed for the Gourmet coffee (4.0%). Gourmet coffee is composed only of Arabica coffee, which usually has lower ash content, while the other coffees are composed of blends, and
Table 2: Results of physical, physicochemical, and sensory parameters of Gourmet (G), Superior (S), Traditional (T) and not
recommended (NR) coffees.
Parameters Sensory Classification
G S T NR
Physical parameters
Sieve # 12 0.1 (0.1) 0.2 (0.2) 0.3 (0.3) 0.4 (0.7) Sieve # 16 0.7 (0.8) 0.6 (0.9) 0.4 (0.4) 0.4 (0.3) Sieve # 20 7.5 (7.1) 4.3 (4.9) 3.3 (5.2) 3.6 (1.5) Sieve # 30 27.9 (14.4)a 17.0 (10.5)ab 12.4 (5.9)b 15.5 (6.3)b Bottom sieve 64.1 (20.6)b 78.2 (14.0)ab 83.5 (9.5)a 80.5 (6.9)ab
Classification Fine Fine Fine Fine
Degree of roasting 54.9 (6.9)a 55.1 (6.1)a 44.9 (4.5)b 43.6 (7.6)b Disc # / Degree 65/ medium 75/ light 55/ medium 55/ medium Physicochemical
parameters
Aqueous extract (%) 23.9 (2.2)c 26.3 (3.2)b 28.5 (2.5)a 27.7 (2.6)b Ash (%) 4.3 (0.2)b 4.4 (0.3)b 5.0 (0.4)a 5.5 (0.7)a Moisture (%) 3.1 (1.3) 2.9 (1.0) 3.9 (1.9) 4.3 (1.8)
pH 5.1 (0.1)c 5.3 (0.3)b 5.6 (0.2)a 5.6 (0.3)a Soluble solids (Brix) 2.0 (0.4) 2.2 (0.4) 2.1 (0.4) 2.0 (0.4) Sensory Evaluation Overall quality 7.4 (0.1)a 6.4 (0.3)b 4.9 (0.3)c 4.2 (0.2)d
Results expressed as mean (standard deviation). For each parameter row values followed by different letters are statistically different at the 5% level (Games-Howell). Data without letters are not significantly different.
the inclusion of Conilon coffee can contribute to the increase in ash content (Conti et al. 2013; Teixeira; Passos; Mendes, 2016).
According to the Resolutions SAA 30 and 31 of 2007, and SAA 19 of 2010, the ash content of roasted coffee should not exceed 5%. High ash levels may also be due to the presence of impurities in the samples, indicating possible changes in production processes. In the present study, coffees with a high ash content presented unsatisfactory sensory quality, being classified as not recommended for supply coffees (São Paulo, 2007a; São Paulo, 2007b; São Paulo, 2010; Cecchi, 2002).
The pH of ground roasted coffee brews ranged from 5.1 to 5.6 (Table 2). Traditional and not recommended for supply coffees exhibited higher pH values (5.6 and 5.6) and differed significantly from Superior and Gourmet coffees (5.3 and 5.1, respectively) that were considered more acidic than the Traditional and not recommended for supply coffees by the trained panel (Table 1). Coffee acidity is an important attribute and is usually present in higher intensity in high-quality coffees. Mendonça, Pereira and Mendes (2005) reported that coffee acidity has been correlated with pH, thus pH determination can be used to evaluate coffee brew acidity.
The pH values observed for Gourmet and Superior coffees were within the range recommended by Fernandes et al. (2003), who reported that pH from 4.95 and 5.20 can provide a palatable brew without excess acidity or bitterness. The lower pH of Gourmet coffee can be due to its composition consisting of Arabica coffee, while the other samples correspond to coffee blends. Sunarharum, Williams and Smyth (2014) reported that Arabica coffee beans have pH between 4.85 and 5.15, which corroborates the results of this study. The authors also reported that Conilon coffee has a pH between 5.25 and 5.40.
The differences in pH values may be also due to the roasting process, once the coffees evaluated in this study were classified with different degr e es of roasting (Table 2). In a study to evaluate the effect of roasting on the characteristics of Arabica coffee, Moura et al. (2007a) observed that the more roasted the coffee beans, the higher the pH of the coffee brew was. The autho r s reported tha t higher pH due to the most intense roasting is due to the degradation of acids present in green coffee and those formed at the beginning of the roasting process.
3.3 Multivariate Analysis: Principal Component Analysis (PCA) and One-Class Classification (OCC)
PCA was used to evaluate the overall quality of the coffees according to their physical and physicochemical properties. Multivariate methods, such as PCA, allow simultaneous evaluation of all physical and physicochemical parameters studied (particle size, degree of roasting,
histological identification, moisture, ash, aqueous extract, soluble solids, and pH) facilitating the differentiation of the coffee categories (G, S, T, and NR).
The initial data matrix of 108 (samples) x 12 (physical and physicochemical parameters) was submitted to univariate analysis, aiming to investigate the relationship between each parameter and the overall quality of coffees. A correlation higher than 0.3 was observed between the physical and physicochemical parameters (sieve # 30, bottom sieve, degree of roasting, aqueous extract, ash, moisture, and pH) and the overall quality, thus they were selected for the next step of multivariate analysis. A new data matrix (108 x 7) was obtained and submitted to PCA. Due to the different orders of magnitude of the parameters studied, data were previously self-scaled, thus giving the same weight to all variables.
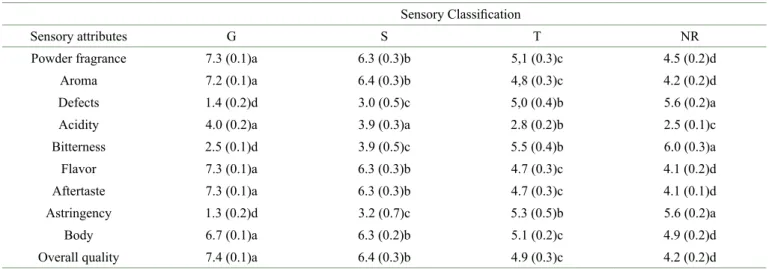
Figure 2 (A and B) represent the loading and score plots generated by the PCA. The first three principal components (PC) accounted for 80% the total variance of the data, and 44% of the total variance described by PC1, 22% by PC2, and 14% by PC3.
As the coffees are positioned in the first two dimensions (Figure 2A), it is observed that there is a dispersion of the samples throughout the plot, with no separation between samples according to the physicochemical parameters, while a tendency towards separation was observed along the PC1.
Gourmet and Superior coffees are located to the right of the graph and characterized by a coarse particle size, once they have higher retention at the sieve # 30 and a lighter roast when compared to the low-quality coffees, as well as a lower aqueous extract and less powder retained on bottom sieve. The PCA shown in Figure 2B (PC1 versus PC3) reinforces that the Gourmet coffee differed from the others, once they had a lower aqueous extract and a lower pH value.
In addition, as can be seen in Figure 2A, Traditional and not recommended for supply coffees are located to the left of the chart, opposite the high-quality coffees (Gourmet and Superior). These samples were characterized by having a fine particle size, with a higher amount of powder retained on bottom sieve, higher ash and moisture contents, and higher pH, besides a darker roast when compared to Gourmet and Superior coffees.
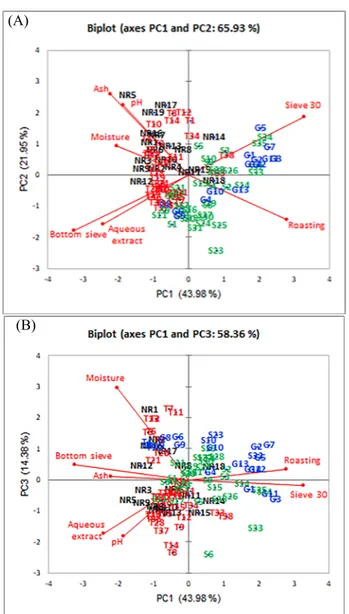
The PCA scores in the first two dimensions (66% of variance) created 95% confidence ellipses using the physical and physicochemical parameters to describe the behavior of each coffee category. The ellipses are shown in Figure 3.
In the matter of the confidence ellipses in Figure 3A, the variability of PCA scores was not satisfactory to discriminate the four coffee categories according to their physicochemical properties. There are no distances between the different categories, with an overlap of confidence ellipses, indicating that the variables do not have enough information to better discriminate the four categories.
that make up these two groups have similar behavior for the parameters evaluated. This result is probably due to the raw material used, once both Gourmet and Superior coffees undergo more careful processing (Pimenta, 2003; São Paulo, 2007a; São Paulo, 2007b; São Paulo, 2010).
Figure 2: (A) Loading and score plots of the PCA carried out with the results of the physical and physicochemical parameters of the coffees. G = Gourmet coffee; S = Superior coffee; T = Traditional coffee and NR = not recommended for supply coffee. Axes PC1 and PC2 refer to the principal components (B) Loading and score plots of the PCA carried out with the results of the physical and physicochemical parameters of the coffees. G = Gourmet coffee; S = Superior coffee; T = Traditional coffee and NR = not recommended for supply coffee. Axes PC1 and PC3 refer to the principal components.
To increase the discrimination between categories, the number of categories has been decreased. Thus, two categories were considered to recalculate the confidence ellipses (Figure 3B), as follows: coffees with scores ≤ 5.9 (Traditional and not recommended) and coffees with scores ≥ 6.0 (Gourmet and Superior). Thus, with 95% confidence, a group with Gourmet and Superior coffees (high-quality) and another group consisting of Traditional and not recommended for supply coffees (low-quality) was formed, once the samples
(A)
(B)
Figure 3: (A) 95% confidence ellipses for not recommended
(black), Traditional (red), Superior (green) and Gourmet (blue) coffees. (B) 95% confidence ellipses considering 2 classes:
Traditional and not recommended (red) and Gourmet and Superior coffees (blue).
(A)
(B)
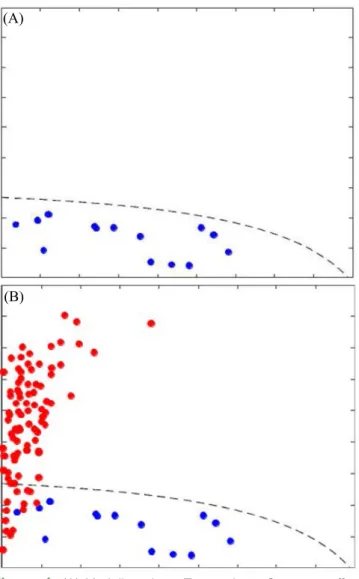
It was not possible to construct a model for coffee classification for all categories (G, S, T, and NR) due to the nature of data, thus an alternative data modeling method was used, the one-class classification (Rodionova; Oliveri; Pomerantsev, 2016). In this approach, a classification limit is defined for a target class, and then the constructed model is used to detect whether or not a new object belongs to that class (Pomerantsev; Rodionova, 2018).
The exploratory data analysis allowed observing that Gourmet coffee presented a more distinct behavior among the
samples, probably due to its composition consisting of Arabica beans, which usually undergo more careful processing and a lighter roasting (Table 2). These treatments provide greater coffee standardization, making the product more homogeneous, thus a good characterization of this group is possible even with few samples. Therefore, the Gourmet coffee was used as the target class in this study, and a model was built using its physicochemical properties to classify the other samples. The classification model is presented in Figure 4.
being outside the limit, which was not observed in this study, demonstrating 100% sensitivity of the model. The constructed model was then used to predict the samples belonging to the alternative class (Figure 4B).
Some samples of the alternative class were incorrectly classified as members of the target class. These samples, allocated within the 95% confidence interval, were considered Gourmet coffees despite not belonging to this category. Thus, 13 false positive rates were observed, as follows: 1 false positive not recommended for supply (NR); 2 false positive Traditional (T), and 10 false positive Superior (S). When evaluating the results of these samples, it was observed that their physicochemical parameters were similar to the target class. However, from a sensory point of view, these samples were classified into distinct quality categories (Superior, Traditional, and not recommended).
Similar to Gourmet coffee, the false positive NR presented a light roast and coarse particle size, as it exhibited a higher retention on sieve # 30. However, in the sensory evaluation, it presented weak intensity for the quality attributes powder fragrance, brew aroma, acidity, flavor, aftertaste, and body, as well as the preponderant taste of defective beans, with greater bitterness and astringency, thus it was classified as not recommended for supply coffee.
The false positive T had a light roast and a lower pH value, similar to Go u rmet coffees. From a sensory point of view, the sensory quality of Gourmet coffees were not affected, presenting moderate intensity scores for all attributes evaluated.
Concerning the 10 fa l se positives S, the samples were more similar to Gourmet coffees in the physical and physicochemical para m eters, once they presented coarse particle size, light roast, lower aqueous extract contents, and acidic pH. Of these samples, 4 were initially marketed as Gourmet coffees; w hereas the sensory quality was not perceived by the tra i ned staff, the samples received the Superior quality designation.
4 CONCLUSIONS
The physical and physicochemical parameters showed no difference amongst the categories for the grinding, the moisture content and soluble solids (Brix) analysis. The Traditional and not recommended for supply presented higher levels of aqueous extract, ash, and pH. Light degree of roast and higher acidity values were observed with the increase in coffee quality grades. The principal component analysis of these results showed a separation between the high-quality (Superior and Gourmet) and low-quality (Traditional and not recommended) coffee samples. Light roasting and coarser grinding (sieve # 30) were correlated with high-quality coffees, while the higher aqueous extract, higher ash content, and higher pH were correlated with low-quality coffees. (A)
(B)
Figure 4: (A) Modeling class. Target class: Gourmet coffee; Dotted line corresponds to α = 0.05. (B) Target class: Gourmet
coffee (blue); Alternative class: Superior, Traditional and not recommended for supply coffee samples (red).
An acceptance area was established around the target class and the classification was estimated with no information about the alternative class (Rodionova; Oliveri; Pomerantsev, 2016). Referring to Figure 4A, the dotted line was drawn with 95% confidence (α = 0.05), and it was possible to observe that all samples of the target class were within this limit. An alpha error of 0.05 was used, to prevent the target class from
Only the Gourmet category was discriminated using the physical and physicochemical parameters of the present study.
The one-class classification model developed using the physical and physicochemical parameters of the target class (14 Gourmet coffee samples) presented 100% sensitivity and was able to satisfactorily classify 81 out of 94 alternative coffee samples, in this way, this model can be used to corroborate but not replace the sensory analysis.
5 REFERENCES
ABDI, H.; WILLIAMS, L. J. Principal component
analysis. Wires Computational Statistics, 2(4):433-459, 2010.
ADDINSOFT. XLSTAT 2018. Available in: <https://www. xlstat.com/en/>. Access in 2018 out. 20.
ASSOCIATION OF OFFICIAL ANALYTICAL CHEMISTS - AOAC. Official methods of analysis. 19ª ed. 2012, 3000p.
ARRUDA, N. P. et al. Correlação entre precursores e voláteis em café arábica brasileiro processado pelas vias seca, semiúmida e úmida e discriminação através da análise por componentes principais. Química Nova, 35(10):2044-2051, 2012. BRASIL. Ministério da Agricultura. Instrução Normativa
n°16, de 24 de maio de 2010. Regulamento Técnico para o Café Torrado em Grão e para o Café Torra do e Moído.
Diário Oficial, Brasília, 2010. Available in: < http://
sistemasweb.agricultura.gov.br/sislegis/action/detalhaAto. thod=visualizarAtoPortalMapa&chave=794116535>. Access in: 2020 out. 17.
BHUMIRATANA, N.; KOUSHIK A.; CHAMBERS, E. Evolution of sensory aroma attributes from coffee beans to brewed coffee. LWT-Food Science and Technology, 44(10):2185-2192, 2011.
BRESSANELLO, D. et al. Coffee aroma: Chemometric comparison of the chemical information provided by three different samplings combined with GC–MS to describe the sensory properties in cup. Food Chemistry, 214:218-116, 2016.
CAMARGO, M. B. P. The impact of climatic variability and climate change on arabic coffee crop in
Brazil. Bragantia, 69(1):239-247, 2010.
CECCHI, H. M. Fundamentos teóricos e práticos em
análises de alimentos. Campinas: Unicamp. 2002, 212p,
CONTI, M. C. M. D. et al. Características físicas e químicas de cafés torrados e moídos exóticos e convencionais.
Boletim do Centro de Pesquisa de Processamento de Alimentos, 31(1):161-172, 2013.
DUTCOSKY, S. D. Análise sensorial de alimentos. PUC Press, 4ª ed. 2013, 531p.
FARAH, A. et al. Correlation between cup quality and chemical attributes of Brazilian coffee. Food Chemistry, 98(2):373-380, 2006.
FERNANDES, S. M. et al. Constituintes químicos e teor de extrato aquoso de cafés arábica (Coffea arabica L.) e conilon (Coffea canephora Pierre) torrados. Ciência e
Agrotecnologia, 27(5):1076-1081, 2003.
GASSNER, G. Mikroskopische untersuchung pflanzlicher
lebensmittel. Sttutgart, Gustav Fisher Verlag. 1989, 414p.
GIOMO, G. S. Uma boa pós-colheita é segredo de qualidade. p. 10, 2012. Available in: <https://www.yumpu.com/pt/ document/read/12627801/cafe-uma-boa-pos-colheita-e-segredo-da-qualidade>. Access in: April, 20, 2020. GONDIM, C. S. et al. Detection of several common
adulterants in raw milk by MID-infrared spectroscopy and one-class and multi-class multivariate strategies. Food
Chemistry, 230:68-75, 2017.
INFOMETRIX Inc.; Pirouette User Guide; Version 4.5, USA, 2011. Available in: <https://chemometrix.files.wordpress. com/2016/07/pirouette.pdf> Access: April, 17, 2020. ILLY, A.; VIANI, R. Espresso coffee: the science of quality.
2ª ed. London: Academic Press, 2005, 398p. INTERNATIONAL ORGANIZATION FOR
STANDARDIZATION -ISO. ISO 11294: Roasted ground coffee- Determination of moisture content. p.1-3, 1994. LICCIARDI, R. et al. avaliação físico-química de cafés
torrados e moídos, de diferentes marcas comerciais, da região sul de minas gerais. Ciência e Tecnologia de
Alimentos, 25(3):425-429, 2005.
LINGLE, T. R. A Systematic Guide to Coffee Preparation. Califórnia. Specialty Association of America. p.27-29, 1996.
KREUML, M. T. L. et al. Changes in sensory quality characteristics of coffee during storage. Food Science &
Nutrition, 1(4):267-272, 2013.
MARÇO, P. H. et al. Resolução multivariada de curvas com mínimos quadrados alternantes: descrição, funcionamento e aplicações. Química Nova, 37(9):1525-1532, 2014. MELO, W. L. B. A importância da informação sobre
do grau de torra do café e sua influência nas
características organolépticas da bebida. Comunicado
técnico. São Carlos: EMBRAPA, p.1-4, 2004. MENDONÇA, L. M. V. L.; PEREIRA, R. G. F. A.;
MENDES, A. N. G. Parâmetro bromatológicos de grãos crus e torrados de cultivares de café (Coffea arabica L.). Ciência e Tecnologia de Alimentos, 25(2):239-243, 2005.
MINAS GERAIS. Decreto nº 44.661, de 26 de novembro de 2007. Estabelece normas relativas à aquisição de café torrado em grão e torrado e moído pelos órgãos e entidades do Poder Executivo. Diário Oficial de Minas
Gerais, 27 nov. 2007. Available in: <https://www.abic.
com.br/institucional/legislacao/>. Access in: April, 17, 2020.
MOURA, S. C. S. R. et al. Influência dos parâmetros de torração nas características físicas, químicas e sensoriais do café arábica puro. Brazilian Journal of Food
Technology, 10(1):17-25, 2007a.
MOURA, S. C. S. R. et al. Avaliações físicas, químicas e sensoriais de blends de café arábica com café canephora (robusta). Brazilian Journal Food Technology, 10(4):271-277, 2007b.
OLIVERI, P. Class-modelling in food analytical chemistry: Development, sampling, optimisation and validation issues - A tutorial. Analytica Chimica Acta, 982:9-19, 2017.
PIMENTA, C. J. Qualidade de café. Lavras: Editora UFLA, 2003, 304p.
POMERANTSEV A. L.; RODIONOVA O. Y. Multiclass partial least squares discriminant analysis: Taking the right way- A critical tutorial. Jornal of Chemometrics, 32(8):e3030, 2018.
REIS, P. R.; CUNHA, R. L.; CARVALHO, R. G. Café
arábica do pós-colheita ao consumo. Lavras: EPAMIG,
v. 2, p.734, 2011.
RIBEIRO, J. S. et al. Uso de perfis cromatográficos de voláteis de cafés arábicas torrados para a diferenciação das amostras segundo o sabor, o aroma e a qualidade global da bebida. Química Nova, 33(9):1897-1904, 2010. RIBEIRO, J. S. et al. Prediction models for Arabica
coffee beverage quality based on aroma analyses and chemometrics. Talanta, 101:253-260, 2012.
RODIONOVA, O. Y.; OLIVERI, P.; POMERANTSEV, A. L. Rigorous and compliant approaches to
one-class one-classification. Chemometrics and Intelligent
Laboratory Systems, 159:89-96, 2016.
SANTOS, J. R. et al. Evaluation of green coffee beans quality using near infrared spectroscopy. A quantitative
approach Food Chemistry, 135(3):1828-1835, 2012.
SANTOS, R. A. S. et al. Análises de açúcares e ácidos clorogênicos de cafés colhidos em diferentes estádios de maturação e após o processamento. Brazilian Journal
Food Technology, 21:e2017163, 2018.
SÃO PAULO (Estado). Secretaria de Agricultura e Abastecimento. Resolução SAA n°30 de 22 de junho de 2007. Norma de padrões mínimos de qualidade para café torrado em grão e torrado e moído - característica especial: café superior. Diário Oficial do Estado de São
Paulo. Executivo Seção I, São Paulo, 117(117), 23 jun.
2007a.
SÃO PAULO (Estado). Secretaria de Agricultura e Abastecimento. Resolução SAA n°31 de 22 de junho de 2007. Norma de padrões mínimos de qualidade para café torrado em grão e torrado e moído - característica especial: café gourmet. Diário Oficial do Estado de São
Paulo. Executivo Seção I, São Paulo, 117(117), 23 jun.
2007b.
SÃO PAULO (Estado). Secretaria de Agricultura e
Abastecimento. Resolução SAA n°19 de 05 de abril de 2010. Norma de padrões mínimos de qualidade para café torrado em grão e torrado e moído – característica: café tradicional.
Diário Oficial do Estado de São Paulo. Executivo Seção I,
São Paulo, 120(66), 09 de abril de 2010.
SUNARHARUM, W. B.; WILLIAMS, D. J.; SMYTH, H. E. Complexity of coffee flavor: A compositional and sensory perspective. Food Research International, 62(1):315-325, 2014.
TAVARES, K. M. et al. Espectroscopia no infravermelho médio e análise sensorial aplicada à detecção de
adulteração de café torrado por adição de cascas de café.
Química Nova, 35(6):1164-1168, 2012.
TEIXEIRA, O. R.; PASSOS, F. R.; MENDES, F. Q. Qualidade físico-química e microscópica de 14 marcas comerciais de café torrado e moído. Coffee Science, 11(3):396-403, 2016.
MATLAB software; The MathWorks, Inc., Natick, MA, USA, 2017.
TOLESSA, K. et al. Prediction of specialty coffee cup quality based on near infrared spectraof green coffee beans.
WINTGENS, J. N. Coffee: Growing, processing, sustainable production. A guidebook for growers,
processors, traders, and researchers. 2ª ed. 2009.
983p.
ZHANG, L. et al. One-class classification based authentication of peanut oils by fatty acid profiles.
Royal Society of Chemistry Advances, 5(103):1-14,
2015.
ZENEBON, O.; PASCUET, N. S.; TIGLEA P. Métodos
físico-químicos para análise de alimentos. 4ª ed.,
Brasília: Ministério da Saúde/ANVISA; São Paulo: Instituto Adolfo Lutz, 2005, 1020p.