Cristiana Maria Rodrigues de Azevedo
Mestre em Engenharia Química
Novel approaches for effective design
of controlled drug release systems,
employing hybrid semi-parametric
mathematical systems
Dissertação para obtenção do Grau de Doutor em Engenharia Bioquímica
Orientador: Rui Manuel Freitas Oliveira, Professor Associado, FCT-UNL Co-orientador: Moritz von Stosch, .
Lecturer, CEAM-Newcastle University
Juri:
Presidente: Doutor João Paulo Crespo, Professor Catedrático, FCT-UNL Arguentes: Doutora Helena Isabel Fialho Florindo Roque Ferreira, Professora Auxiliar da Faculdade de Farmácia da Universidade de Lisboa
Doutora Pétia Georgieva, Professora Auxiliar da Universidade de Aveiro
Novel approaches for effective design of controlled drug release systems, employing
hybrid semi-parametric mathematical systems
Copyright © Cristiana Maria Rodrigues de Azevedo, Faculdade de Ciências e Tecnologia, Universidade Nova de Lisboa.
A Faculdade de Ciências e Tecnologia e a Universidade Nova de Lisboa têm o direito, perpétuo e sem limites geográficos, de arquivar e publicar esta dissertação através de
exemplares impressos reproduzidos em papel ou de forma digital, ou por qualquer outro meio conhecido ou que venha a ser inventado, e de a divulgar através de repositórios científicos e de admitir a sua cópia e distribuição com objectivos educacionais ou de investigação, não comerciais, desde que seja dado crédito ao autor e editor.
"
In God we trust. All others must bring data
."
Acknowledgments
First and foremost, I would like to thank my supervisors Prof. Rui Oliveira and Dr. Moritz von Stosch for supporting my Ph. D. application and all the guidance throughout the last years.
I would like to thank Prof. Maria Cardoso for introducing me to the subject of controlled drug release and the access to her group experimental work.
Finaly, I would like to express my gratitude to Prof. Véronique Préat for accepting me in her research group in UCL.
Resumo
A libertação controlada de um fármaco do interior de sistemas poliméricos, durante um período de
tempo pré-definido é referido como Controlled Drug Release (CDR). Um dos maiores desafios para
uma libertação continua e reproduzível é a libertação não-intencional de uma grande quantidade de
fármaco (burst) que ocorre nas primeiras horas/dias de experiência, podendo ter efeitos nocivos para o
paciente. O efeito burst ocorre com frequência quer com pequenas moléculas, quer com proteínas, quer
com micro- e nanopartículas. O design de partículas pode, em princípio, ser usado para controlar a
quantidade de burst, mas até ao momento, nenhum método sistemático está disponível e o design de
partículas é regido por metodologias empíricas baseada em tentativa e erro. Uma das razões prende-se
com o facto que os modelos disponíveis para o burst não incluirem explicitamente a relação entre
propriedades físico-químicas das partículas no perfil de libertação do fármaco.
Esta tese propõe novas metodologias para o design de maneira racional de micro- e nanopartículas de
PLGA encapsulando fármacos. Está dividido em três partes principais. Em primeiro lugar, é realizada
uma análise quantitativa dos factores físico-químicos que influenciam a quantidade e a cinética do
burst usando métodos de mínimos quadrados parciais (PLS) e de árvores de decisão. Os fatores com o
maior impacto são selecionados para os exercícios de modelação subsequentes. Em seguida,
desenvolve-se um modelo híbrido agregado de bootstrap, que pode prever com sucesso o burst de
fármacos de um conjunto independente de experiências de CDR. Por fim, um novo método design
racional é apresentado para a optimização das características de formulação de nanopartículas de
PLGA encapsulando proteínas. O método é aplicado com sucesso para optimizar a partícula para
proteína “teste”, α-quimiotripsina, produzindo um perfil de libertação próximo ao desejado. O método
também pode ajudar a avaliar a semelhança da proteína “teste” com uma proteína “alvo” em termos de
suas semelhanças no comportamento de liberação de drogas durante o burst.
Esta tese propõe o primeiro método racional de design de partículas de PLGA que requer apenas
especificações do fármaco e do perfil de libertação durante o burst. Prevê-se que a aplicação do método
reduza significativamente o tempo de desenvolvimento de partículas de PLGA. Com a quantidade
crescente de dados de libertação controlada disponíveis, a capacidade preditiva desta metodologia pode
ser sistematicamente melhorada, tornando-se uma ferramenta cada vez mais confiável. O método usa
uma estratégia de modelação híbrida que descreve o perfil de libertação da droga ao longo do tempo
em função das escolhas de design, sendo o primeiro do seu tipo na modelação de libertação de
fármacos.
Palavras-chave
Abstract
The controlled release of a drug from a carrier into a medium over a defined period of time is referred to as Controlled Drug Release (CDR). A major challenge for a sustainable and reproducible CDR is the unintentional initial burst, which occurs in the first hours/days of immersion and during which a large amount of drug is released. Also it can have deleterious effects on the host. Burst release happens with both small drug molecules and large proteins and for both drug-loaded PLGA micro- and nanoparticles. Particle design can, in principal, be used to control the amount of burst but no systematic methods are to date available and the design process is governed by trial and error. One reason might be that the available models for burst release do not explicitly account for the particle design parameters.
This thesis proposes novel methodologies that allow for rational design of drug-loaded PLGA micro- and nanoparticles. It is divided in three main parts. Firstly, a quantitative analysis of the physicochemical factors that impact on the amount of burst release and the burst release rate using partial least squares and decision tree methods is performed. The factors with the greatest impact are selected for the subsequent modelling activities. Next, a bootstrap aggregated hybrid model (HM) is developed, which can successfully predict the cumulative drug release of an independent set of CDR experiments. Lastly, a new rational design method is presented for the optimization of the formulation characteristics of protein-loaded PLGA nanoparticles. The method is successfully applied to design the carrier of a mock-protein, α -chymotrypsin, yielding a close to desired release profile. The method can also help to judge upon the similarity of the mock protein with a target protein in terms of their similarities in burst release behavior.
This thesis proposes the first rational PLGA particle design method requiring only the specification of the drug and the desired burst release profile. The application of the method can be expected to significantly reduce the time for PLGA particle development. With the increasing availability of CDR data the predictive power of the method can be further improved towards a systematic and reliable tool. The engine of the method is the hybrid model which links the release profile to the design parameters and is the first of its kind in drug release modeling.
Keywords
Table of Contents
Chapter 1 - Introduction ... 1
1.1. Motivation- Burst in controlled drug release ... 2
1.2. Thesis objectives ... 6
1.3. Thesis outline ... 6
1.4. Thesis main achievements ... 8
1.5. References ... 9
Chapter 2 - PLGA, Burst and Controlled Drug Release Modeling: An introduction ... 15
2.1. Introduction to Controlled release ... 16
2.2. The importance of PLGA ... 16
2.3. PEGylation of particles ... 19
2.3.1. Drawbacks of PEGylation ... 20
2.4. Release mechanism related to the CDR from PLGA particles ... 20
2.5. Influences of particle design and synthesis choices on CDR ... 22
2.6. Burst ... 22
2.7. CDR modeling for PLGA particles ... 24
2.7.1. Parameter Identification ... 27
2.7.2. How to model burst ... 29
2.8. Hybrid modeling ... 31
2.8.1. Basic hybrid modeling structures ... 31
2.8.2. Application of hybrid modeling in other disciplines ... 31
2.8.3. Benefits of hybrid modeling and its application to CDR ... 32
References ... 34
Chapter 3 - Modeling of the burst release from PLGA micro- and nanoparticles as function of physicochemical parameters and formulation characteristics ... 45
3.1. Introduction ... 48
3.2. Materials and methods ... 50
3.2.1. Data assembly: Material properties, Drug Carrier Design and Experimental Conditions ... 50
3.2.2. Release profiles extraction ... 53
3.2.3. Modeling of the drug release profile ... 53
3.2.4. Data Pre-treatment ... 53
3.2.5. Regression Models ... 54
3.2.6. Criteria for Model Performance and Input Importance ... 55
3.3. Results and Discussion ... 57
3.3.1. Burst release modeling – Identification of drug release model parameters ... 57
3.3.3. Analysis of the impact Factors ... 60
3.3.4. Discussion of the impact factors ... 65
3.4. Exploiting the decision tree model for drug-carrier design ... 74
3.5. Conclusions ... 76
3.6. Supplementary Material ... 77
3.7. References ... 79
Chapter 4 - Hybrid model-based prediction of burst release as function of encapsulation method, carrier properties and drug properties: the case of PLGA micro- and nanoparticles . 89 4.1. Introduction ... 92
4.2. Materials and methods ... 94
4.2.1. A hybrid semi-parametric drug release model ... 94
4.2.2. Data ... 94
4.2.3. Parameter Identification and Structure Discrimination ... 95
4.2.4. Model Structure Discrimination ... 96
4.2.5. Criterion for Model Performance ... 96
4.3. Results and Discussion ... 97
4.3.1. Model Structure Discrimination ... 97
4.3.2. Bootstrap Aggregated Hybrid Model Performance ... 98
4.3.3. Analysis example of the impact of particle synthesis parameters on drug release profiles ... 99
4.4. Conclusions ... 101
4.5. Supplementary Material ... 101
4.6. References ... 104
Chapter 5 - A methodology for rational PLGA carrier design minimizing burst release with application to Activin A and α-chymotrypsin ... 111
5.1. Introduction ... 113
5.2. Material and Methods ... 114
5.2.1. A rational particle design approach ... 114
5.2.2. Hybrid Model ... 115
5.2.3. Optimization problem ... 115
5.3. Results and Discussion ... 116
5.3.1. Case Study 1: Mock Protein ... 116
5.3.2. Optimization of the carrier system design ... 117
5.3.3. Analysis of the variations in the trade-off parameter λ ... 117
5.3.4. Sensitivity results ... 118
5.3.5. Case Study 2: Activin A ... 121
5.4. Conclusions ... 123
Chapter 6 - Conclusions and Future Work ... 127
6.1. General conclusions ... 128
6.2. Future Work ... 131
List of Figures
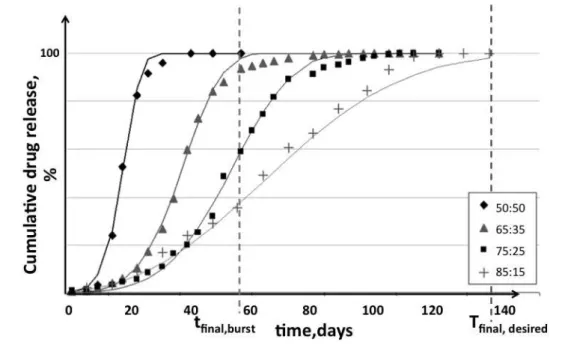
Figure 1-1. Ideal drug release concentration profile achieved with controlled drug release systems (dark blue) compared with drug concentration profile as a result of the intake of series of multiple doses of a traditional drug-delivery system (red). ... 3 Figure 1-2. Microparticles and nanosystems for drug delivery. A comparison to scale. ... 4 Figure 1-3.Cumulative drug release profiles from PLGA microparticles with different
monomer ratios. Particles experiencing an intense burst have a reduced time of actuation. Legend: 85:15 PLGA means 85% of the copolymer is lactic acid and 15% is glycolic acid. Adapted from [42]. ... 5 Figure 2-1. (a) Structure of PLGA; x= lactic acid units, y=glycolic acid units; (b) Structure of Polyethylene glycol (PEG); n= number of monomers ... 17 Figure 2-2. Schematic (a) drug-loaded PLGA particle; (b) PEGylated PLGA nanoparticle. .. 19 Figure 2-3. A scheme of physicochemical processes taking place within PLGA matrices,
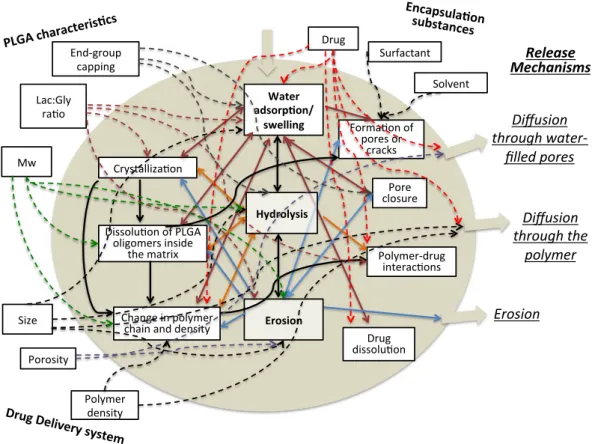
leading to drug release. The influence of processes on drug release and on other processes is illustrated by arrows. Note that some arrows point in both directions. Adapted from [52]. ... 21 Figure 2-4. Model of Heller and Baker [72] describing drug release from thin biodegradable
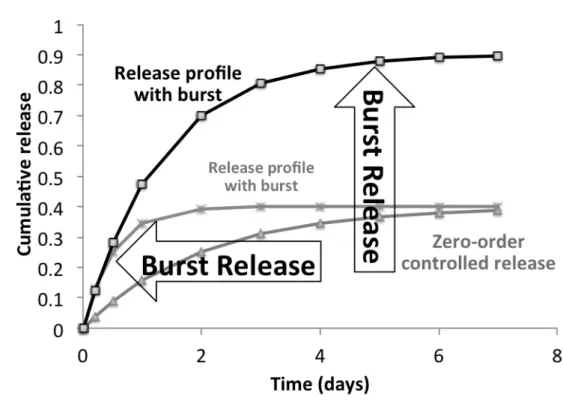
polymers particles undergoing bulk erosion (squares), and purely diffusion-controlled release kinetics calculated using the classical Higuchi model [73] (diamonds). Adapted from [51]. ... 22 Figure 2-5. Theoretical drug concentration profile in an ointment, in contact with a medium in
perfect sink conditions at time t (solid line) and at time t+dt (dashed line). Variables h represents the distance of the wave front, separating three different concentrations in two boundaries (right to left) ointment free of non-dissolved drug excess (sink conditions) with ointment with non-dissolved drug excess and at left from the ointment interface at time t. dh is the distance the wave moves inwards during the time interval dt.. [Adapted from [93,94]. ... 25 Figure 2-6. Schematic representation of the ideal controlled drug release compared with
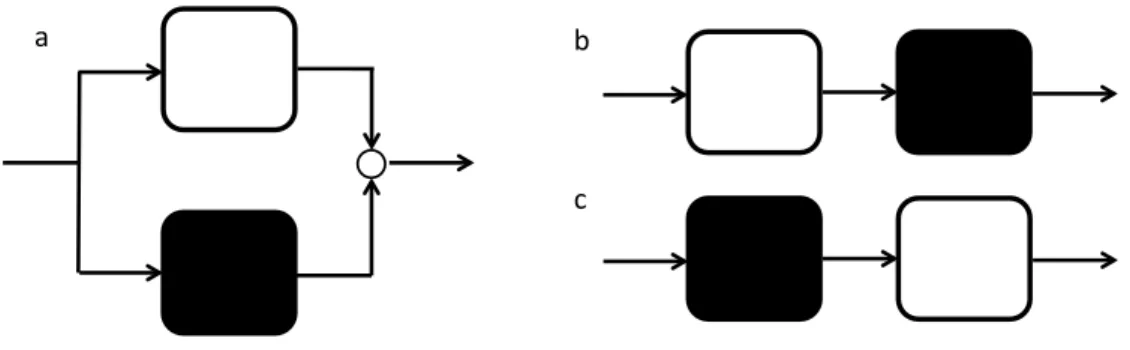
initial burst release. ... 29 Figure 2-7. Schematic sketch of a) parallel and b) and c) serial hybrid model structures.
Mechanistic and data-driven models are represented by a white and a black box
respectively. ... 31 Figure 3-1. Graphical Abstract ... 47 Figure 3-2: Example of cumulative release of ellagic acid from PLGA nanoparticles during
burst [47]. Black circles: experimental data, continuous line, fit with Corrigan model (equation 1). ... 57 Figure 3-3: Values and standard deviations of FB,in (left) and kb (right) for different
experiments. Blue crosses: training set, red circles: test set, black vertical lines: standard deviation. ... 58 Figure 3-4: Predicted versus experimental values for FB,in (left) and kb (right) obtained with
PLS regression. Blue squares: training set, red circles: test set. Standard deviation of predictions obtained with cross-validation represented by vertical bars. ... 59 Figure 3-5: Comparison of predicted and experimental values for decision tree regression for
Figure 3-6: Importance magnitude of inputs for modeling of (a) FB,in and (b) kb using decision tree regressions, across 75 fold cross-validation iterations. ... 62 Figure 3-7: VIP values of PLS regressions inputs for FB,in (top) and kb (bottom). Blue bars
correspond to positive βj values, while for negative βj the bars are red. A positive or negative value of βjsignifies that the corresponding variable has a positive (+) or negative (-) impact on the response. ... 63 Figure 3-8: Regression tree graph for FB,in obtained with the training set and a maximum
number of 15 splits. FB,in values are in percentage (%) and italic. Legend: Cno=number
of carbon atoms in the drug. ... 63 Figure 3-9: Regression tree graph for kb obtained with the training set and a maximum
number of 15 splits. kb values are in days-1 and italic. Legend: Ono=number of oxygen atoms in the drug. ... 64 Figure 4-1. Graphical Abstract ... 91 Figure 4-2: Bootstrap aggregated hybrid model prediction of drug release values (Q) versus
measured values of cumulative drug release (Qmeasured). Red crosses: training set, green circles: test set. ... 99 Figure 4-3: Comparison of predicted (continuous lines) and experimental values (markers) of
cumulative burst release of ellagic acid along time [45]. Data shown in red are part of the training set, and data shown in green are part of the test set. ... 100 Figure 5-1.Schematic representation of the PLGA nanoparticle design approach, given a
desired initial burst release profile and drug. ... 114 Figure 5-2. Cumulative desired release profile, Qdes (X), predicted release profile Qpred
(continuous line) and the respective standard deviations of the ten hybrid models (dashed lines) with:λ=0, triangles; λ=0.1, diamonds;λ=0.2, circles;λ=0.5, squares. Standard
deviations of the simulation with λ=0 are mostly outside of the plotted region (going
towards -0.6 and 1.4) and are not shown to provide a higher resolution of the region of interest. ... 117 Figure 5-3: Surface plot of the bootstrap aggregated hybrid model predictions of the
cumulative burst release versus input variable variations and time. ... 121 Figure 5-4. Predictive cumulative burst release simulated by aggregated hybrid model with
restrictions: a) nanoparticle size and b) initial drug loading. ... 121 Figure 5-5. Averaged cumulative predicted burst release profile, Qpred for α-chymotrypsin
List of Tables
Table 2-1. FDA-Approved Drug Delivery Products Using PLGA Polymers and Under
Development ... 17
Table 2-2. Examples of burst release from PLGA micro and nanoparticles observed in published work. ... 23
Table 2-3. Mathematical models describing drug release from spherical degradable micro and nanoparticles. ... 26
Table 3-1:Drug names and source of data utilized in this study ... 50
Table 3-2: Description of variables of input for regression models ... 52
Table 3-3. Molecular descriptors and formulation characteristics used in the decision trees for a test experiment with Risperdizone. Experimental (exp) and decision trees predicted (pred) values of FB,in and kb. ... 75
Table 3-4. Description of variables of input for regression models. ... 77
Table 4-1: Selection of the best performing network structures for FB,in and kb in terms of AICc calculated for the training-validation data for each of the ten partitions. The MSE performance is also shown. ... 97
Table 4-2. Drug names and source of data utilized in this study ... 101
Table 5-1. Activin A and α-chymotrypsin molecular descriptors values. ... 117
Table 5-2. Formulation characteristics corresponding to different λ values. ... 118
List of Abbreviations, Symbols and Nomenclature
β PLS regression coefficient
𝜖 PLS regression residual factor
AIC Akaike Information Criterion
𝐴𝐼𝐶𝑐 𝐴𝐼𝐶 with second order bias correction
ANN Artificial neural networks
CDR Controlled drug release
DCM Dichloromethane
EMA European Medicines Agency
FDA Food and Drug Administration
𝐹!,!" Fractional amount of drug release during burst phase
𝑘! First order rate constant associated with burst kinetics
MSE Mean Squared Error Mw Molecular weight
PLGA poly lactic-co-glycolic acid PLS Partial Least Square PEG Poly(ethylene glycol) PVA Polyvinyl alcohol
Q Fractional cumulative amount of drug release SDS Sodium dodecyl sulfate
TPGS d-α-Tocopheryl polyethylene glycol 1000 succinate (vitamin E) VIP Variable importance on projection
1.1. Motivation- Burst in controlled drug release
Drugs do not deliver themselves [1]. A pharmaceutical entity is only as efficient as its carrier. A delivery system is necessary to ensure that a pharmaceutical entity can reach its target. A good delivery system assures that the drug is delivered within pre determined therapeutic rates, and it allows for a sustained and controlled release to ensure therapeutic application, for the duration of the treatment time.
The delivery of a therapeutic agent drug from a delivery system at a specific rate over a determined period of time is referred to as controlled drug release (CDR).
CDR systems have encountered increased pharmaceutical application, because:
i) they allow achieving and maintaining an optimal drug dosage in the body throughout the duration of the treatment, avoiding the undesirable “seesaw” effect of traditional drug administering systems such as tablets [2]. If there are limits of concentrations, i.e., a minimum level of efficacy or a maximum safe concentration, oscillations outside this range (seesaw effect) can result in a waste of material or in
concentrations toxic for the host [3];
ii) they have a higher selectivity of a drug to a site;
iii) iii) less frequent dosages are needed, leading to a higher rate of patient compliance [4];
iv) they exhibit lower adverse side effects [2].
Figure 1-1. Ideal drug release concentration profile achieved with controlled drug release systems (dark blue) compared with drug concentration profile as a result of the intake of series of multiple doses of a traditional drug-delivery system (red).
Hence, the field of therapeutics based on degradable, micro- and nanoparticles, which could allow for a sustained drug delivery in the host, has been booming since the 1980s [5][6]. Nano and micro controlled drug release systems have been studied widely [7], with over 4600 publications in 2016 and this particular type of controlled release systems has found
increasing pharmaceutical application.
Miniaturization from micro- to nanoparticles (<1 µm) brought additional advantages [8]. Nanoparticles fall into a size scale, similar to proteins and other large molecular compounds, taking advantages of the membrane transport phenomena naturally occurring [9][10] . The ability to penetrate the cell membranes allows nanoparticles to interact on cell surface receptors. A distinct difference on the behavior of micro- and nanoparticles is that the later have a large surface area to volume ratio leading to more exposed surface and can result in a faster release [11,12].
Figure 1-2. Microparticles and nanosystems for drug delivery. A comparison to scale.
Amongst the biodegradable materials developed to formulate micro- and nanocarriers (Figure 1-2) poly lactic-co-glycolic acid (PLGA) has shown immense potential [15–17]. PLGA is most popular among the various available biodegradable polymers because:
i) it is biodegradability and biocompatibility;
ii) it has FDA and EMA approval for several drug delivery systems (see Table 2-1); iii) it has the ability to form systems encapsulating various types of drugs e.g.,
hydrophilic or hydrophobic small molecules or proteins, utilizing different encapsulating methods [18,19];
iv) it has been extensively studied as delivery vehicle for drugs, proteins and various other macromolecules such as DNA, RNA and peptides [20,21];
v) PLGA systems protect the drug from degradation [22]; vi) it allows for a sustained release [23]; and
vii) it offers the possibility to perform surface modifications enhancing the particle stealthiness and/or better interaction with biological materials [24–28]. Further, PLGA can be tailor made to serve the mechanical properties necessary [29][14]. For more on PLGA surface modification, see section 2.3.
(m) 10-4 10-5 10-6 10-7 10-8 3.10-9 10-9 10-10
Microscale Bacteria Human hair micrometer Nanoscale Virus nanometer 5 silicon atoms Micelles 10-80nm Liposome 80-300nm Dendrimer 10-100 nm Polymeric nanoparticles 10-500nm Polymeric microparticles
1-500 μm
Nanosystems for drug delivery microsystems for drug delivery Polymeric microcapsules
10-500 μm
The greatest challenge for a sustained and controlled drug release in PLGA particles, is the typically observed rapid drug release during the first hours of immersion of PLGA particles, referred to as burst [30–37]. The burst release is very frequent in both PLGA micro and nanoparticles, and affects both small drug molecules and large molecules e.g., proteins [38,39] (see Table 2-2 for examples of burst release from PLGA micro and nanoparticles). An intense burst release often leads to a decrease in the time of therapeutic actuation and high initial drug concentrations in the host blood plasma can translate into deleterious effects to the host [38]. Moreover, the burst release reduces predictability and reproducibility, which are prerequisites for a safe controlled drug release system. Consider for instance the case of 40% burst release (common value) of the total drug loading in the first days (Table 2-2) for duration of FDA approved therapeutics with drug-loaded PLGA particles), which can cut short the treatment time by more than 50% of the total possible time (Figure 1-3), making it necessary to resort to extra dosages, such being extremely inefficient at a therapeutic level. When a typical pack for a one-month course of therapy of drug-loaded PLGA particles is around 1,000-10,000 USD [40,41] (full price for cash paying customers) the burst release is also a large problem from an economic standpoint.
Figure 1-3.Cumulative drug release profiles from PLGA microparticles with different monomer ratios. Particles experiencing an intense burst have a reduced time of actuation. Legend: 85:15 PLGA means 85% of the copolymer is lactic acid and 15% is glycolic acid. Adapted from [42].
Though widely observed, little consensus exist on the mechanisms controlling the burst release. Most mathematical models ignore the burst phase due to lack of mechanistic understanding [38]. The rare cases of burst release being incorporated in release models are approximations to power laws equations, where in order to account for the burst a parameter
Corrigan and Li [43] developed a empirical model describing the drug release from PLGA nanoparticles (equation 8), identifying two distinct phases, first a burst release, and a second phase where the remaining drug entrapped in the polymer matrix escaped at a different release rate from the burst release. (See section 2.7.2 for more on modeling of burst release.) Still these models are specific for the drug-carrier system they have been developed for, such that for each new system, new release experiments need to be undertaken in order to identify the parameters of the models. Hence, the so far developed mathematical models are of limited usability for the prediction of the drug release of a new drug-carrier system and for the designing of novel more efficient carriers for a specific drug. Thus the design of the optimal biodegradable carrier for a drug is still dominated by heuristics, rules of thumb and a great deal of trial and error experimentation [9,44].
1.2. Thesis objectives
It is the overall aim of this work to develop a model based rational PLGA carrier design framework, in which the model describes the impact of design choices on the control drug release. The work is focused on in vitro studies, which are less complex and more
reproducible than in vivo conditions [45,46]. Several studies that compare in vivo-in vitro
release experiments and polymer degradation show that the result are comparable [47–49]. The work develops into three main parts:
i. Investigate and quantify the impact factors (molecular physicochemical properties of the drug and carrier system) that control the macroscopic behavior of burst during CDR;
ii. Model the burst release of different drug-loaded PLGA particles as functions of the identified factors; and
iii. Develop a framework that exploits the model to make design choices for new drugs and predefined, desired release profiles.
.
1.3. Thesis outline
The remainder of this thesis comprises five chapters.
formulations and a summary of the CDR controlling mechanisms and burst are also overviewed. (Work described in this chapter has been published in a book chapter).
In chapter 3, a quantitative analysis of the factors (drug molecular descriptors, encapsulation method and formulation characteristics) that impact on the amount of burst release and the burst release rate using PLS and decision tree methods is presented. This analysis was utilized as feature selection method choosing the impact factors of the burst release amount and of the kinetics for the subsequent modelling activities (Work described in this chapter has been published in a book chapter and article).
In chapter 4 drug release is modeled via the Corrigan equation in which changes in its parameters associated with the total amount of drug released during burst and the burst kinetics are described by artificial neural networks (ANNs). The ANNs are derived as functions of the synthesis parameters and molecular descriptors of the drug identified by the decision tree modeling. A bootstrap aggregating identification strategy is used for the
development of the hybrid model. The model is used to predict the cumulative drug release of an independent set of CDR experiments for testing its capabilities. (Work described in this chapter has been submitted for publication.)
The bootstrap aggregated hybrid model developed (in chapter 4), is used in chapter 5 for predicting the changes in the initial burst release of two proteins when manipulating the formulation characteristics of the encapsulating particles to achieve a desired profile. A rational particle design approach is developed that manipulates the formulation characteristics to match a desired release profile while also minimizing the deviations
between the predictions of the aggregated models. The proposed method is applied to a mock protein (α-chymotrypsin), which exhibits similarities with an expensive drug, Activin A, in terms of important molecular descriptors with the target drug. A sensitivity analysis is
performed at the optimal formulation characteristics to assess the sensitivity of the cumulative drug release to changes in the formulation characteristics.
1.4. Thesis main achievements
In this thesis the impact of physicochemical factors, such as drug molecular descriptors, encapsulation method and formulation characteristics, on the amount of burst release and the burst release rate are quantified using PLS and decision tree methods. An analysis utilizing both methods to identify the most impactful input factors on the amount of burst release and respective kinetics and the findings are in mainly consistent.
Due to a much better performance of decision tree models, these are utilized as feature selection method to pinpoint the impact factors for the burst release.
Subsequently a bootstrap hybrid model methodology was derived for the prediction of cumulative burst drug release. The aggregated hybrid model comprises an empirical burst release equation in which variations in its parameters associated with the total amount of drug released during burst and the burst kinetics are described by artificial neural networks
(ANNs). The aggregated model was used to predict the cumulative drug release of an independent set of CDR experiments having good agreement between the predicted and the experimentally measured cumulative drug release profiles been achieved.
Finally, the bootstrap aggregated hybrid model developed was utilized in an optimization framework to design protein-loaded PLGA particles such that a predefined, desired release profile is obtained, while also showing low standard deviations between the predictions of the aggregated models. The proposed rational design method was successfully applied to a mock protein (α-chymotrypsin), which exhibits similarities with an expensive drug, Activin A, in terms of important molecular descriptors. A sensitivity analysis was performed for the optimal formulation characteristics and the results, when compared to literature findings, showed good agreement. The burst release predictions of the mock protein were then compared to those obtained for Activin A using the same mock-protein optimized particle design. Good agreement between the predicted releases for both protein-carrier systems was achieved with equal formulation characteristics.
1.5. References
[1] S. Davis, L. Illum, Drug delivery systems for challenging molecules, IntJPharm. 176 (1998) 1–8.
[2] Y. Chien, drug delivery : controlled RELEASE, Encycl. Pharm. Technol. (2007). doi:10.1081.
[3] P. Langer, Present and future applications of biomaterials in controlled drug delivery systems, Biomater. 1981. 2 (1981).
[4] C.S. Brazel, N.A. Peppas, Temperature- and pH- Sensitive Hydrogels for Controlled Release of Antithrombotic Agents, MRS Proc. 331 (1993). doi:DOI: 10.1557/PROC-331-211.
[5] K. Park, The Controlled Drug Delivery Systems: Past Forward and Future Back, J. Control. Release. 190 (2014) 3–8.
http://www.ncbi.nlm.nih.gov/pmc/articles/PMC4142099/.
[6] Y. Zhang, H.F. Chan, K.W. Leong, Advanced materials and processing for drug delivery: The past and the future, Adv. Drug Deliv. Rev. 65 (2013) 104–120. http://www.sciencedirect.com/science/article/pii/S0169409X12003213.
[7] E.S. Kawasaki, A. Player, Nanotechnology, nanomedicine, and the development of new, effective therapies for cancer, Nanomedicine Nanotechnology, Biol. Med. 1 (2005) 101–109. doi:http://dx.doi.org/10.1016/j.nano.2005.03.002.
[8] R.J. Linhardt, Biodegradable polymers for controlled release of drugs- Controlled Release of Drugs., VCH Publishers, 1989.
[9] D.Y. Arifin, L.Y. Lee, C.-H. Wang, Mathematical modeling and simulation of drug release from microspheres: Implications to drug delivery systems, Adv. Drug Deliv. Rev. 58 (2006) 1274–1325.
http://www.sciencedirect.com/science/article/pii/S0169409X06001669.
[10] S. Bamrungsap, Z. Zhao, T. Chen, L.W. Chunmei, L.T. Fu, W. Tan, Nanotechnology in Therapeutics A Focus on Nanoparticles as a Drug Delivery System, Nanomedicine. 7 (2012) 1253–1271. http://www.medscape.com/viewarticle/770397.
[11] JONG w, Drug delivery and nanoparticles: Applications and hazards, Int J Nanomedicine. 30 (2008) 133?149.
http://www.ncbi.nlm.nih.gov/pmc/articles/PMC2527668/.
[12] K.S. Soppimath, T.M. Aminabhavi, A.R. Kulkarni, W.E. Rudzinski, Biodegradable polymeric nanoparticles as drug delivery devices, J. Control. Release. 70 (2001) 1–20. http://www.sciencedirect.com/science/article/pii/S0168365900003394.
[13] A.J. Almeida, E. Souto, Solid lipid nanoparticles as a drug delivery system for peptides and proteins, Adv. Drug Deliv. Rev. 59 (2007) 478–490.
http://www.sciencedirect.com/science/article/pii/S0169409X07000439.
[14] R.C. Mundargi, V.R. Babu, V. Rangaswamy, P. Patel, T.M. Aminabhavi, Nano/micro technologies for delivering macromolecular therapeutics using poly(d,l-lactide-co-glycolide) and its derivatives, J. Control. Release. 125 (2008) 193–209.
http://www.sciencedirect.com/science/article/pii/S016836590700541X.
[15] F. Danhier, E. Ansorena, J.M. Silva, R. Coco, A. Le Breton, V. Prat, PLGA-based nanoparticles: An overview of biomedical applications, J. Control. Release. 161 (2012) 505–522.
http://www.sciencedirect.com/science/article/pii/S0168365912000752.
Carr. Syst. 21(5) (2004) 387-422.
[17] M.L. Hans, A.M. Lowman, Biodegradable nanoparticles for drug delivery and targeting, Curr. Opin. Solid State Mater. Sci. 6 (2002) 319–327.
http://www.sciencedirect.com/science/article/pii/S1359028602001171.
[18] F. Ramazani, W. Chen, C.F. van Nostrum, G. Storm, F. Kiessling, T. Lammers, W.E. Hennink, R.J. Kok, Strategies for encapsulation of small hydrophilic and amphiphilic drugs in PLGA microspheres: State-of-the-art and challenges, Int. J. Pharm. 499 (2016) 358–367. doi:http://dx.doi.org/10.1016/j.ijpharm.2016.01.020.
[19] C.E. Astete, C.M. Sabliov, Synthesis and characterization of PLGA nanoparticles, J. Biomater. Sci. Polym. Ed. 17 (2006) 247–289. doi:10.1163/156856206775997322. [20] C. Bouissou, J.J. Rouse, R. Price, C.F. van der Walle, The Influence of Surfactant on
PLGA Microsphere Glass Transition and Water Sorption: Remodeling the Surface Morphology to Attenuate the Burst Release, Pharm. Res. 23 (2006) 1295–1305. doi:10.1007/s11095-006-0180-2.
[21] R.A. Jain, The manufacturing techniques of various drug loaded biodegradable poly(lactide-co-glycolide) (PLGA) devices, Biomaterials. 21 (2000) 2475–2490. doi:http://dx.doi.org/10.1016/S0142-9612(00)00115-0.
[22] G. De Rosa, G. Salzano, PLGA Microspheres Encapsulating siRNA BT - RNA Interference: Challenges and Therapeutic Opportunities, in: M. Sioud (Ed.), Springer New York, New York, NY, 2015: pp. 43–51. doi:10.1007/978-1-4939-1538-5_4. [23] Sigma-Aldrich, Activin A active human Animal-component free, recombinant,
expressed in Nicotiana, >97%
http://www.sigmaaldrich.com/catalog/product/sigma/a4362?lang=en®ion=GB, (2017).
http://www.sigmaaldrich.com/catalog/product/sigma/a4362?lang=en®ion=GB. [24] A. Abuchowski, J.R. McCoy, N.C. Palczuk, F.F.D. van Es, Effect of covalent
attachment of polyethylene glycol on immunogenicity and circulating life of bovine liver catalase, 252 (1977) 3582-3586.
http://www.jbc.org/content/252/11/3582.full.pdf.
[25] H. Otsuka, Y. Nagasaki, K. Kataoka, PEGylated nanoparticles for biological and pharmaceutical applications, Adv. Drug Deliv. Rev. 55 (2003) 403–419.
http://www.sciencedirect.com/science/article/pii/S0169409X02002260.
[26] K. Avgoustakis, Pegylated poly(lactide) and poly(lactide-co-glycolide) nanoparticles: preparation, properties and possible applications in drug delivery., (2004) 321–333. [27] S.-W. Choi, J.-H. Kim, Design of surface-modified poly(d,l-lactide-co-glycolide)
nanoparticles for targeted drug delivery to bone, J. Control. Release. 122 (2007) 24– 30. http://www.sciencedirect.com/science/article/pii/S016836590700288X.
[28] E. Locatelli, M. Comes Franchini, Biodegradable PLGA-b-PEG polymeric
nanoparticles: synthesis, properties, and nanomedical applications as drug delivery system, J. Nanoparticle Res. 14 (2012) 1–17. http://dx.doi.org/10.1007/s11051-012-1316-4.
[29] sigma aldrich, RESOMER Biodegradable Polymers for Medical Device Applications Research, (2017). http://www.sigmaaldrich.com/technical-documents/articles/materials-science/polymer-science/resomer.html.
[30] P.N.A. Brazel C.S., Recent studies and molecular analysis of drug release from swelling-controlled devices, STP Pharma Sci.,. 9 (1999) 473–485.
[32] D.R. Esmaeili F. Atyabi F., Preparation and characterization of estradiol-loaded PLGA nanoparticles using homogenization-solvent diffusion method, DARU. 16 (2008) 196– 202.
[33] F. Alexis, S. Kumar, R. Freddy, B.S. Venkatraman, Study of the initial stages of drug release from a degradable matrix of poly(d,l-lactide-co-glycolide), Biomaterials. 25 (2004) 813–821.
[34] T.H. Kim, H. Lee, T.G. Park, Pegylated recombinant human epidermal growth factor (rhEGF) for sustained release from biodegradable PLGA microspheres, Biomaterials. 23 (2002) 2311–2317.
[35] E.K. Park, S.Y. Kim, S.B. Lee, Y.M. Lee, Folate-conjugated methoxy poly(ethylene glycol)/poly(e-caprolactone) amphiphilic block copolymeric micelles for tumor-targeted drug delivery, J. Control. Release. 109 (2005) 158–168.
doi:http://dx.doi.org/10.1016/j.jconrel.2005.09.039.
[36] S. Mao, Y. Shi, L. Li, J. Xu, A. Schaper, T. Kissel, Effects of process and formulation parameters on characteristics and internal morphology of
poly(d,l-lactide-co-glycolide) microspheres formed by the solvent evaporation method, Eur. J. Pharm. Biopharm. 68 (2008) 214–223. doi:http://dx.doi.org/10.1016/j.ejpb.2007.06.008. [37] R.P. Batycky, J. Hanes, R. Langer, D.A. Edwards, A theoretical model of erosion and
macromolecular drug release from biodegrading microspheres, J. Pharm. Sci. 86 (1997) 1464–1477. http://dx.doi.org/10.1021/js9604117.
[38] X. Huang, C.S. Brazel, On the importance and mechanisms of burst release in matrix-controlled drug delivery systems, J. Control. Release. 73 (2001) 121–136.
http://www.sciencedirect.com/science/article/pii/S0168365901002486.
[39] P.Z.J.S. Shuibin Feng Lei Nie, Effects of Drug and Polymer Molecular Weight on Drug Release fromPLGA-mPEG Microspheres, J. APPL. POLYM. SCI. (2015). doi:DOI: 10.1002/APP.41431.
[40] price guide Lupaneta Pack, (2017). https://www.drugs.com/price-guide/lupaneta-pack%0D.
[41] price guide signifor lar, (n.d.). https://www.drugs.com/price-guide/signifor-lar. [42] H. Makadia, Poly Lactic-co-Glycolic Acid (PLGA) as Biodegradable Controlled Drug
Delivery Carrier, Polymers (Basel). 3 (2011) 1377–1397. doi:10.3390/polym3031377. [43] O.I. Corrigan, X. Li, Quantifying drug release from PLGA nanoparticulates, Eur. J.
Pharm. Sci. 37 (2009) 477–485. doi:http://dx.doi.org/10.1016/j.ejps.2009.04.004. [44] S.N. Rothstein, S.R. Little, A “tool box” for rational design of degradable controlled
release formulations, J. Mater. Chem. 21 (2011) 29–39. doi:10.1039/C0JM01668C. [45] B. Patel, V. Gupta, F. Ahsan, PEG-PLGA based large porous particles for pulmonary
delivery of a highly soluble drug, low molecular weight heparin, J. Control. Release. 162 (2012) 310–320.
http://www.sciencedirect.com/science/article/pii/S0168365912005433.
[46] B.S. Zolnik, D.J. Burgess, Evaluation of in vivo-in vitro release of dexamethasone from PLGA microspheres, J. Control. Release. 127 (2008) 137–145.
http://www.sciencedirect.com/science/article/pii/S0168365908000308.
[47] S.G. Dsouza, In vitro-in vivo correlation from lactide-co-glycolide polymeric dosage forms, Prog Biomater. (2014). doi:DOI 10.1007/s40204-014-0029-4.
metal stents, J. Biomed. Mater. Res. Part A. 96A (2011) 632–638. doi:10.1002/jbm.a.33016.
[49] G. Mittal, D.K. Sahana, V. Bhardwaj, M.N. V Ravi Kumar, Estradiol loaded PLGA nanoparticles for oral administration: Effect of polymer molecular weight and copolymer composition on release behavior in vitro and in vivo, J. Control. Release. 119 (2007) 77–85.
Chapter 2
-
PLGA, Burst and
Controlled Drug Release
2.1. Introduction to Controlled release
Pharmaceutical products can be administered to the human body via various pharmaceutical dosage forms, like tablets. In order to maintain a therapeutic level of the drug in the host most systems require frequent and repeated doses. This can yield an undesirable ‘‘seesaw’’ effect of the drug level in the host blood plasma (Figure 1-1), where oscillations outside maximum safe concentrations and minimum effective dosage can result in a waste of the valuable drug or in concentrations toxic for the host [1]. The introduction of controlled release therapies based on biodegradable microparticles has revolutionized the field of drug release. They have been widely studied for the last 3 decades [2,3]. Special interest has been focused on
biopolymers with long degradation times, which allow for i) a non-invasive administration, without the need of extraction, as opposed to implants and ii) for sustained and controlled release throughout the length of the treatment, which can reach several weeks or months (Table 2-1).
The advent of miniaturization technologies (<1 µm) introduced nano-particulate systems with additional advantages. Nanoparticles fall into a size scale similar to proteins, being able to penetrate cell membranes [4,5]. Also, the delivery of anticancer agents, e.g., paclitaxel, with microparticles was very slow due to the drug poor solubility and diffusivity. The transition to encapsulating paclitaxel in nanoparticles instead of microparticles increased the surface area available for drug diffusion. Though the nanoparticles polymer matrix is more compact (leading to aslower diffusivity in the polymer matrix [6]), the overall effect results in an increase in the drug release rate with a decrease in particle size when compared with microparticles of the same polymer [7].
Controlled release systems have been designed to enable a sustained drug release over time, to protect the drug from premature elimination and to assist drug in crossing physiological barriers[8]. By augmenting the duration of one course of treatment, the patient compliance increased significantly. Controlled release systems add commercial value to existing pharmaceutical entities; i) the repackaging of an existing drug in a controlled release carrier can extend the patent protection time and ii) a recent study, estimated [9] that 90% of the top 100 best-selling prescription drugs could improve their therapeutics capabilities if
administrated at a lower rate and less frequent dosages.
2.2. The importance of PLGA
Figure 2-1. (a) Structure of PLGA; x= lactic acid units, y=glycolic acid units; (b) Structure of Polyethylene glycol (PEG); n= number of monomers
Controlled delivery systems based on PLGA have a tremendous interest due to an array of properties. PLGA is biocompatible and the biodegradable [11–13]; this polyester is degraded by hydrolysis. The resulting products are either excreted by the kidneys or eliminated as water and carbon dioxide via established pathways [13].
The manipulation of PLGA polymeric chain (PLA/PGA ratio, PLGA molecular weight) allows for a fine-tuning of the mechanical properties of PLGA particles [11,14,15]. PLGA micro and nanoparticles can be synthesized in an array of different size ranges and with mechanical properties (e.g., degradation rate) to suit the needs of the drug delivery. PLGA particles have been approved by the FDA in several PLGA-based drug products (Table 2-1) [16] and they are widely used as controlled delivery carriers [8,17].
Several reviews on the usage of PLGA based micro and nanosystems can be found in [17– 19]. In this study, PLGA micro- and nanoparticles are studied because i) due to their widespread use significant amounts of data are available; ii) choices in the design of the particles have a significant impact in the drug delivery profile; iii) due to the expected high use in the future, a model that allows for rational design of the particles will provide a significant contribution.
In addition, PLGA particles with a surface transformation, a PEG coating were included in the study as described in section 2.3.
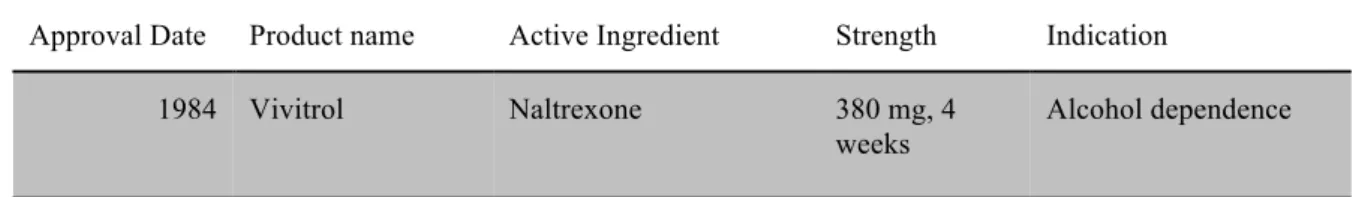
Table 2-1. FDA-Approved Drug Delivery Products Using PLGA Polymers and Under Development
Approval Date Product name Active Ingredient Strength Indication
1984 Vivitrol Naltrexone 380 mg, 4
weeks
Alcohol dependence
1988 Suprefact Depot Buserelin acetate 1 mg, 8 to 12 weeks
Prostate cancer
1989 Zoladex Groserelin acetate 3.6 mg 4weeks
Prostate and breast cancer
1989 Lupron Depot Leuprolide acetate 7.5 mg, 1 month
Prostate cancer (palliative treatment)
1993 7.5 mg, 1
month
Central precocious puberty
1995 3.75 mg, 1
month
Endometriosis
1998 Sandostatin LAR Octreotide acetate 10-30 mg, 4 weeks
Acromegaly
1998 Atridox Doxycycline hyclate 50 mg / 1 week
Periodontal disease
1999 Nutropin Depot Recombinant human growth hormone
2.25 mg/kg, 2 weeks
Growth hormone deficiency
2000 Trelstar triptorelin pamoatea 3.75 mg, 1 month
Advanced prostate cancer
2001 Arestin minocycline 1mg / * Adult periodontitis
2002 Eligard leuprolide acetate 3.5 mg, 1 month
Advanced prostate cancer
2003 Risperdal Consta risperidone 12.5, 2 weeks Schizophrenia & bipolar I Disorder
2006 Vivitrol naltrexone 380mg, 1
month
Alcohol dependence & opioid dependence
2007 Somatuline lanreotide 120mg/* Acromegaly
2009 Ozurdex dexamethasone 0.7mg/ * Macular edema
2012 Bydureon Exenatide 2mg /1 week Diabetes (glycemic
control)
2012 Lupaneta Pack Leuprolide and norethindrone acetate
3.75mg / 1month
Endometriosis
2014 Signifor LAR Pasireotide parnoate 40mg/ 4 weeks
Acromegaly
CF2 Oncogel Paclitaxel
PEG-PLGA-PEG **
Solid tumors
CF3 Sanvar® SR Vapreotide ** Esophageal bleeding
varices (EVB)
2.3. PEGylation of particles
In vivo use of PLGA particles presents several challenges as for instance; i) they have poor
stability in water [20], ii) blood proteins are easily adsorbed on their surface and promote opsonization, leading to aggregation and rapid clearance from the bloodstream [20–22] and iii) particles larger than 200nm are easily removed by the liver and spleen, thus reducing the circulation time and the concentration of the drug [23].
Some of these difficulties can sometimes be overcome by turning the particle “invisible”. As Allan [24] wrote, “if you want to be invisible, look like water”. Hence, coating the surface of nano- and microparticles with polyethylene glycol (PEG), a hydrophilic inert polymer, will offer hydrophilic properties to the PLGA particles. This surface coating “masks” the PLGA particles, inhibiting their recognition by the immune system (opsonization) and avoiding reticuloendothelial system, which can result into, PEGylated PLGA particles having a longer half-lives in the blood [23,25–28]. Also, this surface transformation is shown to not
compromise the activity of the therapeutic agent significantly [26].
The extent of stealth qualities of PEG has been put in question by several researchers. Several
in vivo studies have observed that a small amount (2.5-10%) of PEG-coated particles were
removed by the spleen and liver 1 hour after administration[29–31]. Fortunately this quantity was observed to decrease with the increase of concentration of PEG-coated particles [29]. It is yet unknown if the opsonization of PEG-coated particles is targeting the PEG vesicles or an exposed (non-coated) area of the particle [32–35]. Still, PEG-coated particles were found to have long circulation times after extensive opsonization [36].
Figure 2-2. Schematic (a) drug-loaded PLGA particle; (b) PEGylated PLGA nanoparticle.
Nevertheless, PEG is the most widely used “stealth” polymer in controlled drug delivery, due to its long history of safety in humans and gained classification as it is “Generally Regarded as Safe” (GRAS) by the FDA [37,38]. Reviews on the applications of PEGylation of PLGA
particles can be found in[23,35,37,39–41].
2.3.1. Drawbacks of PEGylation
Despite the advantages stated, PEGylation of particles can influence the rate of drug release. Hence in this work PEGylated PLGA particles were also considered. For instance, Daravan et al. [42] showed that drug release from PLGA-PEG particles suffered an abrupt initial burst with a large amount of drug released immediately upon hydration. Several researchers have observed an increase in the initial burst when dealing with PEGylated PLGA particles, versus their PEG free counterparts [43–49]. This might be due to its high hydrophilicity, whereby PEG-PLGA particles have an increased initial water hydration, which in turns accelerates the release of the drug adsorbed at the particle surface [50].
2.4. Release mechanism related to the CDR from PLGA particles
Figure 2-3. A scheme of physicochemical processes taking place within PLGA matrices, leading to drug release. The influence of processes on drug release and on other processes is illustrated by arrows. Note that some arrows point in both directions. Adapted from [52].
Degradable delivery systems can be designed to exploit a variety of mechanisms. Langer [57] suggested to categorize the delivery systems into three main rate-controlling mechanisms in CDR; diffusion-, erosion-and swelling-controlled, which has been widely adopted
[51,52,55,6,60]. The limiting step in the release of majority of types of drug-embedded nanoparticles is the drug diffusion through water or biological medium filled pores
(hereinafter referred to diffusion for simplicity) [51,6,61–66]. Fredenberg [67] explained the dominance of diffusion versus other true phenomena as follows: (i) proteins or peptides, are often too large and too hydrophilic to diffuse through the polymer; and (ii) drug transport is often faster than polymer erosion. Even in cases where erosion plays an important role, diffusion is used to describe the first stage of the release [55,68,69]. Depending on the physicochemical properties of the particles, the release is either purely fickian (Figure 2-4, blue line), where the diffusion is the rate-controlling mechanism, or the release can have an apparent “S” shape. The “S” shape profile is marked by an initial diffusion phase, followed by a lag phase where a low amount of drug is released and finally a second rapid drug release phase, where usually the remaining drug is diffused via an erosion-induced porous matrix (Figure 2-4, orange line) [70,71].
Water adsorp+on/
swelling Forma&on of
pores or cracks Pore closure Polymer-drug interac&ons
Change in polymer chain and density Dissolu&on of PLGA
oligomers inside the matrix Crystalliza&on
PLGA chara
cteris+cs End-group capping Lac:Gly ra&o Mw Size Porosity Polymer density Drug Del
ivery system
Figure 2-4. Model of Heller and Baker [72] describing drug release from thin biodegradable polymers particles undergoing bulk erosion (squares), and purely diffusion-controlled release kinetics calculated using the classical Higuchi model [73] (diamonds). Adapted from [51].
2.5. Influences of particle design and synthesis choices on CDR
The degree to which the phenomena shown in Figure 2-3 control CDR rates depends on various properties of the drug-carrier system. For instance, the manipulation of the PLGA polymeric chain (PLA/PGA ratio, PLGA Mw) is a known and important parameter to fine-tune the CDR [15,74]. Other variables are the size of the carrier, concentration and solubility of the drug in the polymer and medium as well as encapsulating membrane diffusion
[51,52,75–77]. Studies of the impact of several synthesis parameters and drug properties on the drug release profile can be found in [71,78–85].
Rothstein et al. [86] reviewed the literature and gathered the impact of several variables that impact the CDR. However they only considered the impact of one variable at a time and neglected the interdependencies between variables [87]. In addition the impact of the variables is not quantified.
2.6. Burst
A rapid release of drug can occur during the first hours of immersion of a controlled drug release (CDR) system [10-16]. This burst release is likely due to leakage of undissolved drug particles located near the particles surface.
Also a poorly entrapped drug easily diffuses out of the carrier during the initial contact with the biological fluid, giving rise to a strong burst. In a few particular cases it can be designed as a triggered burst [17], but usually it is an uncontrolled, undesired phenomenon (see e.g., review of Huang et al. [18]). An intense burst drug release often leads to a shorter total drug release time and high initial drug concentrations that can have deleterious effects on the host. Very high burst release was observed by several researchers. In many cases up to 80% of the total drug loading was released within the first 24 hours [80]. Moreover, the burst release hinders predictability and reproducibility, which are prerequisites for a safe controlled drug release system. Some researchers stated that for there to be an initial burst, it is necessary to have poorly encapsulated drug adsorbed at the particles surface [74]. Hence, a reduction of the initial burst is achieved by an optimization of the encapsulation efficiency, which is quite difficult to control especially during the solidification phase of the particles synthesis [87]. Other strategies that are at least to some degree consensually accepted exist in regards to how to decrease the burst release. These strategies aim at manipulating particular physicochemical properties of the PLGA carrier [53,87]. Although well documented, no consensus exists on the underlying physical mechanisms neither on how to prevent mechanisms that result in a burst release [53] .
Table 2-2. Examples of burst release from PLGA micro and nanoparticles observed in published work.
Released drug Molecular weight, Da
PLGA (Lac:Glyc), / Mw (kDa)
Amount of burst drug release, %
Source
Blue dextran (model drug)
2000 75:25 / 5 30 [88]
BSA 66000 75:25 / 40 67.5 [81]
Lysozyme ∼ 14400 50:50/ 27 50 [89]
BSA 66000 50:50 /* 60 [78]
BSA 66000 PLGA(75:25) –
PEG / 45
37.5 [90]
FITC-BSA 66000 75:25 / 14 70 [91]
* Not specified by the authors
2.7. CDR modeling for PLGA particles
The majority of PLGA carriers can be designed to exploit either diffusion-controlled, swelling/erosion-controlled, or combinations of all mechanisms [52,57,6]. Mathematical models play an important role in the design (or optimization) of new controlled delivery carriers. A variety of carrier systems have been studied by establishing both simple and complex mathematical models.
The first to formulate a mathematical model for controlled drug delivery was Higuchi [93] in 1961. The model describes the rate of release of a drug suspended in ointment bases into a medium in perfect sink conditions (Figure 2-5).
The general form of the Higuchi model is 𝑄=𝑘∙ 𝑡 with = 2∙𝐶!"∙𝐶!∙𝐷 , where 𝑄 is
amount of drug released at time 𝑡, 𝐶!" is the drug concentration, 𝐶! is the solubility of the
drug and 𝐷 is the drug diffusion constant in the medium.
The amount of drug released correlates with the square root of time.
Dexamethasone 392.46 50:50 / 55 60 [71]
Figure 2-5. Theoretical drug concentration profile in an ointment, in contact with a medium in perfect sink conditions at time t (solid line) and at time t+dt (dashed line). Variables h represents the distance of the wave front, separating three different concentrations in two boundaries (right to left) ointment free of non-dissolved drug excess (sink conditions) with ointment with non-non-dissolved drug excess and at left from the ointment interface at time t. dh is the distance the wave moves inwards during the time interval dt..
[Adapted from [93,94].
The Higuchi model can be derived to fit other types of morphologies, but it can easily be misused neglecting the assumption used to derive the model [93], so much so that Siepmann et al. wrote an article on the use and misuse of the Higuchi model [94].
After Higuchi, several researchers have developed models of drug release from micro- and nanoparticles based on a mechanistic or phenomenological interpretation (e.g., [19-26]). An extensive review of modeling of drug release from microspheres can be found in Arifin et al. [6]. The authors structure the review into models dealing with i) diffusion-controlled systems where the drug diffuses through the non-degraded polymer matrix; ii) swelling-controlled systems where the diffusing of the drug in enhanced due to polymer swelling, and iii) erosion-controlled systems, where the drug is released due to the polymer matrix
degradation. The first case, purely diffusion-controlled systems, deals with rigid, non-degradable particles, typically reservoir-like. The second Fick´s equation of diffusion can be used to describe these systems ((Table 2-3, equation 1) [95]). Although PLGA particles are degradable, several researchers have “borrowed” non-degradable mathematical models for the
dh
C
inC
sPerfect sink
h
release from PLGA particles under the assumption that the particle radius is constant, and managed a good fit at least for “small” times (Table 2-3, equations 2 and 3). The second and third categories represent the release from degradable particles, the category PLGA carriers belongs to. Mechanistic and empirical models from these categories are shown in Table 2-3 (equations 6,67,9,10 and 11). Finally Arifin et al. delved into the applicability of using the existing CDR models from microparticles models to nanoscale drug delivery systems, specifically focusing in the challenges of hydrophobic and hydrophilic molecules delivery. Table 2-3. Mathematical models describing drug release from spherical degradable micro and
nanoparticles.
Controlled drug release model* Controlling
mechanisms / Notes
Source
Mechanistic
(1) 𝑄!
𝑡 =4𝜋
𝑅𝑅!
𝑅−𝑅!
𝐷𝐶! Diffusion /
reservoir
[95]
(2)
𝑄=6
𝐷𝑡
𝜋𝑅!−
3𝐷𝑡
𝑅! 𝑓𝑜𝑟 𝑄<0.4
Diffusion [96]
(3)
𝑄 =1− 6
𝜋!𝑒𝑥𝑝 −
𝜋!𝐷𝑡
𝑅! 𝑓𝑜𝑟𝑄>0.6
Diffusion [96]
(4)
𝑄 =4 𝐷!
𝑡
𝜋𝑅!−
3𝐷!
𝑡
𝑅!
+𝐹
!
𝑒!!"#$(!!!!"#)
1+𝑒!!"#$(!!!!"#)
Erosion [97]
(5)
𝑄=1−𝑒𝑥𝑝 −
𝑡−𝑡!"# !
𝑡!"#$%
Erosion [98]
(6)
𝑄=1− 1−
𝑘!"#
𝐶!𝑅
! Erosion [99,100]
(7)
𝑄=1− 1−
𝑘!"#
𝐶!𝑅(𝑡−𝑡!"#)
! Erosion + lag [101]
(8) 𝑄=𝐹!"# 1−𝑒!!!
+ 1−𝐹!"#
𝑒!!"#$(!!!!"#)
1+𝑒!!"#$(!!!!"#)
Erosion - burst [102]
Empirical
(10) 𝑄=𝑘 !𝑡
! +𝑘
!𝑡!
! Swelling [104]
(11) 𝑄=𝑘(𝑡−𝑡!"#)!+𝛽 Swelling +
burst
[105]
Q(t)=cumulative release
Legend: R=r=particle radius, Ri=core radius, D=Diffusion coefficient, De= approximated drug diffusivity, kdeg= surface degradation rate constant, Fe= fractional amount of drug release during erosion, tmax= time to maximum matrix erosion rate, tlag= lag time before the polymer matrix erosion, keros= surface erosion rate constant, C0 = initial concentration of the drug in the matrix, Fbin=𝛽 = fractional amount of drug release during burst, kb=burst kinetics parameter
Another model shown in Table 2-3 is the Corrigan model equation 8 [102]. It features the controlling steps of an initial diffusion and a second phase where the drug entrapped in the polymer is released, due to polymer erosion. Due to its ability of modeling the initial burst followed by a steadier release and its simplicity, the Corrigan model will be utilized in this work. For more details, see section 2.6.2.
Siepmann and Göpferich [51] wrote a review on “Mathematical modeling of bioerodible, polymeric drug delivery systems” the category where PLGA particles fall into. The authors analyzed models based on phenomenological events, diffusion phenomenon (i.e., Fick equation derivations) and chemical reaction theory. As noted by the authors, there is a panoply of mathematical models, that due to the significant chemical and physicochemical differences among biodegradable systems are not usually able of being utilized for other carriers. Most models that were developed to describe a CDR system are only valid for the specific carrier-drug system for which they were developed.
An interesting approach carried out by Siepmann et al. [106] where a Monte Carlo sampling was combined with a mechanistic model. The mechanistic model takes in consideration the possible controlling mechanisms in CDR from erodible microparticles (diffusion, dissolution, erosion of the polymer and moving boundary conditions). Initial conditions are defined regarding the porosity of the polymer, and how the matrix porosity (i.e., if a certain area, dA, of the three-dimensional particle is occupied by drug, polymer or pore) evolves along time. The model fitted well one CDR experiment with an “S” shape, where several physical processes were involved at different stages of the release. Although a good agreement was achieved with experimental data, like other mechanistic models, the impact of
physicochemical properties of the drug and polymer matrix are not described. Hence it would have limited value for the design of carrier system.
2.7.1. Parameter Identification
number of experiments. These parameters are specific for a given drug-polymer matrix combination. This means that when designing a new drug carrier, these models will be of little use, i.e., its predictability capacities are limited to the drug-particle combination for which its parameters were identified.
Also, the experimental conditions and drug properties, which have a significant impact on the controlled release profile, are at most only implicitly taken into account by these models. More specifically, the model parameters that characterize the drug release profile are identified from data and their values are context dependent implying that for new drugs and experimental conditions the parameters are per se unknown. The average carrier radius is typically included in such models, enabling the study the impact of the carrier size on the CDR profile. However, the carrier chemical composition (e.g., monomers ratio), which has a significant impact in the CDR profile [74], is indirectly represented by empirical model parameters and cannot be extrapolated to a different context. Thus these models are often unfit to predict the effect neither of the carrier chemical composition, nor of the experimental conditions, formulation characteristics or drug chemical properties on the CDR profile.
Data driven approaches have also been used for CDR modeling and analysis. These methods can be used to identify significant correlations between macroscopic kinetic parameters and physiochemical properties of the carrier and/or drug without a formal mechanistic
interpretation. Matero et al. [107] divided the cumulative drug profile into seemingly linear phases and then applied Partial Least Square regression (PLS) to each phase individually, using molecular descriptors as inputs. The final PLS models were however specific to the type of hydrophobic matrix tablet studied.
neural networks, random forests, multivariate adaptive regression splines, etc.) for modeling the cumulative amount of drug released from PLGA microparticles. While the drug release profiles were fairly well modeled, understanding how the formulation characteristics or drug properties impact on the drug release, i.e.,on the amount of drug released or the release kinetics was not straightforward due to the empirical nature of the models.
2.7.2. How to model burst
Though burst is a frequent event, most mathematical models ignore the burst phase due to lack of mechanistic understanding. Huang and Brazel [53], in a rare review on the burst mechanisms that control drug delivery noted that a simple approximation could be made to power law models (equation 9 and 11), by adding a parameter 𝛽, which shifts the drug release profile vertically by a certain amount (Figure 2-6).
The parameters 𝛽,𝑘,𝑡!"# and 𝑛 were determined after fitting the equations with experimental data.
The authors also cited the rare attempts made into modeling mildly intense burst releases in swelling controlled systems using purely empirical equations [115,116].

![Figure 2-4. Model of Heller and Baker [72] describing drug release from thin biodegradable polymers particles undergoing bulk erosion (squares), and purely diffusion-controlled release kinetics calculated using the classical Higuchi model [73] (diamonds)](https://thumb-eu.123doks.com/thumbv2/123dok_br/16502440.734094/44.892.136.562.140.468/describing-biodegradable-particles-undergoing-diffusion-controlled-calculated-classical.webp)