Paula Isabel Pereira Soares
Mestrado Integrado em Ciências Farmacêuticas
Chitosan-based magnetic nanoparticles for
osteosarcoma theranostic
Dissertação para obtenção do Grau de Doutor em Nanotecnologias e Nanociências
Orientador: Doutor João Paulo Miranda Ribeiro Borges, Professor Auxiliar, Faculdade de Ciências e Tecnologia da Universidade Nova de Lisboa Co-orientador: Doutora Isabel Maria das Mercês Ferreira, Professora Associada,
Faculdade de Ciências e Tecnologia da Universidade Nova de Lisboa Doutor Carlos Manuel Mendes Novo, Investigador Auxiliar, Instituto de Higiene e Medicina Tropical da Universidade Nova de Lisboa
Júri:
Presidente: Prof. Doutora Elvira Maria Correia Fortunato Arguentes: Prof. Doutor Pedro Lopes Granja
Prof. Doutor Sérgio Jerónimo Rodrigues Dias Vogais: Prof. Doutora Maria Helena Mendes Gil
Prof. Doutor José Maria Marcelino
Chitosan-based magnetic nanoparticles for
osteosarcoma theranostics
Copyright © Paula Isabel Pereira Soares, Faculdade de Ciências e Tecnologia, Universidade Nova de Lisboa.
“A dor é passageira mas a glória é eterna!”
Although the acknowledgements is the less scientific part of a PhD thesis, in my opinion it is the most important part. Science as well as life, is made by people, and a lot of people helped me during this journey.
First of all, I want to acknowledge my supervisors: Prof. Dr. João Paulo Borges, Prof. Dr. Isabel Ferreira and Dr. Carlos Novo. The three of you given me the opportunity to accomplish one of the points of my bullet list: a PhD! To Prof. JPB who is always busy with his classes, a thousand students and the late paperwork, but can always have five minutes to unblock a messy mind or to have a brilliant idea. To Prof. Isabel that never gives up and is an inspiration, always giving me the support I needed. Thanks for all the correction during these four years, even the most boring ones. To Prof. Carlos for opening the doors to immunology and helping I re-learn every day the knowledge that was almost forgotten. To all of you, thank for helping me survive in the ‘science world’, it was a pleasure to learn from you every day!
To Prof. Elvira Fortunato and Prof. Rodrigo Martins for the opportunity to work in such an ex-ceptional research center, such as CENIMAT.
I would like to acknowledge all of those who directly collaborated with me and provided crucial contributions to this work. I am extremely grateful to MSc. Ana Alves, MSc Frederik Löchte, BSc. Rafaela Boaventura, BSc. Francisco Ferreira, MSc. Diana Machado and MSc. Ana Isabel Sousa. I am also grateful to have had the opportunity to work along other master students that I will not list here. Although you weren’t my students, it was wonderful to share the lab with you. Your ideas, motivation and interest in each of your works were wonderful to see. Without you all, this would not have been possible. Thank you!
To Prof. Dr. Paula Videira and all her team of the Glycoimmunology group at the Center of Chronic Diseases at Nova Medical School, I’m much grateful for welcoming me and letting me use your lab for the immunology studies. A special thanks to Mylène Carrascal for all the help, time and ideas shared during this work.
To Prof. Jorge Silva thank you so much for letting me use your cell culture lab like it was mine. Your dedication is impressive and inspiring!
This section would not be complete without acknowledging my lab colleagues. To the ones that are far away, MSc. Esther Merino and MSc. Joana Vasconcelos, thank you for your friendship, your support, and for making me feel like a superwoman!! It was a pleasure to have met you both. To the people of the gin’ bar, aka “gente jovem” MSc. Rita Pontes, MSc. Teresa Kullberg, MSc. Joana Fernandes, and MSc. Alex Grüninger, thank you for the wonderful moments sharing a gin or not. To the ones that are still here to see me finish this, MSc. Carlos João, Dr. Ana Batista, Dr. Sumita Nandy, Dr. Susete Fernandes, and Augusta Gonçalves thank you for all the motivation, the long conversations, the loud laughter’s, and the promptness to help me along this research. Finally, a special acknowledge to my colleague that became a wonderful friend, Dr. Coro Eche-verria, you cannot image what I have learned from you in this two years. I am extremely grateful to have met you, and to share a “meia de leite” with you every day!
I would also like to thank two other friends that share this “burden” with me, MSc. Sofia Almeida and MSc. Raquel Varela. Sofi you are the most extraordinary person that I have ever met, and I just grateful to be a part of your life! Raquelita we know each other for 12 years now, since we were just “caloiras na FFUL”. So above everything thank you for your friendship during these years. We are almost “doutoras a sério” now!
Thank you also to Sara Oliveira and to Sónia Seixas from DCM secretariat and Susana Mendes from CENIMAT secretariat for all the administrative support given during this thesis.
I am extremely grateful for the financial support provided by Fundação para a Ciência e a Tecno-logia (FCT-MCTES) under the grant SFRH/BD/79302/2011 which allowed this research to be accomplished.
A special thanks to all my running friends, you make me forget all the problems and just focus on the next run! Running is a part of me now!
Cancer is a well-known disease with a significant impact in society not only due to its incidence, more evident in more developed countries, but also due to the expenses related to medical treat-ments. Cancer research is considered an increasingly logical science with great potential for the development of new treatment options. Advances in nanomedicine have resulted in rapid devel-opment of nanomaterials with considerable potential in cancer diagnostics and treatment. The combination of diagnosis and treatment in a single nano-platform is named theranostic. In this PhD thesis a theranostic system for osteosarcoma was proposed, composed by a magnetic core, a polymeric coating, and a chemotherapeutic drug. The presence of a specific targeting agent, in this case a monoclonal antibody, provides high specificity to the proposed theranostic system. For the core of the proposed theranostic system, stable aqueous suspensions of superparamagnetic iron oxide nanoparticles with an average diameter of 9 nm were produced. Chitosan-based poly-meric nanoparticles with a hydrodynamic diameter around 150 nm were successfully produced. Incorporation of iron oxide nanoparticles into the polymeric ones increased their hydrodynamic diameter to at least 250 nm. A monoclonal antibody specific for a transmembranar protein (car-bonic anhydrase IX) present in solid tumors was developed by hybridoma technology. Functional hybridomas producing the desired monoclonal antibodies were obtained.
The proposed theranostic system functionality was evaluated in separated parts of its components. Uncoated and coated iron oxide nanoparticles with chitosan-based polymers generated heat under the application of an external alternating magnetic field. Uncoated iron oxide nanoparticles sta-bilized with oleic acid were able to enhance contrast in magnetic resonance imaging. Drug deliv-ery studies were conducted in chitosan-based polymeric nanoparticles without and with the in-corporation of iron oxide nanoparticles, demonstrating to be an effective drug delivery platform for doxorubicin.
The theranostic system proposed in this PhD thesis is very promising for cancer theranostic, demonstrating to be applicable in solid tumors such as osteosarcoma.
O cancro é uma doença bem conhecida a nível mundial e com um elevado impacto na sociedade, não só pela sua elevada incidência mas também devido aos custos médicos que acarreta. Como consequência, a investigação científica nesta área é considerada bastante promissora para o desenvolvimento de novas opções terapêuticas. Por outro lado, o avanço na nano-medicina tem permitido o rápido desenvolvimento de nano-materiais com grande potencial para o diagnóstico e tratamento de cancro. A combinação de diagnóstico e tratamento num único nano-dispositivo chama-se teragnóstico. Nesta tese de doutoramento foi proposto o desenvolvimento de um sistema de teragnóstico para o osteossarcoma composto por um núcleo magnético, um revestimento polimérico e um fármaco quimioterapêutico. A presença de um anticorpo monoclonal torna o sistema altamente específico.
Para o núcleo do dispositivo de teragnóstico proposto foram desenvolvidas nanopartículas de óxido de ferro superparamagnéticas estáveis em suspensões aquosas, com um diâmetro médio de 9 nm. Foram também produzidas nanopartículas poliméricas à base de quitosano com um diâmetro hidrodinâmico de 150 nm. A incorporação de nanopartículas de óxido de ferro nas nanopartículas poliméricas aumentou o diâmetro hidrodinâmico destas últimas para 250 nm. Por último, foi produzido um anticorpo monoclonal específico para uma proteína transmembranar (anidrase carbónica IX) presente em tumores sólidos usando a tecnologia do hibridoma. Foram obtidos hibridomas funcionais capazes de produzir os anticorpos desejados.
A funcionalidade do dispositivo de teragnóstico proposto foi testada em cada uma das suas partes isoladamente. As nanopartículas de óxido de ferro com e sem o revestimento polimérico foram capazes de gerar calor sob a aplicação de um campo magnético externo alternado. As mesmas nanopartículas de óxido de ferro estabilizadas com ácido oleico melhoraram o contraste da ressonância magnética de imagem. Os estudos de libertação de fármaco foram feitos usando nanopartículas poliméricas com e sem óxido de ferro, tendo demonstrado a sua eficácia na libertação controlada de doxorubicina.
O sistema de teragnóstico desenvolvido nesta tese de doutoramento é bastante promissor para o teragnóstico do cancro, podendo ser aplicado em tumores sólidos como o osteossarcoma.
Palavras-chave: Cancro, Hipertermia magnética, Nanoparticulas de óxido de ferro, Quitosano,
ACKNOWLEDGEMENTS ...VII
ABSTRACT ... IX
RESUMO ... XI
MOTIVATION... 1
1.1. SCIENTIFIC CONTEXT... 1
1.2. OBJECTIVE ... 2
1.3. THESIS OUTLINE ... 3
1.4. SCIENTIFIC CONTRIBUTION ... 4
1.5. REFERENCES ... 6
GENERAL INTRODUCTION ... 7
2.1. CANCER... 7
The hallmarks of cancer ... 8
Current treatments ...10
Cancer statistics ...12
Osteosarcoma ...14
2.2. THE BASIS OF A THERANOSTIC SYSTEM ...16
Detection Component ...17
Coating Component ...19
Target Component ...20
2.3. THERANOSTIC SYSTEMS:STATE OF THE ART...21
Magnetic nanoparticles ...21
Polymeric nanoparticles ...22
2.4. REFERENCES ...23
IRON OXIDE NANOPARTICLES ...29
3.1. INTRODUCTION...29
Magnetic nanoparticles ...30
Magnetic properties ...31
Synthesis ...35
Colloidal stability and coating ...37
Pharmacokinetics, biodistribution and clearance ...42
Iron content determination ...49
Characterization ...49
3.3. RESULTS AND DISCUSSION ...51
NPs obtained from chemical precipitation ...52
Oleic acid double layer study ...69
NPs obtained from thermal decomposition ...77
3.4. SUMMARY ...80
3.5. REFERENCES ...82
CHITOSAN-BASED COATING ...89
4.1. INTRODUCTION...89
Chitosan and chitin ...90
Chitosan derivatives...92
Chitosan-based micro/nanoparticles ...95
Toxicity ...98
Applications ...100
4.2. MATERIALS AND METHODS ...102
Chitosan depolymerization ...102
Dilute solution viscosity ...102
O-HTCC synthesis ...102
Preparation of CS and O-HTCC NPs ...103
Characterization ...103
4.3. RESULTS AND DISCUSSION ...106
Chitosan depolymerization ...106
O-HTCC synthesis ...110
Thermal analysis of chitosan and O-HTCC ...112
Preparation of CS and O-HTCC nanoparticles ...113
Preparation of chitosan coated Fe3O4 nanoparticles ...122
4.4. SUMMARY ...127
4.5. REFERENCES ...129
MONOCLONAL ANTIBODY PRODUCTION ...135
5.1. INTRODUCTION...135
Monoclonal antibodies ...136
Mice immunization ...147
Cell fusion ...147
Flow cytometry ...148
Western blot...148
Dot blot ...149
Confocal laser scanning microscopy ...149
5.3. RESULTS AND DISCUSSION ...149
Identification of Ca IX presence in cell lines ...150
Murine immunization ...152
Hybridomas selection ...153
5.4. SUMMARY ...158
5.5. REFERENCES ...159
THERANOSTIC PART I: MAGNETIC HYPERTHERMIA, MRI AND CYTOTOXICITY ...163
6.1. INTRODUCTION...163
Magnetic Hyperthermia ...163
Magnetic Resonance Imaging ...168
6.2. MATERIALS AND METHODS ...170
Samples preparation...170
Magnetic hyperthermia ...171
Nuclear magnetic resonance ...171
Cytotoxicity assays ...172
Magnetic hyperthermia in vitro...173
Iron content determination ...173
6.3. RESULTS AND DISCUSSION ...173
Magnetic hyperthermia ...173
NMR relaxometry ...185
Cytotoxicity assays ...186
Magnetic hyperthermia in vitro...190
6.4. SUMMARY ...192
6.5. REFERENCES ...194
THERANOSTIC PART II: DRUG RELEASE STUDIES ...199
Chitosan as a drug delivery system ...204
Mathematical modelling for drug delivery systems ...207
7.2. MATERIALS AND METHODS ...213
Preparation of buffer solutions ...213
DOX calibration curves ...213
Selection of DOX carriers ...213
DOX encapsulation efficiency studies ...214
DOX release studies ...215
Characterization ...216
7.3. RESULTS AND DISCUSSION ...217
Characterization of DOX loaded polymeric NPs ...217
Encapsulation efficiency ...218
DOX release studies from CS and O-HTCC nanoparticles ...222
DOX release studies from iron oxide nanoparticles ...226
DOX release studies from polymer-coated Fe3O4 NPs ...226
Mathematical modeling of DOX release profiles ...231
7.4. SUMMARY ...244
7.5. REFERENCES ...246
CONCLUSIONS AND FUTURE PERSPECTIVES ...251
8.1. THESIS FINDINGS ...251
Production and characterization of iron oxide nanoparticles ...252
Production and characterization of chitosan and O-HTCC coating ...253
Production of monoclonal antibody anti-CA IX ...253
Suitability as theranostic agents ...253
8.2. FUTURE WORK...257
Core of the theranostic system ...257
Chitosan-based coating ...258
Theranostic system ...259
Figure 2.1. Estimated number of new cases (incidence) and deaths (mortality) of cancer for
both sexes in Portugal in 2012 (adapted from [23]). ... 14
Figure 2.2. Basic components of a theranostic nanostructure. ... 17
Figure 3.1. Evolution in the number of scientific papers published related to magnetic nanoparticles, iron oxide nanoparticles and magnetite nanoparticles. (Source: ISI Web of Knowledge © the Thompson Corporation. Search terms: ‘magnetic nanoparticles’, ‘iron oxide nanoparticles’, and ‘magnetite nanoparticles’. Date of search: June 2015). ... 30
Figure 3.2. Schematic representation of hysteresis loops (magnetization versus applied magnetic field) for ferromagnetic, superparamagnetic, diamagnetic, and paramagnetic nanoparticles. (Hc – Coercivity; Mr – Remanent magnetization; Ms – Saturation magnetization) (Adapted from [12, 13]). ... 32
Figure 3.3. Schematic illustration of the relationship between coercivity, nanoparticles size, and magnetic domain structures. The blue and red arrows represent the magnetic dipoles (adapted from [11]). ... 33
Figure 3.4. A) Schematic representation of the double layer of a nanoparticle in aqueous medium; B) Relationship between zeta potential and surface potential; C) Schematic representation of the free energy profile interaction between two superparamagnetic particles in the presence and absence of a strong magnetic field according to a generalized theory including magnetic interactions. The particles are assumed to be stabilized electrostatically (adapted from [40-42]). ... 38
Figure 3.5. Chemical structure of tri-sodium citrate. ... 47
Figure 3.6. Chemical structure of oleic acid. ... 47
Figure 3.7. Chemical structure of triton X-100... 48
Figure 3.8. X-ray patterns of (a) pristine iron oxide nanoparticles produced by chemical precipitation technique (b) Tri-sodium citrate 5 mM coated Fe3O4 nanoparticles; (c) Oleic acid 64 mM coated Fe3O4 nanoparticles; (d) Triton X-100 17 mM coated Fe3O4 nanoparticles. ... 52
Figure 3.9. FTIR spectra of (A) pristine Fe3O4 nanoparticles, (B) tri-sodium citrate coated Fe3O4 NPs, (C), oleic acid coated Fe3O4 NPs (D) triton X-100 coated Fe3O4 NPs. .... 53
chemical precipitation technique and further stabilized with TC 30 mM (C), TX 26 mM (D), OA 8 mM (E) and OA 96 mM (F). ... 56 Figure 3.12. UV-VIS spectra of pristine Fe3O4 NPs immediately after sonication and after
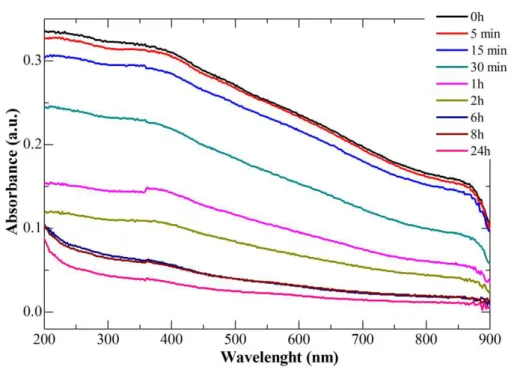
different periods up to 24 h. ... 58 Figure 3.13. UV-VIS spectra of tri-sodium citrate Fe3O4 NPs immediately and after 24 h of
sonication, at different tri-sodium citrate concentrations. ... 59 Figure 3.14. UV-Vis absorbance at 300 nm of tri-sodium citrate and Fe3O4 TC immediately
and 24 h after sonication for different concentrations of tri-sodium citrate. ... 59 Figure 3.15. Mass of Fe3O4 TC NPs in suspension (%) along time for the tested tri-sodium
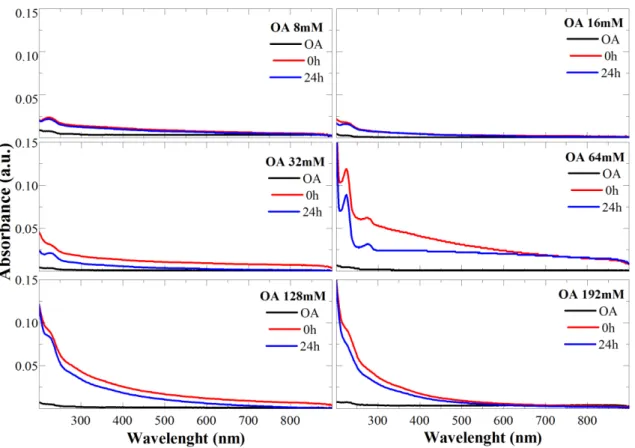
citrate concentrations. ... 60 Figure 3.16. UV-VIS spectra of oleic acid Fe3O4 NPs immediately and after 24 h of
sonication, at different oleic acid concentrations. ... 61 Figure 3.17. UV-VIS absorbance at 224 nm of oleic acid and Fe3O4 OA immediately and 24
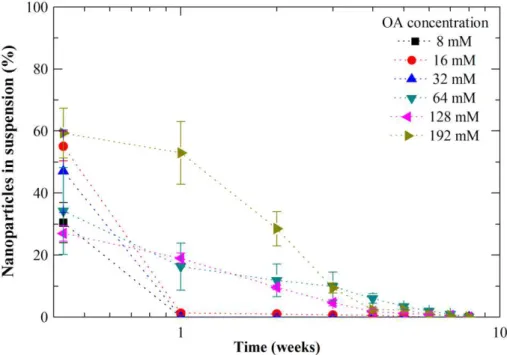
h after sonication for different concentrations of oleic acid. ... 62 Figure 3.18. Mass of Fe3O4 OA NPs in suspension (%) along time for the tested oleic acid
concentrations. ... 62 Figure 3.19. UV-VIS spectra of triton X-100 Fe3O4 NPs immediately and after 24 h of
sonication, at different triton X-100 concentrations. ... 63 Figure 3.20. UV-VIS absorbance at 222 nm of triton X-100 and Fe3O4 TX, immediately and
24 h after sonication for different concentrations of triton X-100. ... 64 Figure 3.21. Mass of Fe3O4 TX NPs in suspension (%) along time for the tested triton X-100
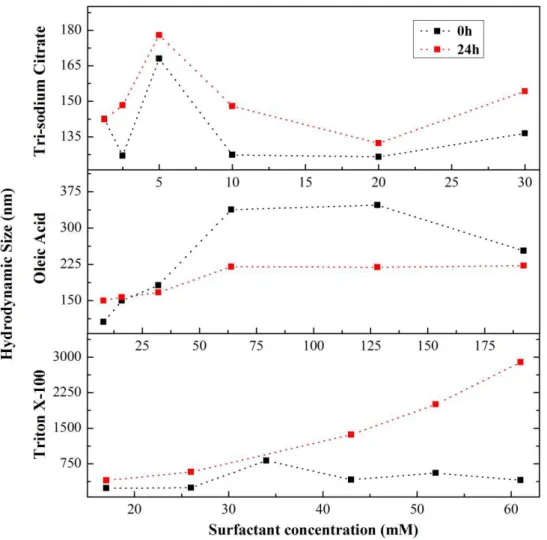
concentrations. ... 64 Figure 3.22. Hydrodynamic diameter of coated magnetic nanoparticles with six
concentrations of each tested surfactant, 0 h and 24 h after sonication. ... 65 Figure 3.23. Magnetic characterization of pristine Fe3O4 nanoparticles: (A) Zero-field cooled
and field cooled results; (B) Magnetization vs. applied magnetic field at 320 and 10 K. ... 66 Figure 3.24. Magnetic characterization of tri-sodium citrate Fe3O4 nanoparticles: (A)
Zero-field cooled and Zero-field cooled results for TC 1.25 mM and TC 30 mM; (B) Magnetization vs. applied magnetic field at 320 K for TC 1.25 mM and TC 30 mM. ... 67 Figure 3.25. Magnetic characterization of oleic acid Fe3O4 nanoparticles: (A) Zero-field
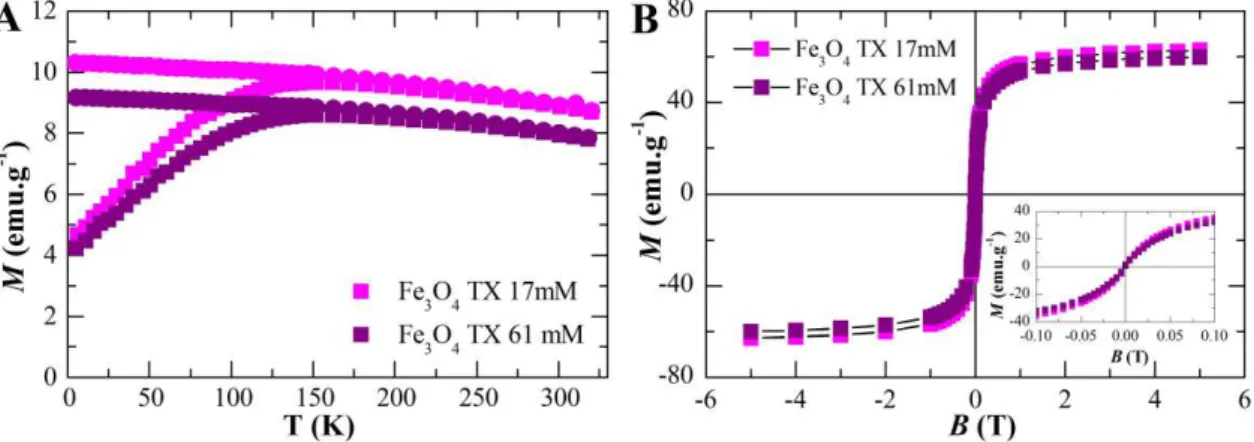
applied magnetic field at 320 K for TX 17 mM and TX 61 mM. ... 68 Figure 3.27. FTIR spectra of pristine Fe3O4 nanoparticles coated with 0% (black line), 8%
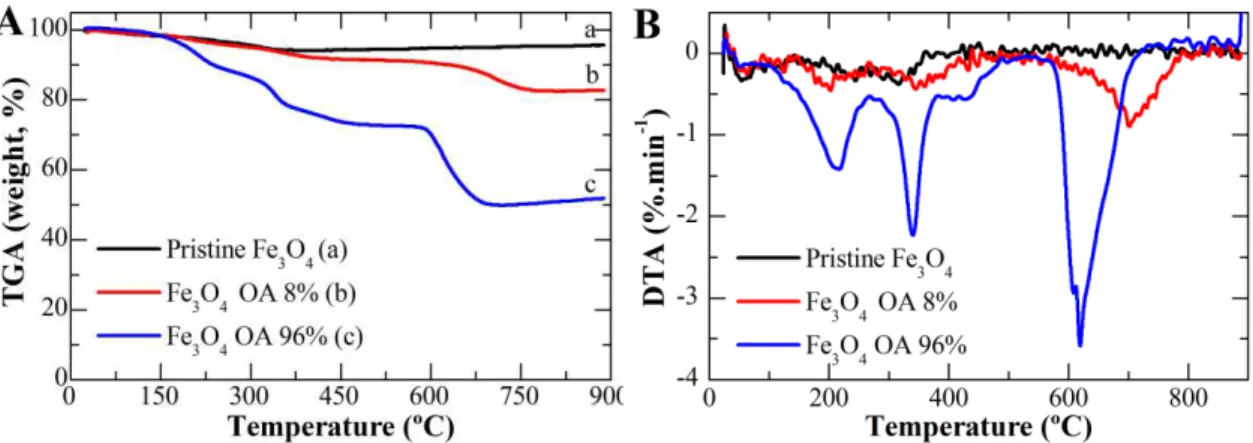
(red line) 32% (green line) and 96% (blue line) of oleic acid. ... 71 Figure 3.28. TGA (A) and DTA (B) of pristine Fe3O4 NPs and coated with 8% and 96% of
oleic acid. ... 71 Figure 3.29. Graphical representation of zeta potential of oleic acid coated iron oxide
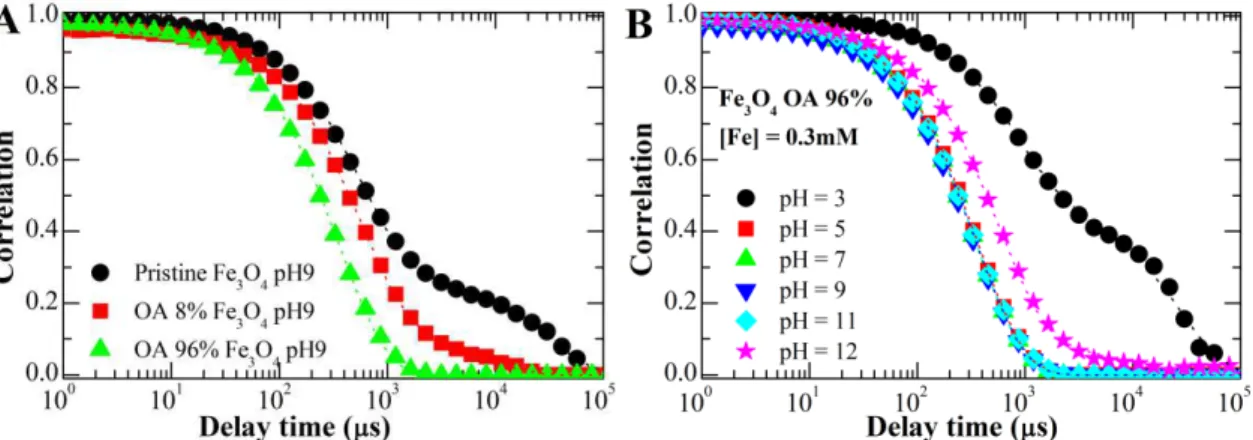
nanoparticles as a function of pH for an iron concentration of 1.25 mM. ... 72 Figure 3.30. Comparison of measured (dots) and adjusted (lines) correlation curves of
dynamic light scattering measurements between (A) pristine Fe3O4, OA 8% Fe3O4 and
OA 96% Fe3O4 at pH9, and (B) OA 96% Fe3O4 at different pH: 3, 5, 7, 9, 11 and
12. ... 73 Figure 3.31. Measured vs calculated hydrodynamic diameter for pristine Fe3O4 NPs, OA 8%
Fe3O4 NPs, and OA 96% Fe3O4 NPs at pH 9. The calculated hydrodynamic diameters
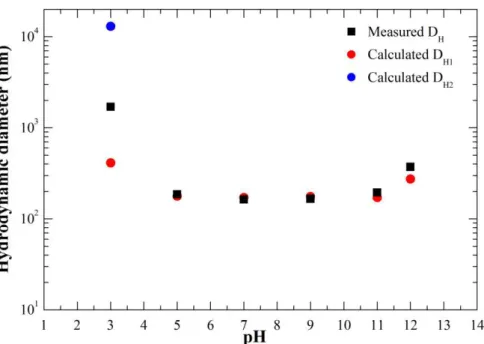
were obtained using the above-described method of the cumulants expansion... 75 Figure 3.32. Measured vs calculated hydrodynamic diameter in the range of pH measured
for OA 96% Fe3O4 NPs. ... 75
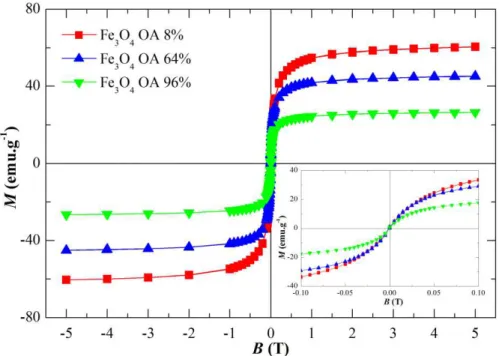
Figure 3.33. Magnetization vs. applied magnetic field of oleic acid coated iron oxide NPs, for different surfactant concentration: 8%, 64%, and 96%. ... 77 Figure 3.34. X-ray patterns of iron oxide nanoparticles produced thermal decomposition
technique. ... 78 Figure 3.35. FTIR spectra of Fe3O4 nanoparticles produced by thermal decomposition
technique. ... 78 Figure 3.36. TEM image of pristine Fe3O4 TD NPs and their respective size distribution
graph. ... 79 Figure 3.37. Magnetic characterization of Fe3O4 TD NPs: (A) Zero-field cooled and field
cooled results; (B) Magnetization vs. applied magnetic field at 320 and 10 K. ... 79 Figure 4.1. Chemical structure of chitin or chitosan, depending on the deacetylation degree
(DD). Chitin is present when DD < 50%, while chitosan has a DD > 60%. Besides the deacetylation degree, the structure of both biopolymers is similar. ... 89 Figure 4.2. Chemical structure of chitosan and some of its derivatives. ... 95 Figure 4.3. FTIR spectrum of initial chitosan before depolymerisation with a molecular
weight of 469 kDa. ... 107 Figure 4.4. FTIR spectra of four low molecular weight chitosan samples obtained from
the polymer. ... 109 Figure 4.6. Schematic representation of the O-HTCC reaction mechanism. ... 110
Figure 4.7. FTIR spectra of O-HTCC and the two reaction intermediates... 111
Figure 4.8. A) 1H-RMN of O-HTCC; B) 13C-RMN of O-HTCC... 112
Figure 4.9. TGA and DTA of chitosan (CS 469 kDa) and O-HTCC 469 kDa... 113
Figure 4.10. Schematic representation of the ionic interaction between chitosan and TPP. ... 114 Figure 4.11. FTIR spectra of chitosan (CS), tripolyphosphate (TPP) and chitosan
nanoparticles (NP CS). ... 114 Figure 4.12. TGA (A, C) and DTA (B, D) of chitosan and chitosan nanoparticles, O-HTCC
and O-HTCC nanoparticles, respectively. ... 115
Figure 4.13. Photograph of chitosan nanoparticles prepared by ionotropic gelation using different concentrations of TPP and chitosan. ... 116 Figure 4.14. Results from the first step of the dynamic light scattering study for CS and O
-HTCC NPs: hydrodynamic diameter as a function of TPP concentration (wt.%) for two different chitosan and O-HTCC concentrations. ... 117
Figure 4.15. Hydrodynamic diameter of chitosan and O-HTCC nanoparticles produced with
different polymer concentrations (0.2 and 0.4 wt.%) and molecular weight (469 – 50 kDa). ... 118 Figure 4.16. Hydrodynamic diameter of polymeric NPs produced using an initial CS (A) or
O-HTCC (B) concentration of 0.2 wt.% and TPP 0.1 wt.% measured immediately, 24 h
and 48 hours after NPs production... 118 Figure 4.17. Influence of the pH of the initial solution of TPP and of stirring. Hydrodynamic
diameter of CS and O-HTCC NPs produced (A, C) without and (B, D) with stirring as
a function of polymer molecular weight. ... 119 Figure 4.18. Hydrodynamic diameter of O-HTCC nanoparticles prepared without stirring,
with magnetic stirring and with sonication. ... 120 Figure 4.19. Hydrodynamic diameter of CS and O-HTCC NPs produced under optimal
conditions as a function of the polymer molecular weight. The results are expressed as the average ± standard deviation for 3 independent experiments. *p<0.05 compared with chitosan nanoparticles with similar molecular weight. ... 121 Figure 4.20. Zeta potential of chitosan and O-HTCC nanoparticles prepared under optimal
pristine Fe3O4 produced by thermal decomposition (NPs CS Fe3O4 TD)... 122
Figure 4.22. X-ray patterns of pristine Fe3O4 NPs, chitosan (CS), and chitosan coated Fe3O4
NPs (NP CS Fe3O4). ... 123
Figure 4.23. TGA and DTA of chitosan nanoparticles (NP CS), chitosan coated Fe3O4 NPs
(CS Fe3O4) and pristine Fe3O4 nanoparticles produced by chemical precipitation. ... 124
Figure 4.24. Hydrodynamic diameter of chitosan nanoparticles and chitosan coated pristine Fe3O4 and Fe3O4 TD nanoparticles as a function of chitosan molecular weight... 124
Figure 4.25. Comparison of measured (dots) and adjusted (lines) autocorrelation curves of dynamic light scattering measurements between (A) chitosan coated pristine Fe3O4 NPs
and (B) chitosan coated Fe3O4 TD NPs. ... 125
Figure 4.26. Magnetic characterization of chitosan coated pristine Fe3O4 nanoparticles (A)
Zero-field cooled and field cooled results for chitosan of high molecular weight (469 kDa), (B) Magnetization vs. applied magnetic field at 320 K for chitosan of high molecular weight (469 kDa); (C) ZFC and FC results for chitosan of low molecular weight (38 kDa); (D) Magnetization vs. applied magnetic field at 320 K for chitosan of low molecular weight (38 kDa). ... 126 Figure 5.1. Schematic representation of a typical antibody molecule, i.e., an IgG molecule.
The molecule is composed of four polypeptide chains, two identical heavy chains and two identical light chains, bounded by disulfide bonds. Each chain is composed of several different domains. The antigen-binding site is formed where a heavy-chain variable domain (VH) and a light-chain variable domain (VL) come close together
(Adapted from [5, 9])... 137 Figure 5.2. Inhibition of cancer cell survival and invasion by pharmacologic inhibition of CA
IX (adapted from [31]). ... 145 Figure 5.3. Flow cytometry analysis of MDA-MB-231 cell line expression of CA IX extra-
(A) and intracellular (B). Gray histogram corresponds to the negative staining control, i.e., cells stained with only the secondary antibody. ... 150 Figure 5.4. Confocal microscopy of MDA-MB-231 and SaOs-2 cell lines stained with
commercial anti-CA IX mAb (Green) and TO-PRO3 (Red) for the nucleus. ... 151 Figure 5.5. Western blot analysis of total lysates from SaOs-2 and MDA-MB-231 cell lines
treated with commercial mAb anti-CA IX ... 152 Figure 5.6. Flow cytometry analysis of murine serum immunized with CA IX N-terminal
corresponds to the negative control, i.e., cells stained treated with only the secondary antibody. Red histogram corresponds to the supernatant from 3B5 hybridoma cells and the blue one to 3G9... 154 Figure 5.8. Flow cytometry analysis of hybridoma supernatant producing N-terminal antigen
using Samos cell line (A) and MDA-MB-231 cell line (B) 8 months after fusion. Gray histogram corresponds to the negative control, i.e., cells stained with only the secondary antibody. Red histogram corresponds to the supernatant from 3B5 hybridoma cells and the blue one to 3G9... 154 Figure 5.9. Fluorescence microscopy of MDA-MB-231 and SaOs-2 cell lines treated with
hybridoma supernatant 3G9 producing N-terminal anti-CA IX mAb (Green) and TO-PRO3 (Red) for the nucleus. ... 155 Figure 5.10. Dot blot analysis of 3B5 hybridoma supernatant producing N-terminal anti-CA
IX mAb using CA IX protein as target. ... 156 Figure 5.11. Flow cytometry analysis of hybridoma supernatant containing central peptide
antibodies using SaOs-2 (A) and MDA-MB-231 (B) cell lines, 3 months after fusion. Gray histogram corresponds to the negative control, i.e., cells stained with only the secondary antibody. Red histogram corresponds to the supernatant from 3D2 hybridoma cells, green histogram corresponds to supernatant 4C5 and the blue histogram corresponds to supernatant 1D3. ... 156 Figure 5.12. Fluorescence microscopy of MDA-MB-231 and SaOs-2 cell lines treated with
hybridoma supernatant containing central peptide anti-CA IX mAb (Green) and TO-PRO3 (Red) for the nucleus staining. ... 157 Figure 5.13. Dot blot analysis of hybridoma supernatant containing central peptide anti-CA
IX mAb using CA IX protein as target. ... 157 Figure 5.14. Western blot analysis of total lysates from SaOs-2 and MDA-MB-231 cell lines
stained with 3D2 hybridoma supernatant containing antibodies against the central peptide of CA-IX. ... 158 Figure 6.1. World map representing the distribution per region of clinical trials related with
hyperthermia and cancer (Source: www.clinicaltrials.gov. Search terms: ‘hyperthermia’ and ‘cancer’. Date of search: August 2015). ... 167 Figure 6.2. Temperature variation generated by pristine Fe3O4 during 40 minutes of an AC
magnetic field application with intensity of 24 kA.m-1 and 418.5 kHz as a function of
magnetic field application with intensity of 24 kA.m-1 and 418.5 kHz of frequency as a
function of iron concentration... 175 Figure 6.4. SAR values as a function of surfactant concentration for different iron
concentrations at 8, 12, 18 and 24 kA.m-1of the AC magnetic field strength, with a fixed
frequency of 418.5 kHz. ... 177 Figure 6.5. Temperature variation as a function of iron concentration generated by pristine
Fe3O4 NPs (black dots) and Fe3O4 OA NPs with different surfactant concentrations: 8%
(red dots) 64 mM (green dots) and 96% (pink dots) generated by the application of an AC magnetic field, for 10 minutes, with intensity of 24 kA.m-1 and with 418.5 kHz of
frequency. ... 178 Figure 6.6. Comparison of SAR values of pristine and coated NPs in agar phantoms and
water. The results are expressed as the average ± standard deviation for 3 independent experiments. * p<0.05 compared with the respective agar sample. ... 179 Figure 6.7. Comparison of SAR values of Fe3O4 TD NPs samples in water solution at an iron
concentration of 71.6 mM. The results are expressed as the average ± standard deviation for 3 independent experiments. ... 183 Figure 6.8. Generated temperature by Fe3O4 TD 3 NPs during 10 minutes of an AC magnetic
field application with intensity of 24 kA.m-1 and 418.5 kHz of frequency as a function
of iron concentration. ... 183 Figure 6.9. Generated temperature by pristine Fe3O4 (A), Fe3O4 TC 10 mM, (B) and Fe3O4
OA 64 mM (C) during 10 minutes of an AC magnetic field application with intensity of 24 kA.m-1 and 418.5 kHz of frequency as a function of iron concentration. Comparison
between bare Fe3O4 NPs, not freeze-dried and freeze-dried (FD) chitosan-coated Fe3O4
NPs is displayed for each case. ... 184 Figure 6.10. Comparison of SAR values of freeze-dried polymer-coated Fe3O4 NPs. Fe3O4
NPs were coated with either CS or O-HTCC of low and high molecular weight. The
results are expressed as the average ± standard deviation for 3 independent experiments. ... 185 Figure 6.11. Transverse relaxation rate (1/T2) for Fe3O4 OA 96% NPs at different pH: 5, 7,
and 9, as a function of iron concentration. ... 186 Figure 6.12. Vero cell line viability after 24 h exposition to four types of iron oxide
nanoparticles: pristine Fe3O4, Fe3O4 TC 10 mM, Fe3O4 OA 64 mM, and Fe3O4 TD. Data
is expressed as average ± standard deviation for at least three independent experiments. *p<0.05, **p<0.005, ***p<0.001 compared to untreated control cells. ... 188 Figure 6.14. Vero cell line viability after 24 h exposition to chitosan NPs at 38 and 469 kDa,
and to O-HTCC NPs at 48 and 469 kDa. Data is expressed as average ± standard
deviation for at least three independent experiments. *p<0.05, **p<0.005, ***p<0.001 compared to untreated control cells. ... 189 Figure 6.15. SaOs-2 cell line viability after 24 h exposition to chitosan NPs at 38 and 469
kDa, and to O-HTCC NPs at 48 and 469 kDa. Data is expressed as average ± standard
deviation for at least three independent experiments. *p<0.05, **p<0.005, ***p<0.001 compared to untreated control cells. ... 189 Figure 6.16. Vero and SaOs-2 cell line viability before and after 24 h exposition to
hyperthermia with and without the presence of pristine Fe3O4 NPs at 1 mg.ml-1. Data is
expressed as average ± standard deviation for at least three independent experiments. *p<0.05, **p<0.005, ***p<0.001 compared to control cells. ... 190 Figure 6.17. Vero and SaOs-2 cell line viability before and after 24 h exposition to magnetic
hyperthermia with and without the presence of pristine Fe3O4 NPs at 5 mg.ml-1. Data is
expressed as average ± standard deviation for at least three independent experiments. *p<0.05, **p<0.005, ***p<0.001 compared to control cells. ... 191 Figure 7.1. Chemical structure of doxorubicin. ... 200 Figure 7.2. Possible mechanisms by which anthracyclines causes cardiac toxicity. The
formation of reactive species is induced by the quinone moiety of anthracyclines and by induction of nitric oxide synthase, leading to nitric oxide and peroxynitrite formation. Another method of anthracyclines cardiotoxicity is to intercalate into nucleic acids, causing suppression of DNA, RNA, and protein syntheses, as well as damaging some transcriptional regulatory proteins that seem important for regulation of cardiac-specific genes. Anthracyclines also accelerate myofilament degradation, leading to a net negative balance of sarcomeric proteins (“cardiac sarcopenia”) and induce changes in adrenergic function and adenylate cyclase as well as abnormalities in Ca2+ handling,
Figure 7.4. FTIR spectra of doxorubicin loaded chitosan nanoparticles (A) and doxorubicin loaded O-HTCC nanoparticles (B). Comparison was performed with DOX alone
(DOX), and two molecular weights of CS, 38 and 469 kDa, and O-HTCC, 48 and 469
kDa. ... 217 Figure 7.5. TGA (A, C) and DTA (B, D) of DOX-loaded chitosan and O-HTCC
nanoparticles, respectively. ... 218 Figure 7.6. A) Effect of doxorubicin amount in its encapsulation efficiency in chitosan
nanoparticles, as a function of chitosan molecular weight; B) Encapsulation efficiency of chitosan nanoparticles as a function of molecular weight, for different CS:TPP ratios; C) Encapsulation efficiency of O-HTCC nanoparticles as a function of molecular
weight, for different O-HTCC:TPP ratio. The results are expressed as average ±
standard deviation for three independent experiments. ... 219 Figure 7.7. Effect of DOX concentration in its encapsulation efficiency in 10 mg of pristine
Fe3O4, Fe3O4 TC 10 mM and OA 64 mM uncoated (A) and coated with chitosan (B) of
low molecular weight (38 kDa). The results are expressed as average ± standard deviation for three independent experiments. ... 220 Figure 7.8. Encapsulation efficiency of doxorubicin in Fe3O4 TD NPs coated with either
chitosan or O-HTCC. The results are expressed as average ± standard deviation for three
independent experiments. ... 221 Figure 7.9. DOX release profile from chitosan nanoparticles with a molecular weight of 469
kDa, at pH 4.5 and pH 7.4 at 25 ºC (A) and 37 ºC (B). Insets correspond to a magnification of the burst release in the first 8 h of the experiment. The results are expressed as average ± standard deviation for three independent experiments. ... 223 Figure 7.10. Free DOX release profile from a dialysis bag at 37 ºC at three mediums with
different pH: 4.5, 6.5, and 7.4. Inset corresponds to a magnification of the burst release in the first 8 h of the experiment. The results are expressed as average ± standard deviation for three independent experiments. ... 223 Figure 7.11. DOX release profile from freeze-dried chitosan nanoparticles with a molecular
weight of 469 kDa, at pH 4.5, 6.5, and 7.4 at 37 ºC. The results are expressed as average ± standard deviation for three independent experiments. ... 224 Figure 7.12. DOX release profile from freeze-dried chitosan and O-HTCC nanoparticles with
at 37 ºC. The results are expressed as average ± standard deviation for three independent experiments. ... 226 Figure 7.14. DOX release profile from CS NPs (A), CS-coated pristine Fe3O4 NPs (B), CS
Fe3O4 NPs stabilized with tri-sodium citrate 10 mM (C) and oleic acid 64 mM (D), and
CS Fe3O4 TD NPs (E) at pH 4.5, pH 6.5, and pH 7.4 at 37 ºC. The results are expressed
as average ± standard deviation for three independent experiments. ... 227 Figure 7.15. DOX release profile from CS NPs with 0.5 mg (A), 1.5 mg (B) and 6 mg (C) of
pristine Fe3O4 NPs at pH 4.5, pH 6.5, and pH 7.4 at 37 ºC. The results are expressed as
average ± standard deviation for three independent experiments... 228 Figure 7.16. DOX release profile from O-HTCC NPs (A), O-HTCC-coated pristine Fe3O4
NPs (B), O-HTCC Fe3O4 NPs stabilized with tri-sodium citrate 10 mM (C) and oleic
acid 64 mM (D), and O-HTCC Fe3O4 TD NPs (E) at pH 4.5, pH 6.5, and pH 7.4 at 37
ºC. The results are expressed as average ± standard deviation for three independent experiments. ... 230 Figure 7.17. DOX release profile from O-HTCC NPs with 0.5 mg (A), 1.5 mg (B) and 6 mg
(C) of pristine Fe3O4 NPs at pH 4.5, pH 6.5, and pH 7.4 at 37 ºC. The results are
expressed as average ± standard deviation for three independent experiments. ... 231 Figure 7.18. Example of the data sheet obtained using DDSolver program in fitting the
Table 3.1. Tested concentrations of the three stabilizing agents used (tri-sodium citrate, oleic acid and triton X-100)... 48 Table 3.2. Magnetic properties of pristine Fe3O4 NPs and Fe3O4 NPs coated with a lower and
higher concentration of the used stabilizers: tri-sodium citrate (TC), oleic acid (OA) and triton X-100 (TX). The magnetic properties shown are blocking temperature (TB)
obtained from the maximum value of the ZFC curve, saturation magnetization (MS) at
10 K and 320 K, and coercivity (Hc) at 10 K (at 320 K there was an absence of coercivity
for all tested samples). ... 69 Table 4.1. Studied conditions by dynamic light scattering to optimize the production of
chitosan and O-HTCC nanoparticles. ... 104
Table 4.2. Results from dilute solution viscosity, comparing the amount of NaNO2 used, the
intrinsic viscosity ([]) and the obtained average viscosimetric molecular weight (Mv). ... 110
Table 5.1. Monoclonal antibodies currently approved for cancer treatment (adapted from [8, 10]). ... 141 Table 5.2. Human CA isozymes known so far, their CO2 hydrase activity, sub-cellular
localization and some examples of their tissue distribution. ... 143 Table 6.1. Tested conditions to evaluate the influence of the stabilizers (oleic acid and sodium
tri-citrate) in the heating ability of the iron oxide colloids. ... 172 Table 6.2. Estimated Brownian (B) or viscous and Néel (N) or magnetic relaxation times
for pristine and tri-sodium citrate (TC) 10mM and oleic acid (OA) 64 mM iron oxide nanoparticles both in water and agar 1% wt. ... 180 Table 6.3. Tested conditions to optimize the synthesis of iron oxide NPs by thermal
decomposition technique. ... 181 Table 7.1. Summary of the most used mathematical models for drug delivery systems ... 212 Table 7.2. Amount of polymer, iron oxide nanoparticles (Fe3O4 NPs), doxorubicin (DOX)
and sodium tripolyphosphate (TPP) used for the preparation of DOX-loaded NPs. . 222 Table 7.3. DOX release profile from not freeze-dried chitosan nanoparticles at different
molecular weights (Mv): parameters values and R2adj obtained from fitting the
mathematical models to experimental data. ... 235 Table 7.4. DOX release profile from freeze-dried chitosan nanoparticles at different
molecular weights (Mv): parameters values and R2adj obtained from fitting the
mathematical models to experimental data. ... 237 Table 7.6. DOX release profile from freeze-dried CS NPs (38 kDa) with pristine Fe3O4,
Fe3O4 TC 10 mM, Fe3O4 OA 64 mM and Fe3O4 TD: parameters values and R2adjobtained
from fitting the mathematical models to experimental data. ... 239 Table 7.7. DOX release profile from freeze-dried CS NPs (469 kDa) with different amounts
of pristine Fe3O4 NPs (0.5 mg, 1.5 mg, and 6 mg): parameters values and R2adj obtained
from fitting the mathematical models to experimental data. ... 241 Table 7.8. DOX release profile from freeze-dried O-HTCC NPs (48 kDa) with pristine Fe3O4,
Fe3O4 TC 10 mM and Fe3O4 OA 64 mM: parameters values and R2adj obtained from
fitting the mathematical models to experimental data. ... 242 Table 7.9. DOX release profile from freeze-dried O-HTCC NPs (469 kDa) with different
amounts of pristine Fe3O4 NPs (0.5 mg, 1.5 mg and 6 mg): parameters values and R2adj
obtained from fitting the mathematical models to experimental data... 243 Table 8.1.Optimal conditions obtained from the experimental word during this PhD thesis
for the theranostic core: average diameter measured by transmission electron microscopy (TEM), saturation magnetization (MS), total amount of doxorubicin (DOX)
released over 72 h; specific absorption rate (SAR) obtained from magnetic hyperthermia measurements; and relaxation times T1 and T2 obtained from nuclear magnetic resonance measurements. ... 256 Table 8.2. Optimal conditions obtained from the experimental word during this PhD thesis
for the theranostic system: average hydrodynamic diameter (DH) measured by dynamic
3D Three-Dimensional
Ab Antibody
AC Alternating Current
ACF Auto-Correlation Function
ADCC Antibody-Dependent Cellular Toxicity AMF Alternating Magnetic Field
AML Acute Myeloid Leukemia
ANLL Acute Non-Lymphocytic Leukemia ATR Attenuated Total Reflectance Bax Bcl-2 Associated X-protein BCRP Breast Cancer Resistance Protein bFGF Basic Fibroblast Growth Factor
BSA Bovine Serum Albumin
CA Carbonic Anhydrase
CARP CA Related Protein
cDNA Complementary DNA
CDR Complementary Determining Regions CLL Chronic Lymphocytic Leukemia CMC Complement Mediated Cytotoxicity
CS Chitosan
CSC Cancer Stem Cell
CTLA-4 Cytotoxic T-Lymphocyte Antigen 4
DA Degree of Acetylation
DC Direct Current
DLS Dynamic Light Scattering
DLVO Derjaguin-Landau-Verwey-Overbeek DMEM Dulbecco’s modified Eagle’s medium
DNA Deoxyribonucleic acid
DNR Daunorubicin
DOX Doxorubicin
DSC Differential Scanning Calorimetry DTA Differential thermal analysis
DTPA DiethyleneTriaminePentaacetic Acid EE Encapsulation Efficiency
EGF Epidermal Growth Factors
EGFR Epidermal Growth Factor Receptor EMA European Medicines Agency
EpCAM Epithelial Cell Adhesion Molecule
EPI 4’-epi-doxorubicin
EPR Enhanced Permeability and Retention
FC Field-cooled
FCS Fetal Calf Serum
FDA Food and Drug Agency
FTIR Fourier Transform Infrared spectrometer
GTMAC Glycidil TriMethyl Ammonium Chloride
HA Hydroxyapatite
HAMA Human Anti-Mouse Antibodies HIF Hypoxia Induced Factor
HIV Human Immunodeficiency Virus
IARC International Agency for Research of Cancer IC50 Half-maximum Inhibitory Concentration
IDA Idarubicin
IFN Interferon
Ig Immunoglobulin
ISO International Organization of Standardization JNK c-Jun N-terminal Kinase
KS Kaposi Sarcoma
LD50 Lethal dose 50%
LDH Lactate Dehydrogenase
mAb Monoclonal Antibody
MDR Multidrug Resistance MFI Mean Fluorescence Intensity
MHC Myosin Heavy Chain
MHS Mark-Houwink-Sakurada
MMAE Monomethyl Auristatin E
MRI Magnetic Resonance Image
mRNA Messenger Ribonucleic Acid
MRP Multidrug Resistance-associated Protein
Mw Molecular Weight
NCAM Neural Cell adhesion Molecule
NHL Non-Hodgkin Lymphoma
NIR Near Infrared
NMR Nuclear magnetic resonance NOS Nitric Oxide Synthase
O-HTCC O-(2-Hydroxyl) propyl-3-Trimethyl ammonium Chitosan Chloride PBS Phosphate Buffer Saline
PEG Polyethylene glycol
PEO Poly (Ethylene Oxide)
PET Positron Emission Tomography
PVA Polyvinyl Alcohol
pVHL Von Hippel-Lindau tumor supressor Protein PZC Point of Zero Charge
RANKL Receptor Activator of NFκB ligand
RCC Renal Cell Carcinoma
RES Reticulo Endothelial System ROS Reactive Oxygen Species SAM Self-Assembled Monolayers SAR Specific Absorption Rate SEM Scanning Electron Microscopy
SPECT Single-Photon Emission Computed Tomography
SQUID Superconducting Quantum Interference Device
TC Tri-sodium Citrate
TD Thermal Decomposition
TEM Transmission Electron Microscopy TGA Thermogravimetric Analysis
TPP Tripolyphosphate
TREG Triethylene glycol
TREM Triethanol amine
TX Triton X-100
VEGF Vascular Endothelial Growth Factor
VIS Visible
w/o Water-in-oil
XRD X-Ray Diffraction
C Concentration
D Diffusion coefficient
Hc Coercivity
H Magnetic field
η Viscosity
m Magnetic moment
M Magnetization
µ0 Magnetic permeability of free space
µ Ionic strength
T Temperature
T1 Transverse relaxation T2 Longitudinal relaxation
τ Relaxation time
V Volume
χ Magnetic susceptibility
ζ Zeta potential
∇ Gradient
Motivation
The present chapter introduces the cancer problem around the world and the need for new treat-ment options. Nanotechnology is presented as a reliable solution for this problem. The thesis’ objectives are subsequently presented as a result of nanotechnology development and its applica-tion in cancer treatment and diagnostic. At the end of this chapter, the outline of the thesis is presented, followed by the scientific contributions that resulted from this PhD.
1.1.
Scientific context
Cancer is a devastating disease of the present days with a huge incidence and related deaths. Everyone knows someone that had, have or will have cancer. It is estimated that each year more than 11 million new cases of cancer are diagnosed, and more than 7 million people die from this devastating disease. If current trends continue, in 2020 new cancer cases will increase to 17 mil-lion, an increase of 30% compared to 2009.
In the past 20 years, the total medical costs of cancer have nearly doubled as a direct consequence of the increasing number of cancer cases. The dramatic increase in the number of cancer cases is because of new cases diagnosed among the aging population base, as well as increasing cancer prevalence [1].
Current cancer treatments, such as radiotherapy and chemotherapy, although effective for some cases, did no cover all of them. In addition, cancer treatment is exhaustive and expensive because of the multi-therapeutic approaches and constant admissions for treatments and side effects man-agement. The majority of cancer treatments are not specific for the type of cancer and for the patient, and treatment monitoring is not accurate.
Osteosarcoma accounts for 8-9% of cancer-related deaths in children and carries an overall 5-year survival rate of 60–70% [2]. Current chemotherapy regimens comprise a group of chemo-therapeutic agents in which doxorubicin are included. However, tumor resistance to anthracy-clines and cardiotoxicity are limiting factors for its usage. Liposomal formulations of doxorubicin improve its anti-cancer effects but are still insufficient.
Consequently, a method that possesses enough versatility to be adapted to the cancer type within a group of cancer types but that, when is applied, has a high specificity for cancer cells, dramati-cally decreasing the side effects, is required. Moreover, if this method allows cancer diagnose and treatment monitoring, although may seem ambitious and expensive at a first glance, will become economically favorable for the patient and for the medical institution. By reducing the side effects, reduces the number of hospital admissions and the costs of side effects management. By increas-ing treatment effectiveness, reduces the number of treatments required and improves patients’ quality of life.
Nanotechnology is a recent technology with a huge potential for medicine, among other applica-tions. Properties like increased surface area, optical, electronic, magnetic, and structural proper-ties at nanometer scale are not available for bulk solids or individual molecules, making these materials unique. The development of new materials based on multi-functional magnetic nano-particles can open a window of opportunity for a new therapeutic approach to osteosarcoma treat-ment. There is currently significant interest in designing new drug delivery systems with the ob-jective of achieving targeted drug delivery.
1.2.
Objective
sensitization or death of tumor cells by magnetic hyperthermia. In addition, the magnetic core provides the basis for the treatment monitoring through magnetic resonance imaging.
To achieve this objective, several tasks were developed:
1. Production and characterization of superparamagnetic iron oxide nanoparticles with diameters in the nanometric range, stable in physiological conditions and able to generate heat by the appli-cation of an alternating external magnetic field.
2. Production and characterization of chitosan and O-HTCC nanoparticles with diameters in the
nanometric range, stable in physiological conditions. Further, both polymers were used to coat iron oxide nanoparticles produced in task 1.
3. Production of a highly specific monoclonal antibody for CA IX (a glycoprotein over expressed in osteosarcoma).
4. Study the suitability of the produced nanoparticles for application in magnetic hyperthermia, as a contrast agent for magnetic resonance image, and as a drug delivery system for doxorubicin.
1.3.
Thesis outline
The following section is an outline of the chapters in this thesis:
Chapter 1: Motivation – This chapter presents the motivation and the objectives of the present
PhD thesis.
Chapter 2: General Introduction – This chapter reviews some of cancer’ bullet points, such as
current treatments and statistics. A brief insight on osteosarcoma is also given. Finally, nanotech-nology is presented as an alternative for cancer treatment and diagnosis.
Chapter 3: Iron oxide nanoparticles – This chapter starts with an introduction to iron oxide
nanoparticles synthesis, colloidal stability, and properties. The detailed methodology for the pro-duction and characterization of the studied iron oxide nanoparticles is provided, and the main results obtained are presented and discussed.
Chapter 4: Chitosan-based coating – Chitosan and chitosan’s derivatives properties and
appli-cations are summarized in this chapter. Methods for producing chitosan nanoparticles are re-viewed and a detailed methodology for the production and characterization of chitosan and O
Chapter 5: Monoclonal antibody production – A summary of state of the art concerning
mon-oclonal antibodies’ properties and their production is provided in the beginning of this chapter, that also includes a detailed methodology for production and evaluation of monoclonal antibodies anti-CA IX, and the obtained results are presented and discussed.
Chapter 6: Theranostic part I: Magnetic hyperthermia, MRI, and cytotoxicity – This chapter
contains a brief overview on magnetic hyperthermia and magnetic resonance imaging, presents and discuss the results obtained in both techniques, and the cytotoxic behavior of the produced nanoparticles.
Chapter 7: Theranostic part II: Drug release studies – This chapter is related to doxorubicin
as a model drug, giving an insight on its usage and drawbacks. Moreover, the potential of chitosan as a drug delivery system and the mathematical models used are reviewed. Drug delivery studies are presented and discussed, and mathematical models are fitted to the experimental data to eval-uate the release behavior of the produced nanoparticles.
Chapter 8: Conclusions and Perspectives – In this final chapter are presented the main
conclu-sions of this PhD thesis and provides new perspectives for future work.
1.4.
Scientific contribution
The main contributions of this PhD thesis were published in peer-reviewed journals, as book chapters, and presented in international conferences.
The list of publications supporting this thesis is the following:
Paula Soares, Isabel Ferreira, Rui Igreja, Carlos Novo, João Paulo Borges. Application of
hyperthermia for cancer treatment: recent patents review. Recent patents on anti-cancer drug discovery, 7(1): 64-73, 2012.
Paula Soares, Sérgio Dias, Carlos Novo, Isabel Ferreira, João Paulo Borges. Doxorubicin vs.
ladirubicin: methods for improving osteosarcoma treatment. Mini reviews in medicinal chem-istry, 12 (12): 1239-1249, 2012.
Ana Baptista, Paula Soares, Isabel Ferreira, and João Paulo Borges. Nanofibers and
nanopar-ticles in biomedical applications, Chapter 4. Bioengineered Nanomaterials book edited by Atul Tiwari and Ashutosh Tiwari, CRC Press (Taylor & Francis Group), USA, 2013.
Paula Soares, Ana Alves, Laura Pereira, Joana Coutinho, Isabel Ferreira, Carlos Novo, João
Paula Soares, Isabel Ferreira, João Paulo Borges. Application of Hyperthermia for Cancer
Treatment: Recent Patents Review, Chapter 9. Topics in Anti-Cancer Research, Vol. 3, book edited by Atta-ur-Rahman and Khurshid Zaman, Bentham Science Publishers, USA, 2014.
Paula Soares, Frederik Lochte, Coro Echeverria, Laura Pereira, Joana Coutinho, Isabel
Ferreira, Carlos Novo, João Paulo Borges. Thermal and Magnetic Properties of Iron Oxide Colloids: influence of surfactants. Nanotechnology, 26, 425704, 2015.
Paula Soares, César Laia, Alexandra Carvalho, Laura Pereira, Joana Coutinho, Isabel
Ferreira, Carlos Novo, João Paulo Borges. Iron oxide nanoparticles stabilized with a bilayer of oleic acid for magnetic hyperthermia and MRI applications, submitted.
Paula Soares, Diana Machado, César Laia, Laura Pereira, Joana Coutinho, Isabel Ferreira,
Carlos Novo, João Paulo Borges. Thermal and magnetic properties of chitosan-coated iron oxide nanoparticles, submitted.
Paula Soares, Ana Isabel Sousa, Jorge Silva, Isabel Ferreira, Carlos Novo, João Paulo Borges.
Chitosan-based nanoparticles as drug delivery systems for doxorubicin: optimization and modelling, submitted.
Paula Soares, Ana Isabel Sousa, Isabel Ferreira, Carlos Novo, João Paulo Borges. Composite
chitosan-based iron oxide nanoparticles as drug delivery systems for doxorubicin: optimiza-tion and modelling. Under preparaoptimiza-tion.
Other publications
Vanessa Zamora-Mora, Paula Soares, Coro Echeverria, Rebeca Hernández, Carmen
Mijangos. Composite Chitosan/Agarose Ferrogels for Potential Applications in Magnetic Hy-perthermia. Gels, 1, 69-80, 2015.
Coro Echeverria, Paula Soares, Ana Robalo, Laura Pereira, Carlos Novo, Isabel Ferreira, João
Paulo Borges. One-pot synthesis of dual-stimuli responsive hybrid PNIPAAm-chitosan mi-crogels. Materials and Design. 86, 745-751, 2015.
Conference contributions
Oral presentation
Paula Soares, Isabel Ferreira, João Paulo Borges. Studies on Thermal and Magnetic
Paula Soares, Isabel Ferreira, João Paulo Borges. Multifunctional Nanoparticles for Cancer
Theranostic. 4th World Congress on Cancer Science & Therapy, October 20-22, 2014, Chi-cago, USA.
Poster presentation
Paula Soares, Isabel Ferreira, Carlos Novo, João Paulo Borges. Chitosan and O-HTCC
nano-particles. NanoPortugal International Conference 2013, 13-15 February 2013, Porto,
Portu-gal.
Paula Soares, Isabel Ferreira, João Paulo Borges. Iron oxide colloids as Hyperthermia agents. 26th Annual Conference of ESB, 31 August – 3 September 2014, Liverpool, England.
1.5.
References
General introduction
The present chapter gives a brief overview of the cancer problem, illustrating the gaps in its treat-ment options. Some cancer statistics are shown for better understanding of the global burden of cancer. Theranostic systems are a reliable alternative for management of cancer in men. As such, the basic structure of a theranostic system is presented and discussed. Finally, the most recent applications of both magnetic nanoparticles and chitosan nanoparticles in cancer treatment and diagnostic are reviewed.
2.1.
Cancer
Cancer is a generic term used for a group of more than 100 diseases that can affect any part of the body. It is defined as a disease in which a group of abnormal cells grows uncontrollably, disre-garding the signals that regulate cell cycle of normal cells. In some cases, cancer cells become able to invade other tissues, a process referred to as metastasis [1, 2].
Cancer can be caused by either genetic factors or environmental factors. Environmental factors include not only carcinogens such as tobacco smoke, alcohol, and infectious diseases, but also age, diet, excess body weight, among others. Carcinogens are by definition any substance, radio-nuclide, or radiation that is an agent directly involved in the promotion of cancer or in the facili-tation of its propagation. These substances have the ability to damage the genome or to disrupt cellular metabolic processes after prolonged or excessive exposure [1].
acting together to change disease susceptibility. These usually occur at a young age and are fre-quently aggressive [2, 3].
Certain viruses can also cause cancer by persistent mucosal or epithelial cell colonization, which leads to chronic inflammation. Hepatitis B and C can cause hepatocellular cancer, human papil-loma viruses can cause cervical cancer, and the bacterium Helicobacter pylori is responsible for
gastric cancer. The combined effects of increased inflammation and epithelial cell turnover can promote the phenotypic and genotypic changes that may ultimately progress to malignant trans-formation. In the inflammatory process, some mediators are release, such as cytokines, chemo-kines and free radicals, which play an important role in carcinogenesis [4].
The hallmarks of cancer
Although there are several factors that can lead to tumor development, all cancer cells have de-fects in the regulatory circuits that govern normal cell proliferation and homeostasis. The dereg-ulation of the production and release of growth-promoting signals, cancer cells become masters of their own destinies [5]. Taking the basic teachings of cell biology into account in which all mammalian cells carry a similar machinery to regulate their proliferation, differentiation and death, Hanahan and Weinberg [5] defined rules that govern the transformation of normal human cells into malignant cancers. These six essential alterations in cell physiology are manifested as different cancer genotypes, although they are shared in common by most or even all human tu-mors. The six hallmarks of cancer defined by these authors in 2000 are the following:
Self-sufficiency in growth signals: tumor cells are able to stimulate their own growth;
Insensitivity to anti-growth signals: the inhibitory signals that normally govern normal cells proliferation and homeostasis do not have affect tumor cells;
Evasion of programmed cell death (apoptosis): tumor cells are able to evade apoptosis and survive;
Limitless replicative potential: contrary to normal cells, tumor cells are able to replicate indef-initely;
Sustained angiogenesis: tumors are able to stimulate the growth of blood vessels to supply nutrient to their own cells;
Tissue invasion and metastasis: tumor cells are able to invade local tissues and spread to distant sites.
survive, proliferate, and disseminate. However, a decade of research later led to a change in the notion that tumor development was exclusively dependent on the tumor cells. Instead, to a better understanding of the biology of tumors, one must consider the contribution of the tumor micro-environment. Tumors are complex tissues composed of multiple distinct cell types that participate in heterotypic interactions with one another [6].
Tumor microenvironment
In the last decade, the tumor microenvironment was recognized to be of critical importance for the understanding of fundamental cancer biology. Nowadays, cancer is known to be composed not only by a mass of malignant cells, but also by other cells that are recruited and that can be corrupted by the transformed cells. The close interaction between malignant and non-transformed cells create the tumor microenvironment [7, 8].
The non-malignant component of the tumor microenvironment often has a dynamic and tumor-promoting function at all stages of cancer development. For example, intracellular communica-tion is achieved by a complex and dynamic network of cytokines, chemokines, growth factors, and inflammatory and matrix remodeling enzymes. The evolution, structure and activities of the tumor microenvironment has many similarities with the wound healing and inflammation process [8]. In fact it is well demonstrated that human tumors are generally infiltrated by inflammatory cells, which demonstrates that the host is not ignorant of the developing tumor; instead, the host tries to interfere with tumor progression, a process referred as immune surveillance [9].
The tumor microenvironment of a developing tumor is composed of proliferating tumor cells, the tumor stroma, blood vessels, infiltrating inflammatory cells and a variety of associated tissue cells [9]. The non-malignant cells of the tumor microenvironment can comprise over 50% of the mass of primary tumors and their metastasis, although in some cases their biology and function is still unclear. However, it is clear that in both hematological cancers and solid tumors there is a Dar-winian evolution of malignant cells, leading to heterogeneous mutations within single tumors and at different sites of metastasis [8].
The next generation of cancer hallmarks
Genomic instability and mutation in cancer cells;
Inflammatory state of premalignant and frankly malignant lesions.
In addition, two other attributes of cancer cells have been proposed to be functionally important for the development of cancer and were therefore added to the list of core hallmarks:
Deregulating cellular energetics;
Avoiding immune destruction.
The first attribute is a consequence of the need to support continuous cell growth and prolifera-tion, which involves a major reprogramming of cellular energy metabolism. In this case, the met-abolic program that operates in most normal tissues and fuels the physiological operations of the associated cells is replaced. The second attribute is related to an active evasion by cancer cells from attack and elimination by immune cells. In both cases, these two attributes may facilitate the development and progression of many forms of human cancers [6].
The six core hallmarks defined in 2000 provide a solid framework for understanding the complex biology of cancer. Nevertheless, the extended concept of cancer hallmarks and the definition of the emerging hallmark capabilities and enabling characteristics have provided the basis for the development of new means to treat human cancer. The understanding of the tumor microenviron-ment functionality and importance during tumorigenesis is crucial for the developmicroenviron-ment of new and more effective cancer treatments.
Current treatments
There are several treatments available for cancer including surgery, i.e., removal of tumor cells, radiotherapy that uses radiation to kill tumor cells, chemotherapy with cytotoxic drugs and bio-therapy that is usually targeted bio-therapy.
Surgery
The majority of long-term cancer survivors have been treated largely because of the surgical re-moval of their solid tumor. Even in the disseminated stages of disease, the surgical rere-moval of isolated organ metastases may offer a realistic chance for cure, for example, following resection of liver or lung metastases in patients with colorectal or other types of cancer [10].
expected functional and cosmetic outcome, the skill of the individual surgeon, the efficacy and availability of other treatment modalities, the morbidity and mortality of the operation itself, and the patient's willingness to accept the associated risk(s) [10].
Radiotherapy
Radiation therapy (RT) is based upon use of ionizing radiation as part of cancer treatment to control malignant cells. Radiotherapy may be used for curative or adjuvant cancer treatment. To-day, more than 50% of newly diagnosed cancer patients receive radiation therapy, typically as a part of curative combined modality treatment with surgery and/or chemotherapy. Additionally, a majority of patients who present with metastatic disease or who develop metastases following initial cancer treatment require palliative radiation therapy [11].
The interaction of ionizing radiation with various types of biologic materials or media (e.g., air, soft tissue, bone) is a random process, with frequency and density of energy deposition. As human cells and tissues (as well as tumors) are mainly considered dilute aqueous solutions containing biomolecules, the localized but randomly distributed energy depositions from ionizing radiation can have either direct effects on important biomolecules such as DNA or indirect effects produced by intermediate radiation products resulting from interactions with water. This interactions pro-duce highly reactive species like the hydroxyl radical (•OH) among many other types of free radicals produced by ionizing radiation, including DNA free radicals resulting from direct ioni-zations that cause chemical damage to DNA [11].
Radiation side effects can be divided into acute and chronic. Acute radiation sequel such as skin desquamation, mucositis, and diarrhea, occur during or immediately following treatment. Such side effects are believed to be due to the interruption of repopulation of rapidly proliferating tis-sues. The type of reaction is dependent on the site irradiated. Chronic reactions, such as, fibrosis, fistula, and necrosis, occur months to years following treatment and are due, in part, to damage in slowly proliferating tissues. Chronic reactions, like acute ones, are dependent upon the irradi-ated site; chronic reactions, however, are often permanent. Overall, the risk of a second malig-nancy following RT is low. The notable exception is osteosarcoma arising in irradiated bones in children treated for retinoblastoma, particularly the hereditary type [12].
Chemotherapy