Synthesis of functionalized fluorescent silver nanoparticles
and their toxicological effect in aquatic environments
(Goldfish) and HEPG2 cells
Elisabete Oliveira1,2*, Hugo M. Santos1, Javier Garcia-Pardo3, Mário Diniz1, Julia Lorenzo3,
Benito Rodríguez-González4, José L. Capelo1and Carlos Lodeiro1*
1Bioscope Group, REQUIMTE, Chemistry Department, Faculty of Science and Technology, University Nova of Lisbon, Lisbon, Portugal 2Veterinary Science Departments, CECAV, University of Trás-os-Montes and Alto Douro, Vila Real, Portugal
3Institut de Biotecnologia i Biomedicina and Departament de Bioquímica i de Biologia Molecular, Universitat Autònoma de Barcelona, Bellaterra, Barcelona, Spain 4Scientific and Technological Research Assistance Centre (CACTI), University of Vigo, Vigo, Spain
Edited by:
Luís A. D. Carlos, University of Aveiro, Portugal
Reviewed by:
Jun Lin, Chinese Academy of Sciences, China
Iztok Turel, University of Ljubljana, Slovenia
*Correspondence:
Elisabete Oliveira and Carlos Lodeiro, Bioscope Group,
REQUIMTE, Chemistry Department, Faculty of Science and Technology, University Nova of Lisbon, Caparica Campus, 2825-366 Lisbon, Portugal e-mail: ej.oliveira@fct.unl.pt; cle@fct.unl.pt
Silver nanoparticles, AgNPs, are widely used in our daily life, mostly due to their antibacterial, antiviral, and antifungal properties. However, their potential toxicity remains unclear. In order to unravel this issue, emissive AgNPs were first synthetized using an inexpensive photochemical method, and then their permeation was assessedin vivo in goldfish and in vitroin human hepatoma cells (HepG2). In addition, the oxidative stress caused by AgNPs was assessed in enzymes such as glutathione-S-transferase (GST), catalase (CAT), and in lipid peroxidation (LPO). This study demonstrates that the smallest sized AgNPs@3promote the largest changes in gold fish livers, whereas AgNPs@1were found to be toxic in HEPG2 cells depending on both the size and functionalized/stabilizer ligand.
Keywords: silver nanoparticles, fluorescence, cytotoxicity, goldfish, human hepatoma cells
INTRODUCTION
Silver nanoparticles (AgNPs) have gained momentum due to their use in imaging, catalysis, electronics, photonics, and photogra-phy (Evanoff and Chumanov, 2005; Dahl et al., 2007; Liang et al., 2007; Pastoriza-Santos and Liz-Marzán, 2008). In addition, med-ical devices and therapeutic products containing AgNPs also offer health benefits, such as antibacterial, antiviral, and antifungal properties. Because of such properties, AgNPs are of the focus of precautions and regulations related to public health and envi-ronmental risks (Faunce and Watal, 2010). In the USA there are more than 260 commercialized products containing AgNPs, such as cleaners, clothing, and personal care products (Faunce and Watal, 2010). Silver itself is known to be highly toxic in cells, but AgNP toxicity still has been target of studies. AgNPs can form protein-silver complexes, which according toin vitrostudies, can be deposited in the liver, kidney, lungs, brain, and/or skin, as they are highly toxic to mammalian liver cells, stem cells, and brain cells (Hussain et al., 2005; Landsdown, 2007).
The US National Institute for Occupational Safety and Healthy (NIOSH) has established an exposure limit of 0.01 mg/m3for all
forms of silver (Drake and Hazelwood, 2005). In 2010, nanosil-ver was considered one of the 15 issues that can negatively affect the conservation of biological diversity (Sutherlandm et al., 2010). The experts are concern about the wide use of nanosilver, not mainly because of the direct poisoning in humans or produc-tion of bacterial resistance in hospital setting, but due to their highlyin vitrotoxicity for aquatic organisms and capability to
persist in the environment. Silver and its forms can be release in the environment into waste streams, such as from photographic development, which has been the major source of ecological toxicity (Luoma, 2008).
Toxicological studies of Ag nanoparticles with different diam-eters, 36, 52, and 66 nm have been reported in freshwater envi-ronments through the use ofDaphnia magna. It was found that within the concentration range of 3–4µg/L, toxicity is not size-dependent (Li et al., 2010). Comparative studies of gold and AgNPs reveal that the silver ones are the most toxic (Hussain et al., 2005). Regarding AgNP synthesis, the most common and straightforward approach is based on reductive methods, using sodium borohydrate, sodium citrate, or irradiation (Lee and Meisel, 1982; Chau et al., 2005). To avoid particle aggregation, this is often done in the presence of additives such as organic molecules, peptides (Lodeiro et al., 2010; Oliveira et al., 2011a,b), or polymers. Usually metal nanoparticles do not present fluores-cence emission, due to the electron transfer from the AgNP metal core to the additive.
On the other hand in some cases, the presence of other types of additives in the surrounding AgNPs enhances their photophysical properties, such as luminescence (Tam et al., 2007). Research into fluorescent nanoparticles has thus, increased steadily in the last few years, because fluorescence can be tracedin vivoandin vitro
The localization of the SPR band depends on several parameters, such as, size, shape and the refractive index of the environment (Si et al., 2007; Belser et al., 2009).
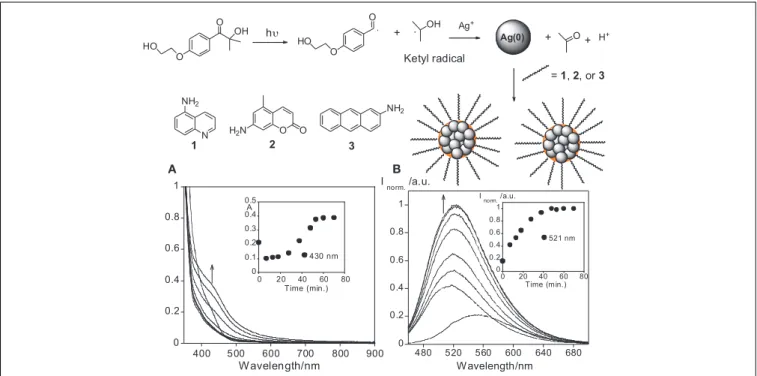
Maretti et al. (Maretti et al., 2009) published a new easy method based on the photochemical synthesis of fluorescent AgNPs, which can be used in imaging applications. In Maretti’s method, the AgNPs were stabilized by cyclohexylamine, and the metal is reduced by ketyl radicals.
For “Proof of Concept” of the study viability in a complex organism and in cell cultures, AgNP permeation and toxic-ity were carried out in vivo in gold fish (Carassius auratus), whilst cytotoxicological studies were performedin vitroin human hepatoma cells. AgNPs were synthetized with a new easy and inexpensive method, which was developed by varying Maretti’s method (Maretti et al., 2009), using (1)5-Aminoisoquinoline,
(2)7-amino-4-methylcoumarin, and(3)2-Aminoanthracene as additives. AgNP formation was monitored by UV-Vis and fluo-rescence emission spectroscopy, matrix-assisted laser desorption ionization time of flight mass spectrometry (MALDI-TOF MS), dynamic light scattering (DLS), transmission electron microscopy (TEM), and high-resolution transmission electron microscopy (HRTEM).
MATERIALS AND METHODS
CHEMICALS AND STARTING MATERIALS
5-Aminoisoquinoline, 7-amino-4-methylcoumarin, and 2-Aminoanthracene, 2-Hydroxy-4′ -(2-hydroxyethoxy)-2-methyl-propiophenone (I-2959) were commercially from Aldrich. Ag(CF3SO3) was from Fluka. All were used without further
purification.
PHYSICAL MEASUREMENTS
Instruments
The samples were exposed to ultraviolet light at 365 nm, in a com-mon UVA lamp, 230 V, 50 Hz, Serial n◦MO31975, Ambientáls.
Particles size distribution
The nanoparticle size distributions were measured using DLS, a Malvern Nano ZS instrument with a 633 nm laser diode.
TEM measurements
To perform the TEM images, the samples were prepared by drop-ping 1µL of the colloidal suspension onto a copper grid coated with a continuous carbon film and allowing the solvent to evap-orate. TEM and HRTEM images were obtained using a JEOL JEM 2010F transmission electron microscope (TEM) operat-ing at 200 kV. To perform the Fourier transformations, we used Digital Micrograph (Gatan) software. Data for size distribution histograms were obtained by measuring more than 100 particles per sample in several TEM images (Saìnchez-Iglesias et al., 2006).
MALDI-TOF-MS studies
The MALDI-MS analyses were performed in a MALDI-TOF-TOF-MS model Ultraflex II Bruker, Germany, equipped with nitrogen. Each spectrum represents accumulations of 5×50 laser shots. The reflection mode was used. The ion source and flight tube pressure were less than 1.80×10⁻⁷ and 5.60×10⁻⁸Torr,
respectively. The MALDI mass spectra of the soluble samples (1 or 2µg/µL) were recorded using the conventional sample preparation method for MALDI-MS. 1µL of ligand was placed on the sample holder. The sample holder was inserted in the ion source.
Photophysical measurements
Absorption spectra were recorded on a JASCO V-650 spec-trophotometer and fluorescence emission on a FLUOROMAX-4 HORIBA SCIENTIFIC spectrofluorometer.
Synthesis of silver nanoparticles
In an quartz cell 1.02×10⁻²M of I-2959, 3.4×10⁻³M of Ag(CF3SO3), and 2.0×10⁻⁴M of compounds1, 2, or3, were added to a 3 mL of THF solution. The spectral changes were observed upon irradiation. Thereafter, the nanoparticles obtained were washed several times by centrifugation, in order to remove the unreacted products.
Cell culture
Human hepatocellular carcinoma HepG2 cell line (ATCC HB-8065), derived from human hepatocytes, was maintained in a Minimum Essential Medium (MEM) alpha medium supple-mented with 10% (v/v) heat inactivated fetal bovine serum (FBS) in a highly humidified atmosphere of 95% air with 5% C02at 37◦C.
Cytotoxicity of the AgNPs
The cytotoxicity of AgNPs (1, 2, and 3) was tested in human HepG2 cells. Cells were seeded into a 96-well plate at a cell density of 6.0×10³ cell/well and incubated for 24 h before AgNPs were added at a concentration of 25 and 100µg/ml. The growth inhibitory effect was measured after 72 h treat-ment by the XTT assay (Cory et al., 1991; You et al., 2012). Aliquots of 20µl of XTT solution [2,3-bis-(2-methoxy-4-nitro-5-sulfophenyl)-2H-tetrazolium-5-carboxanilide] were added to each well. After 3 h, the color formed was quantified by a spec-tophotometric plate reader (Perkin Elmer Victor3V) at a 490 nm wavelength. Cell cytotoxicity was evaluated in terms of cell-growth inhibition in treated cultures and expressed as a % of the control conditions. Trypan Blue is one of the many dye recom-mended exclusion staining, counting and evaluation of cellular population and acute cellular toxicity (Wong et al., 2006) tech-niques. This method is based on the principle that the living cells do not incorporate the dye, whereas dead cells incorporate it owing to their damaged membrane. Cells treated with 100µg/ml concentration of AgNPs for 72 h were rinsed with PBS, stained with 0.2% Trypan Blue (Invitrogen) for 5 min and observed by microscopy.
CLSM in vivo imaging of AgNP-Treated HEPG2 cells
Imaging was performed immediately at 37◦C and 5% CO
2on a
Leica TCS SP5 confocal microscope using a 63×1.4 numerical aperture Plan Apochromat oil-immersion lens. Acquired images were processed using Bitplane Imaris 7.2.1 software.
Flow cytometry of AgNP-treated cells
The cellular uptake of AgNPs (1, 2, and 3) was carried out via flow cytometric measurements. To perform the experiments 3.0×10⁵HepG2 cells per plate were seeded in 6-well plates (BD Falcon). After 24 h treatments with 25 and 100µg/ml of AgNPs (1,2, and3), cells were collected and centrifuged. Cells were then rinsed and resuspended in 1 ml of PBS. Flow cytometry analysis was performed with FACSCalibur flow cytometry at an emission wavelength of 488 nm.
In vivo studies
Goldfish (Carassius auratus) were obtained from local producers (N=6 per treatment, average weight: 10.2±3.4 g) and accli-mated for 2 weeks to laboratory conditions in 400 L polystyrene. The fish were housed in a closed circuit system with filtered tap water at a temperature of 20±1◦C, pH 7.2±0.2, and continuous aeration and fed daily with commercial feed flakes (TetraMin). Following synthesis, AgNps were injected in fish by an intraperitoneal injection to evaluate their ability of inter-nalization in fish tissues. Thus, two assays (A and B) with a total of 24 animals were carried out.A—Intraperitoneal injec-tion of AgNPs in PBS (1:10); B—Intraperitoneal injection of AgNPs diluted in corn oil (1:10). After injection, fish were maintained in 15 L polystyrene tanks, with de-chlorinated tap water, photoperiod 12:12 h light/dark (L/D and continuous aer-ation (dissolved O2 > 6 mg/L). Control fish were housed in the same laboratory conditions but were injected intraperi-toneally with (a) a solution of PBS (phosphate buffer solution), (b) a solution of PBS and THF (1:10); and (c) a solution of PBS and corn oil (1:10). After 48 h fish, including controls, were sacrificed by cervical sectioning and dissected with the aid of scissors, a scalpel and forceps, and the liver and intestine removed. Samples from organs were stored at−80◦C for fur-ther analysis and ofur-ther subsamples were taken for histological processing.
Total Glutathione-S-Transferase (GST) activity was deter-mined as described by Habig et al. (Habig et al., 1974) by measuring the formation of the conjugate of glutathione (GSH) and 1-chloro-2,4-dinitrobenzene (CDNB). Briefly, 180µL of substrate solution (Dulbecco’s Phosphate Buffered Saline with 200 mM L-glutathione reduced and 100 mM CDNB all from Sigma-Aldrich, Germany) were added to 20µL of GST stan-dard or sample into each well of a 96-well microplate. The total enzyme activity was determined at 340 nm by recording the absorbance at every minute for 6 min, using a microplate reader (BioRad Benchmark, USA). Equine liver GST (Sigma-Aldrich, Germany) was used as standard and positive control. The change in absorbance per minute (λA340) was estimated and the reaction
rate at 340 nm was determined using CDNB extinction coeffi-cient of 0.0096µM−1cm−1. The results are expressed in relation
to total protein concentration of the sample (nmol min1mg1total protein).
Catalase(CAT) activity was determined as previously described by Aebi (Aebi, 1984), which follows the decrease in absorbance at 240 nm by H2O2 consumption. Briefly, A substrate
solu-tion of 0.036% (w/w) H2O2 was prepared in buffer 50 mM
KH2PO4 (Sigma-Aldrich, Germany) pH 7.0 containing 1 mM
EDTA (Riedel-Haën, Germany), at 25◦C using 30% (w/w) H2O2 (Sigma-Aldrich, Germany). To perform the assay, 0.1 mL of CAT standard or sample were added to 2.9 mL of the substrate solu-tion in individual quartz cuvettes and absorbance at 240 nm was recorded every 30 s for 180 s (at 25◦C, pH 7.0, and path length 10 mm), using a spectrophotometer (Unicam Helios, UK). The consumption of peroxide was monitored using a extinction coeff. 0.04 mmol−1cm−1. Bovine liver CAT (Sigma-Aldrich, Germany)
was used as standard and positive control.
Lipid peroxides assay adapted from TBARS (thiobarbituric acid substances) protocol was determined by the quantification of a specific end-product of the oxidative degradation process of lipids, the malondialdehyde (MDA). In this assay thiobarbi-turic acid reacts with MDA to produce a fluorescent product detected spectrophotometrically at 532 nm. Briefly, samples were treated with 8.1% dodecyl sulfate sodium, 20% trichloroacetic acid (pH 3.5), thiobarbituric acid, mixture of n-butanol and pyridine (15: 1, v/v) (Correia et al., 2003). To quantify the lipid peroxides, MDA concentrations were calculated with the computer program Microplate Manager 4.0 (BIO-RAD, USA) based on an eight-point calibration curve (0–0.3µM TBARS) using MDA bis(dimethylacetal) (from Merck). The enzymatic results are expressed in relation to total protein of the sample (nmol/min/mg) calculated following the procedure described by Bradford (Bradford, 1976) using albumin as a standard.
The histological procedures were carried out essentially according to Martoja and Martoja (Martoja and Martoja, 1967). Briefely, after being fixed in Bouin-Hollande’s for 48 h, samples were washed in distilled water and dehydrated through a series of graded ethanol solutions and toluene (Lab-Scan, Belgium) for intermediate impregnation. Organs were embedded in paraffin (Panreac, Spain), cut in sections of 5µm thickness and mounted in glass slides. Paraffin was removed from slides using xylene as solvent, followed by rehydration in a graduate series of alco-hols, washing with demineralized water, then glycine (0.3 M) and staining (5 min.) with toluidine blue-O (0.5%) prepared from a solution of NaBH4(1%) for further histological analysis. Staining
with toluidine blue O allows quenching of auto-fluorescence and enhances the fluorescence of nano-emissive particles (Kiernan, 2008). The presence of emissive NPs within tissues was assessed using a Leica microscope (Leica-ATC 2000, Germany), with an image system from Leica Microsystems (DMLB model) adapted for epifluorescence and equipped with an EL6000 light source for mercury short-arc reflector lamps was used. For tissue microscope analysis I3 (blue) and N2.1 (green) filters were employed.
Statistical analysis
RESULTS AND DISCUSSION
The photosynthesis of the AgNPs was performed in a quartz cell followed by the addition of I-2959, AgCF3SO3, and the
chromophore (1, 2, or3) in a THF solution, with subsequent exposure to a UVA lamp at 365 nm. The I-2959 acts as a source of ketyl radicals, which are known to be strong reducing agents, allowing the reduction of silver ions in the presence of (1)
5-Aminoisoquinoline, (2) 7-amino-4-methylcoumarin, and (3)
2-Aminoanthracene (seeFigure 1). The chosen compounds1–3
have all their absorption spectrum in the UV region, since the lamp used for photochemical synthesis via irradiation was at λ=365 nm. Moreover, all compounds present an amine group in the chemical skeleton in order to be used for surface nanoparticle attachment.
After UV irradiation at λ=365 nm, the AgNPs with com-pound1showed a red shift from 410 to 430 nm, and an increase in absorbance at 430 nm up to 40 min after UV exposition (see
Figure 1A). Similar behavior over time has been reported in pre-vious studies on the nucleation of gold nanoparticles; in these works the abrupt jump in absorbance corresponds with the particle nucleation burst (Chow and Zukoski, 1994; Rodríguez-González et al., 2007). In the emission spectra, a blue shift from 550 to 521 nm was observed, as well as an enhancement in the emission intensity at 521 nm (seeFigure 1B). The growth plot also shows a long tail in the range 550–600 nm after 30 min (see
Figure 1A). This is most likely due to the formation of larger
AgNPs aggregates. Interestingly, the maximum emission inten-sity observed was reached at 40 min. This matches the nucleation burst time as highlighted by the plot of absorbance as a function of time (seeFigure 1A).
Nanoparticles stabilized with compound2, AgNPS@2, showed an increase in the absorbance detected at 420 nm up to 20 min after irradiation. However, at values up to 10 min, a new small band at 600 nm was observed, also revealing the presence of nanoparticle aggregates (seeFigure SI1A). Once again, there was an emissive band at 510 nm (seeFigure SI1B).
A similar behavior was obtained for AgNPs@3, with the appearance and increase in the absorbance at 450 nm and the emission at 490 nm. However, an exposure of longer than 10 min UV light induced nanoparticle aggregation, as only 10 min was the best time for nanoparticle formation. Overall nanoparticle formation was confirmed in this case by the greenish emission, and was also detected be the naked eye by the change from colorless to yellow. The yellow color of the dispersion is a strong indication of nanoparticle forma-tion, because it is related to the appearance of the plasmon band in the UV region, which is characteristic of AgNPs. TEM images revealed that the AgNPs obtained were almost spherical.
Average sizes of 10±1.6, 4.0±0.9, and 2.8±0.6 nm, were obtained from TEM images for the AgNPs with additives1,2,and
3, respectively, (seeFigure 2).
AgNP stability was confirmed by the zeta potential, where the values of−40±5 mV, −38±4 Mv, and −50 mV ± 5 mV indicated high stability, for1,2,and3, respectively. Taking into account the spectral data mentioned above, it was concluded that the additive directly influences nanoparticle formation. This is most likely due to the increasing number of donor atoms, which leads to a displacement in the emission wavelength, as well as an increase in nanoparticle size.
0 0.2 0.4 0.6 0.8 1
480 520 560 600 640 680
I
norm. /a.u.
W avelength/nm
0 0.2 0.4 0.6 0.8 1
0 20 40 60 80 521 nm I norm. /a.u.
Time (m in.) B
0 0.2 0.4 0.6 0.8 1
400 500 600 700 800 900
W avelength/nm
0 0.1 0.2 0.3 0.4 0.5
0 20 40 60 80 430 nm A
Time (min.) A
O HO
O
OH h
O HO
O
+ OH
Ketyl radical Ag+
+ O+ H+
O
N H2N O
NH2
1 2 3
NH2
Ag(0)
=1,2, or3
0 20 40 60 80 100
2 3 4 5 6 7 8 AgNPs (2)
Mean : 4.0 nm Std. D ev. : 0.9 nm
Size (nm)
C
ount
0 20 40 60 80 100
0 1 2 3 4 5 6 7 8
AgNPs (3)
Co
u
n
t
Size (nm) Mean : 2.8 nm Std. Dev. : 0.6 nm 0
10 20 30 40 50
6 7 8 9 10 11 12
AgNPs (1)
C
ount
Size (nm) Mean : 10 nm Std. Dev. : 1.6 nm
A B
D E F
G H
C
I
0 1 x 1 05
2 x 1 05 3 x 1 05
1 0 0 2 0 0 3 0 0 4 0 0 5 0 0 6 0 0 7 0 0 8 0 0 9 0 0
I / a .u .
m /z A g
1 A g
2 A g
3
0 5 0 0 1 0 0 0 1 5 0 0 2 0 0 0
1 0 0 0 1 5 0 0 2 0 0 0 2 5 0 0 3 0 0 0 I /a .u .
m /z * A g1 1
* A g 1 3
* A g1 5 A g1 9 * A g
2 1
* *
A g
1 7
J
FIGURE 2 | (A,D,E,G) TEM image of AgNPs with compound 1 (A), 2 (D,E), and 3 (G). (B,H) High-resolution transmition electron microscopy (HRTEM) image of AgNPs with 1 (B) and 3 (H). Size
histogram of nanoparticles with 1 (C), 2 (F), and 3 (I). (J) MALDI-TOF MS spectra of AgNPs with compound 1 in THF without matrix.
Figures 2A–I shows the TEM, HRTEM and size histogram
of the AgNPs synthetized in this work. The histograms were obtained from multiple TEM images such as those shown in
Figure 2. The histograms show a small difference in size distri-bution, which is due to the different influence of1to3additives on the silver nanoparticle fabrication.
The particles shown inFigure 2are larger than the clusters reported in Maretti’s work (Maretti et al., 2009). According to the literature (Liz-Marzán, 2006; Pompa et al., 2006) the col-lective oscillation of the electrons leads to the appearance of an absorption band, known as a plasmon band. It is well known that the plasmon absorption band does not involve the presence of
an emission band, which is why in bare nanometer sized silver particles are not found in any emission band.
The question that now arises is what is the origin of the observed fluorescence in these samples? Some authors have pointed to the presence of silver clusters (Agn, n=2–8) in the samples as the main source of the emission band (Zhang et al., 2005; Vosch et al., 2007). Maretti reports that the clusters are predominantly of type Ag2 and are likely to be supported by
larger nanometer sized particles, such as the particles shown in
Figure 2. In our case highly emissive AgNPs were also obtained,
sized nanoparticles shown inFigure 2. The joining of nanoparti-cles and clusters on the surface could form a very strong emission ensemble (Maretti et al., 2009; Rao and Pradeep, 2010). Due to the small size of the clusters and their relatively low stability under the electron bean, it is quite difficult to image them by HRTEM.
MALDI-TOF-MS STUDIES
In order to confirm the clusters hypothesis, we carried out mass spectrometry experiments to demonstrate the presence of Ag clusters in the samples. In all cases cluster formation was con-firmed by MALDI-TOF MS. Peaks at 108.0, 215.2, 322.3, 970.0, 1186.0, 1401.9, 1617.7, 1833.5, 2049.3, 2265.2 m/z, correspond-ing to the species Ag1, Ag2, Ag3, Ag9, Ag11, Ag13, Ag15, Ag17, Ag19,
and Ag21for compound1(seeFigure 2J) were found. The results
also revealed that stabilizers do not affect cluster formation, where the same silver species were found for all the compounds.
Cytotoxicological studies in goldfish
Depending on their size, AgNPs could permeate through skin and the intestine, and then be accumulated in the liver, lung, blood, kidney, and/or stomach. In order to evaluate the perme-ation and toxicity of nanoparticles, cytotoxicological studies were performedin vitroin human hepatoma cells andin vivostudies in goldfish (Carassius auratus). The studiesin vivowere carried out by analyzing oxidative stress [lipid peroxidation (LPO) and CAT], phase II biotransformation of xenobiotics GST, and histological examination.
Enzymes such as GST or CAT are part of the antioxidant sys-tem responsible for the elimination of radicals and molecules produced as a consequence of oxidative stress. The GST is a family of phase II detoxification enzymes that catalyze the conjugation of glutathione (GSH) to a wide variety of endogenous and exoge-nous electrophilic substances, such as drugs, toxins, and products of oxidative stress, and therefore, they play an important role in preventing oxidative damage (Habig et al., 1974; Hayes et al., 2005). The results of the GST activity measured in the intestines and liver of fish treated with the AgNPs are shown inFigure 3. The GST levels determined in livers were higher than in the intestines. This is because liver is the major metabolic and detoxification organ in living organisms.
The results show a general trend to increase GST activity in injected fish compared to controls. Statistical analysis of the results of GST activity in fish organs (Figure 3I) revealed signifi-cant differences (p<0.05) between controls, intestines and livers from fish injected with the AgNPs3A (diluted in PBS). For fish injected with AgNP3B (diluted in corn oil) significant differences were found in livers compared to controls. These results suggest that fish injected with AgNPs3are subjected to higher oxidative stress than when they are injected with other AgNPs.
In a different study, Chae et al. (Chae et al., 2009) tested two different AgNP dosages in Japanese medaka (Oryzias latipes) and quantified GST (as well as other markers) by measuring the mRNA concentrations in liver extracts. They found that these two AgNPs led to high toxicity thus, causing cellular and DNA dam-age, as well as carcinogenic and oxidative stresses. In contrast, Kwok et al. (Kwok et al., 2012) showed that different AgNP coat-ings (citrate, gum Arabic and polyvinylpyrrolidone) influence
FIGURE 3 | (I) GST, (II) CAT, and (III) MDA concentrations in the liver and intestine tissues ofCarassius auratustreated with AgNPs for 48 h.Data are presented as means±SD. The asterisks indicate significant differences (p<0.05) in comparison to controls. A—Intraperitoneal injection of AgNPs in PBS (1:10); B—Intraperitoneal injection of AgNPs diluted in corn oil (1:10). Legend: control (a) PBS (phosphate buffer solution), control (b) a solution of PBS and THF (1:10); and control (c) a solution of PBS and corn oil (1:10).
toxicity in the early life of Japanese medaka. Exposure assays showed that citrate and polyvinylpyrrolidone exhibited similar and lower toxicity, however, all the AgNPs coated were three to ten times less toxic than AgNO3.
The decomposition of H2O2(Maehly and Chance, 1954)
et al., 2010; Powers et al., 2011). On the other hand, no signifi-cant CAT response in the hepatocyte cultures of fish exposed to AgNPs was observed (Scown et al., 2010). In our studies no dif-ferences were found between injected fish and controls, as shown inFigure 3II.
LPO has been shown to cause various negative effects in terms of cellular integrity in the membranes of the cells (which may lose permeability and function) as well as other changes such as the production of pro-inflammatory agents and potentially toxic substances (Greenberg et al., 2008). LPO is commonly used as an indicator of oxidative stress in cells and tissues (Botsoglou et al., 1994). An increase in LPO in the intestine and livers was observed for the fish injected, as shown inFigure 3III. However, signifi-cant differences (p<0.05) were detected only in intestines and livers from fish injected with AgNPs3A and3B compared to con-trols. These results are generally in agreement with GST and CAT results.
Livers from all the controls showed normal histology, while livers from fish injected with AgNPs presented morphologi-cal changes varying from subtle to moderate according to the type of AgNP (e.g., tissue degeneration, chromatin condensation,
pyknosis) since AgNP3cause larger significant changes in livers. No significant changes in tissues were detected by the histological examination of the intestines. However, other authors have found alterations in tissues or cells following exposure to AgNPs (Choi et al., 2010; Farmen et al., 2012).
In order to verify the toxicity of stabilizers1to3, analysis of oxidative stress measured by GST and CAT activities and LPO (MDA content) as indicator of cell damage were carried out. The intraperitoneal injection of 0,0075 mg/g fish weight of stabilizers
1–3, diluted in PBS (1:10), from the statistical point of view do not reveal a significant increase in antioxidant enzymes activities for both organs (liver and intestine). However, a trend for antiox-idant enzymes and MDA increase was observed in livers from fish injected with stabilizer 3. Thus, the results suggest that the con-centrations of compounds injected present no significant toxicity to organisms (seeFigure SI2).
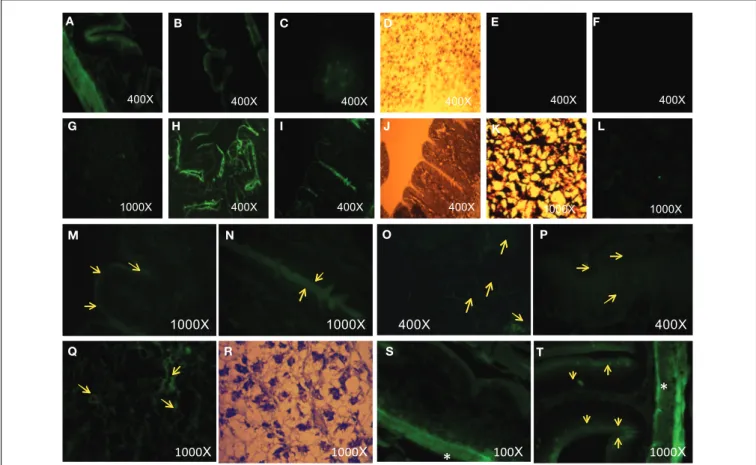
Histological observation by epi-fluorescence microscopy showed that there is evidence of nanoparticles in intestine and liver cells, which was revealed by the presence of small fluorescent clusters (Figure 4) suggesting that the AgNPs had penetrated the tissues and cells.
B
400X
A
400X
D
400X
C
400X
E
400X
F
400X
L
1000X
K
1000X
G
1000X
I
400X
J
400X
H
400X
*
SP
400X
M N
1000X 1000X
O
400X
Q
1000X R
1000X 100X
*
T1000X
FIGURE 4 | (A,B) AgNPs with compound1 in fish intestine: green fluorescence. THF: In fish intestine (E) and liver (F): no fluorescence visible. (C) AgNPs with compound 1 in fish liver: green fluorescence. (D) Bright field optical microscopy of liver (same spot of C). (G,L) AgNPs with compound 2 in fish liver: green fluorescence. (I,H) AgNPs with compounds 2 in fish intestine: green fluorescence. (K,J) Bright
field optical microscopy of liver (K) and intestine (J) (same spot of G and I, respectively.). (M–P,S,T) AgNPs with compound 3 in fish liver: green fluorescence (arrows). (Q,R) AgNPs with 3 in fish liver: green fluorescence (arrowhead as an example). (R) Bright field optical microscopy of liver (same slide spot of Q). (∗) The more intense
Dose-dependent cytotoxicity of AgNPs
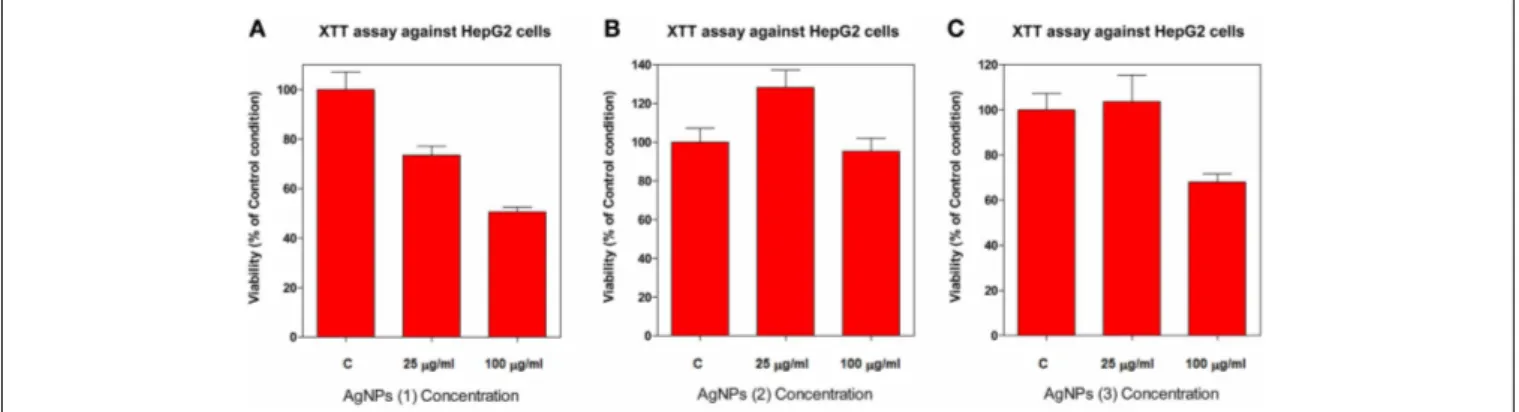
The viability of HepG2 cells, after exposure to AgNPs stabi-lized with compounds1,2, and3, was examined by XTT (Cell Proliferation Assay Kit) assays. The assay measures the amount of XTT reduction by mitochondrial dehydrogenase and assumes that cell viability (corresponding to reductive activity) is propor-tional to the production of purple formazan which is measured spectrophotometrically. Exponentially divided HepG2 cells were treated with two concentrations (25 and 100µg/ml) of each AgNP for 72 h, as described in the experimental section. The result from the XTT assay showed that AgNPs differ greatly in their cyto-toxic properties depending on their stabilizer compound in a dose-dependent manner (Figure 5).
We found that AgNPs stabilized with compound1exerted a cytotoxic effect on HepG2 cells. As shown inFigure 5A, the via-bility of HepG2 cells exposed to these particles for 72 h, decreases from 73.4% at 25µg/ml, to 50.5% at 100µg/ml, when compared with the control (p<0.05). AgNPs stabilized with compound
3 displayed low toxicity at doses up to 100µg/ml, showing a decrease to 68.0% in cell viability (Figure 5C). On the other hand, no cytotoxic effect was observed with AgNPs stabilized with compound2when up to 100µg/ml concentration was assayed (Figure 5B).
Since certain nanoparticles have been suggested to interfere with the XTT assay, HepG2 cells were treated with AgNPs stabi-lized with compounds1,2,and3at 100µg/ml and studied under an optical microscope after staining with trypan blue. Captured images of treated cells with AgNPs stabilized with compound
1 showed a high number of non-viable cells (see Figure SI3). Optical images of HepG2 cell treatments with AgNPs stabilized with compounds2and3did not show significant changes when compared with control cells (Figures SI3CandSI3D), in accor-dance with the results obtained with the XTT assay (Figure SI3E).
Intracellular location of AgNPs
To investigate the biodistribution as well as the ability of AgNPs to enter cells, we examined HepG2-treated cells with 100µg/ml of each AgNP for 24 h using confocal laser scanning microscopy (CLSM). Using CLSM, AgNPs could be observed directly by their reflection and green emission properties. The nucleus and the
cytoplasmatic membrane were stained with DAPI and Cell Mask, respectively. Figure 6 shows the results of in vivo imaging of treated cells with AgNPs stabilized with compound3. A merge image of all the individual channels and a three dimensional reconstruction shows the presence of individual or agglomer-ated nanoparticles inside the cells (indicagglomer-ated with white arrows). Similar results were obtained with AgNPs stabilized with com-pound2. Due to the cytotoxicity observed in AgNPs stabilized with compound1, it was very difficult to visualize nanoparticles in HepG2 cells when cells were treated for 24 h at 100µg/ml of nanoparticle concentration.
As reported, AgNPs can cross the cell membrane via free shut-tle or by damaging the membrane integrity through bonding with thiol-containing proteins (You et al., 2012). We demonstrate here that AgNPs stabilized with compounds2 and3have the abil-ity to penetrate HepG2 cells, while maintaining their fluorescent properties.
Silver nanoparticle uptake by Flow Cytometry
To quantify the cellular uptake of AgNPs, flow cytometry analy-sis of HepG2 cells was performed.Figure SI4represents the flow cytometry analysis (shown as histograms of the FL1-X-Chanel or auto-fluorescence of the nanoparticles) of control cells and HepG2 cells incubated with 25 and 100µg/ml of each AgNP (sta-bilized with compounds1, 2, and 3) for 24 h. Results showed an enhancement of cell fluorescence, with a dose-dependent behavior, for the three AgNPs assayed.
CONCLUSIONS
Using photosynthesized emissive AgNPs containing as addi-tives the organic dyes 5-aminoisoquinoline (1), 7-amino-4-methylcoumarin (2), and 2-aminoanthracene (3), in vivo
andin vitro toxicological studies were successfully performed. Regardingin vivostudies of oxidative stress, AgNPs with3caused larger changes in livers than in intestines with GST level mea-surements, suggesting the importance of the nanoparticle size in terms of its toxicity. Inin vitro studies in HepG2 cancer cells, AgNPs3displayed less toxicity by cell viability measurements, whereas the AgNps with 1 were shown to be the most toxic. The higher oxidative stress revealed in AgNPs with3inin vivo
FIGURE 5 | Dose-dependent cytotoxicity of AgNPs against HepG2 cells. The cytotoxic effect of AgNPs against HepG2 cell line was evaluated by the XTT assay. Cell viability was evaluated
FIGURE 6 | Confocal Laser Scanning Microscopy (CLSM) in vivo images of internalized AgNPs (stabilized with compound 3) in HepG2 cells after 24 h of treatment at 100 µg/ml. Confocal
images obtained of a single channels of nanoparticle fluorescence (green fluorescence), nanoparticle reflection brightness (gray), nuclear
stain (DAPI), and membrane stain (Cell Mask) are shown. Merge images of all individual channels (merge), three dimensional reconstruction (3D) and Z projection (Z) allows to visualize the AgNPs particles into HepG2 treated cells. White arrows indicate the location of internalized AgNPs.
studies by GST level, could be related to the nanoparticles and the inner-dye toxicity used as additive. These results highlight the importance of the molecules in the surrounding nanoparticles.
To date results obtained by various research groups have been very variable and depend on the type and nature of AgNPs, the concentration tested, size, route of exposure together with other factors (e.g., aggregation, dissolution) that may influence NP tox-icity and difficult inter-study comparisons. For instance, there is the possibility that NP functionalization and mode of delivery influence the presence or absence of Ag (I) ions, which are known to be more toxic than AgNPs themselves.
We found that AgNPs synthesized with additives1,2, and3
were able to penetrate tissues and fish cells, as well as HepG2 cells, and still maintained their own fluorescent properties. These results support the idea that the use of emissive AgNPS for bio-sciences could be an important nano-tool but safety controls need to be ensured.
AUTHOR CONTRIBUTIONS
All authors conceived and design the experiments, analyzed the data, contributed to discussion and co-wrote the manuscript. Elisabete Oliveira performed the synthesis of silver nanoparti-cles and characterization. Benito Rodríguez-González performed the TEM and HRTEM measurements. Mário Diniz performed thein vivostudies, and Javier Garcia-Pardo and Julia Lorenzo the
in vitrostudies. Carlos Lodeiro and José L. Capelo coordinated and finance the project.
ACKNOWLEDGMENTS
Authors thank Xunta de Galicia (Biomedicine) for the research grant 10CSA383009PR, and Scientific PROTEOMASS Association (Portugal) for financial support. Elisabete Oliveira and Hugo M. Santos thank to MEC-FCT (Portugal), for the post-doctoral grants SRFH/BPD/72557/2010 and SRFH/BPD/73997/ 2010. Julia Lorenzo thanks to Ministerio de Ciencia e Innovacion (MICINN) of Spain, for grant BIO2010-22321-C02. Authors thank the financial support by REQUIMTE-FCT PEst-C/EQB/ LA0006/2013.
SUPPLEMENTARY MATERIAL
The Supplementary Material for this article can be found online at: http://www.frontiersin.org/journal/10.3389/fchem.2013. 00029/abstract
Figure SI1 | (A) Absorption and (B) emission spectra of the AgNPs formation with time containing as stabilizer compound 2, in a THF solution, T=298 K, λexc=430 nm.
Figure SI2 | Intraperitoneal injection of (0.0075 mg/g fish weight) of compounds 1, 2, or 3 (1 mL THF diluted to 10 mL PBS). (I) GST, (II) CAT, and (III) MDA concentrations in the liver and intestine tissues of Carassius auratus treated with 1, 2, or 3 for 48 h. Data are presented as means ± SD. No statistic significant differences were observed (p<0.05) in comparison to
Figure SI3 | Comparative cytotoxicity against HepG2 cells after 72 h of treatment with AgNPs (stabilized with compounds 1, 2, and 3) at 100µg/ml.Representative optical microscopy images of control cells(A) and AgNPs treated cells(B–D)are shown. Green and red arrows indicate viable and non-viable HepG2 cells, respectively. Cell viability of HepG2 cells was evaluated by XTT assay(E).
Figure SI4 | Flow cytometric analyses of HEK293-T cells exposed to 25 and 100µg/ml of AgNPs stabilized with compound 1 (A), compound 2 (B), and
compound 3 (C).
REFERENCES
Aebi, H. (1984). Catalase in vitro. Meth. Enzymol. 105, 121–126. doi: 10.1016/S0076-6879(84)05016-3
Alivisatos, A. P. (1996). Semiconductor clusters, nanocrystals, and quantum dots.
Science271, 933–937. doi: 10.1126/science.271.5251.933
Belser, K., Slenters, T. V., Pfumbidzai, C., Upert, G., Mirolo, L., Fromm, K. M., et al. (2009). Silver nanoparticle formation in different sizes induced by peptides identified within split-and-mix libraries.Agew. Chem. Int. Ed.48, 3661–3664. doi: 10.1002/anie.200806265
Botsoglou, N. A., Fletouris, D. J., Papageorgiou, G. E., Vassilopoulos, V. N., Mantis, A. J., and Trakatellis, A. G. (1994). A rapid, sensitive, and specific thiobarbi-turic acid method for measuring lipid peroxidation in animal tissues, food, and feedstuff samples.J. Agri. Food Chem.42, 1931–1937. doi: 10.1021/jf00045a019 Bradford, M. M. (1976). A rapid and sensitive method for the quantification of microgram quantities of protein utilizing the principle of protein-dye binding.
Anal. Biochem.72, 248–254. doi: 10.1016/0003-2697(76)90527-3
Chae, Y. J., Pham, C. H., Lee, J., Bae, E., Yi, J., and Gu, M. B. (2009). Evaluation of the toxic impact of silver nanoparticles on Japanese medaka (Oryzias latipes).
Aquat. Toxicol.94, 320–327. doi: 10.1016/j.aquatox.2009.07.019
Chau, J. L. H., Hsu, M. K., Hsieh, C. C., and Kao, C. C. (2005). Microwave plasma synthesis of silver nanopowders. Mater. Lett. 59, 905–908. doi: 10.1016/j.matlet.2004.10.068
Choi, J. E., Kim, S., Ahn, J. H., Youn, P., Kang, J. S., Park, K., et al. (2010). Induction of oxidative stress and apoptosis by silver nanoparticles in the liver of adult zebrafish.Aquat. Toxicol. 100, 151–159. doi: 10.1016/j.aquatox.2009.12.012 Chow, M. K., and Zukoski, C. F. (1994). Gold sol formation
mecha-nisms: role of colloidal stability.J. Colloid Interface Sci.165, 97–109. doi: 10.1006/jcis.1994.1210
Correia, A. D., Costa, M. H., Luis, O. J., and Livingstone, D. R. (2003). Livingstone, Age-related changes in antioxidant enyzme activities, fatty acid composi-tion, and lipid peroxidation in whole bodyGammarus locusta (Crustacea: Amphipoda). J. Exp. Mar. Biol. Ecol. 289, 83–101. doi: 10.1016/S0022-0981(03)00040-6
Cory, A. H., Owen, T. C., Barltrop, J. A., and Cory, J. G. (1991). Use of an aque-ous soluble tetrazolium/formazan assay for cell growth assays in culture.Cancer Commun.3, 207–212.
Dahl, J. A., Maddux, B. L. S., and Hutchinson, J. E. (2007). Toward greener nanosynthesis.Chem. Rev.107, 2228–2269. doi: 10.1021/cr050943k
Díez, I., Pusa, M., Kulmala, S., Jiang, H., Walther, A., Goldmann, A. S., et al. (2009). Color tunability and electrochemiluminescence of silver nanoclusters.Angew. Chem.121, 2156–2159. doi: 10.1002/ange.200806210
Drake, P. L., and Hazelwood, K. (2005). Exposure-related health effects of sil-ver and silsil-ver compounds: a review.J. Ann. Occup. Hyg.49, 575–585. doi: 10.1093/annhyg/mei019
Evanoff, D. D. Jr., and Chumanov, G. (2005). Synthesis and optical proper-ties of silver nanoparticles and arrays.Chemphyschem. 6, 1221–1231. doi: 10.1002/cphc.200500113
Farmen, E., Mikkelsen, H. N., Evensen, O., Einset, J., Heier, L. S., Rosseland, B. O., et al. (2012). Acute and sub-lethal effects in juvenile Atlantic salmon exposed to lowµg/L concentrations of Ag nanoparticles.Aquat. Toxicol.108, 78–84. doi: 10.1016/j.aquatox.2011.07.007
Faunce, T., and Watal, A. (2010). Nanosilver and global public health: international regulatory issues.Nanomedicine5, 617–632. doi: 10.2217/nnm.10.33 Greenberg, M. E., Li, X.-M., Gugiu, B. G., Gu, X., Qin, J., Salomon, R. G., et al.
(2008). The lipid Whisker model of the structure of oxidized cell membranes.
J. Biol. Chem.283, 2385–2396. doi: 10.1074/jbc.M707348200
Habig, W. H., Pabst, M. J., and Jakoby, W. B. (1974). Glutathione S-transferases, the first enzymatic step in mercapturic acid formation.J. Biol. Chem.249, 7130–7139.
Hayes, J. D., Flanagan, J. U., and Jowsey, I. R. (2005). Glutathione transferases.
Annu. Rev. Pharmacol. Toxicol.45, 51–88. doi: 10.1146/annurev.pharmtox.45. 120403.095857
Hussain, S. M., Hess, K. L., Gearhart, J. M., Geiss, K. T., and Schlager, J. J. (2005).
In vitrotoxicity of nanoparticles in BRL 3A rat liver cells.Toxicol. In Vitro19, 975–983. doi: 10.1016/j.tiv.2005.06.034
Kiernan, J. A. (2008).Histological and Histochemical Methods. Theory and Practice.
4th Edn. Bloxham, Scion Publishing Ltd.
Kwok, K. W. H., Auffan, M., Badireddy, A. R., Nelson, C. M., Wiesner, M. R., Chilkoti, A., et al. (2012). Uptake of silver nanoparticles and toxicity to early life stages of Japanese medaka (Oryzias latipes): effect of coating materials.Aquat. Toxicol.120–121, 59–66. doi: 10.1016/j.aquatox.2012.04.012
Landsdown, A. B. G. (2007). Critical observations on the neurotoxicity of silver.
Crit. Rev. Toxicol.37, 237–250. doi: 10.1080/10408440601177665
Lee, P. C., and Meisel, D. (1982). Adsorption and surface-enhanced raman of dyes on silver and gold sols.J. Phys. Chem.86, 3391–3395. doi: 10.1021/j100214a025 Li, T., Albee, B., Alemayehu, M., Diaz, R., Ingham, L., Kamal, S., et al. (2010). Comparative toxicity study of Ag, Au, and Ag-Au bimetallic nanoparticles on Daphnia magna.Anal. Bioanal. Chem.398, 689–700. doi: 10.1007/s00216-010-3915-1
Liang, H., Tang, Q., Yu, K., Li, S., and Ke, J. (2007). Preparation of metallic silver from Ag2S slurry by direct hydrogen reduction under hydrothermal conditions.
Mater. Lett.61, 1020–1022. doi: 10.1016/j.matlet.2006.06.060
Liz-Marzán, L. M. (2006). Tailoring surface plasmons through the morphology and assembly of metal nanoparticles.Langmuir22, 32–41. doi: 10.1021/la0513353 Lodeiro, C., Capelo, J. L., Mejuto, J. C., Oliveira, E., Santos, H. M., Pedras, B., et al.
(2010). Light and color as analytical detection tools: a journey into the peri-odic table using polyamines to bio-inspired systems as chemosensors.Chem. Soc. Rev.39, 2948–2976. doi: 10.1039/b819787n
Luoma, S. (2008). Silver Nanotechnologies and the Environment: Old Problems or New Challenges. Washington, DC: Woodrow Wilson International Center for Scholars Project on Emerging Nanotechnologies or The PEW Charitable Trusts. Maehly, A. C., and Chance, B. (1954). The assay of catalases and peroxidases.
Methods Biochem. Anal.1, 357–424. doi: 10.1002/9780470110171.ch14 Maretti, L., Billone, P. S., Liu, Y., and Scaiano, J. C. (2009). Facile photochemical
synthesis and characterization of highly fluorescent silver nanoparticles.J. Am. Chem. Soc.131, 13972–13980. doi: 10.1021/ja900201k
Martoja, R., and Martoja, M. (1967). Initiation aux tecniques de l’histologie animal Paris.Masson Cie1, 345.
Oliveira, E., Genovese, D., Juris, R., Zaccheroni, N., Capelo, J. L., Raposo, M. M. M., et al. (2011a). Bioinspired systems for metal-ion sensing: new emissive peptide probes based on benzo[d]oxazole derivatives and their gold and silica nanoparticles. Inorg. Chem. 50, 8834–8849. doi: 10.1021/ ic200792t
Oliveira, E., Nuñez, C., Rodríguez-González, B., Capelo, J. L., and Lodeiro, C. (2011b). Novel small stable gold nanoparticles bearing fluorescent cysteine-coumarin probes as new metal-modulated chemosensors.Inorg. Chem.50, 8797–8807. doi: 10.1021/ic200664z
Pastoriza-Santos, I., and Liz-Marzán, L. M. (2008). Colloidal silver nanoplates. State of the art and future challenges.J. Mater. Chem.74, 1724–1737. doi: 10.1039/b716538b
Pompa, P. P., Martiradonna, L., Della Torre, A., Della Sala, F., Manna, L., De Vittorio, M., et al. (2006). Metal-enhanced fluorescence of colloidal nanocrys-tals with nanoscale control.Nat. Nanotechnol.1, 126–130. doi: 10.1038/nnano. 2006.93
Powers, C. M., Slotkin, T. A., Seidler, F. J., Badireddy, A. R., and Padilla, S. (2011). Silver nanoparticles alter zebrafish development and larval behavior: distinct roles for particle size, coating and composition.Neurotoxicol. Teratol.
33, 708–714. doi: 10.1016/j.ntt.2011.02.002
Rao, T. U. B., and Pradeep, T. (2010). Luminescent Ag7 and Ag8 clusters by interfa-cial synthesis.Angew. Chem.122, 4017–4021. doi: 10.1002/ange.200907120 Rodríguez-González, B., Mulvaney, P., and Liz-Marzán, L. M. (2007). An
electro-chemical model for gold colloid formation via citrate reduction.Z. Phys. Chem.
221, 415–426. doi: 10.1524/zpch.2007.221.3.415
properties of gold nanodecahedra with size control.Adv. Mater.18, 2529–2534. doi: 10.1002/adma.200600475
Scown, T. M., Santos, E. M., Johnston, B. D., Gaiser, B., Baalousha, M., Mitov, S., et al. (2010). Effects of aqueous exposure to silver nanoparticles of different sizes in rainbow trout.Toxicol. Sci.115, 521–534. doi: 10.1093/toxsci/kfq076 Si, S., Dinda, E., and Mandal, T. K. (2007).In Situsynthesis of gold and silver
nanoparticles by using redox-active amphiphiles and their phase transfer to organic solvents.Chem. Eur. J.13, 9850–9861. doi: 10.1002/chem.200701014 Sutherlandm, W. J., Clout, M., Coté, I. M., Daszak, P., Depledge, M. H., Fellman,
L., et al. (2010). A horizon scan of global conservation issues for 2010.Trends Ecol. Evol. 25, 1–7. doi: 10.1016/j.tree.2009.10.003
Tam, F., Goodrich, G. P., Johnson, B. R., and Halas, N. J. (2007). Plasmonic enhancement of molecular fluorescence.Nano. Lett.7, 496–501. doi: 10.1021/ nl062901x
Vosch, T., Antoku, Y., Hsiang, J. C., Richards, C. I., Gonzalez, J. I., and Dickson, R. M. (2007). Strongly emissive individual DNA-encapsulated Ag nanoclusters as single-molecule fluorophores.Proc. Natl. Acad. Sci. U.S.A.104, 12616–12621. doi: 10.1073/pnas.0610677104
Wong, H. L., Rauth, A. M., Bendayan, R., Manias, J. L., Ramaswamy, M., Liu, Z., et al. (2006). A new polymer-lipid hybrid nanoparticle system increases cyto-toxicity of doxorubicin against multidrug-resistant human breast cancer cells.
Pharm. Res.23, 1574–1585. doi: 10.1007/s11095-006-0282-x
You, C., Han, C., Wang, X., Zheng, Y., Li, Q., Hu, X., et al. (2012). The progress of silver nanoparticles in the antibacterial mechanism, clinical application and cytotoxicity.Mol. Biol. Rep.39, 9193–9201. doi: 10.1007/s11033-012-1792-8
Zhang, J., Xu, S., and Kumacheva, E. (2005). Photogeneration of fluorescent silver nanoclusters in polymer microgels.Adv. Mater. 17, 2336–2340. doi: 10.1002/adma.200501062
Conflict of Interest Statement:The authors declare that the research was con-ducted in the absence of any commercial or financial relationships that could be construed as a potential conflict of interest.
Received: 25 September 2013; paper pending published: 12 October 2013; accepted: 13 November 2013; published online: 05 December 2013.
Citation: Oliveira E, Santos HM, Garcia-Pardo J, Diniz M, Lorenzo J, Rodríguez-González B, Capelo JL and Lodeiro C (2013) Synthesis of functionalized fluorescent silver nanoparticles and their toxicological effect in aquatic environments (Goldfish) and HEPG2 cells. Front. Chem.1:29. doi: 10.3389/fchem.2013.00029
This article was submitted to Inorganic Chemistry, a section of the journal Frontiers in Chemistry.