Tiago Miguel Frasco Velasques
Licenciatura em Biologia Celular e Molecular
Development of Real Time PCR Meat
detection kits and technology market transfer
Dissertação para obtenção do Grau de Mestre em Biotecnologia
Orientador: Prof. Doutora Fernanda Antónia Josefa Llussá, FCT/UNL
Coorientador: Joana Raquel Freitas Dias da Silva, BPMR - Produção e Desenvolvimento, Unipessoal, Lda.
Júri:
Presidente: Prof. Doutora Isabel Sá Nogueira
Arguente: Prof. Doutora Maria Alexandra Fernandes
D
ev
el
op
m
en
t
of
R
ea
l
Ti
m
e
P
C
R
M
ea
t
de
te
ct
io
n
ki
ts
a
nd
t
ec
hn
ol
og
y
m
ar
ke
t
tr
an
sf
er
Ti
ag
o
V
el
as
ques
Tiago Miguel Frasco Velasques
Licenciatura em Biologia Celular e Molecular
Development of Real Time PCR Meat
detection kits and technology market transfer
Dissertação para obtenção do Grau de Mestre em Biotecnologia
Orientador: Prof. Doutora Fernanda Antónia Josefa Llussá, FCT/UNL
Coorientador: Joana Raquel Freitas Dias da Silva, BPMR - Produção e Desenvolvimento, Unipessoal, Lda.
Constituição do júri
Presidente: Prof. Doutora Isabel Maria Godinho de Sá Nogueira, Professora Associada, Departamento de Ciências da Vida da Faculdade de Ciências e Tecnologia da Universidade Nova de Lisboa
Arguente: Prof. Doutora Maria Alexandra Núncio de Carvalho Ramos Fernandes, Professora Auxiliar, Departamento de Ciências da Vida da Faculdade de Ciências e Tecnologia da Universidade Nova de Lisboa
Development of Real Time PCR Meat detection kits and technology market transfer
Copyright © 2018. Todos os direitos reservados. Tiago Miguel Frasco Velasques, Faculdade de Ciências e Tecnologia e Universidade Nova de Lisboa.
Agradecimentos
Em primeiro lugar, gostaria de agradecer à Professora Fernanda Llussá pela sua o persistência e paciência ao longo deste ano. Pelo apoio e ajuda à escrita desta tese, que sem a sua orientação a entrega atempada não seria de todo possível.
De seguida, à Joana Freitas e ao Pedro Antunes da BPMR por me aceitarem na sua empresa e permitirem o desenvolvimento deste projeto. Pelos conhecimentos transmitidos tanto ao nível científico, político e económico e principalmente pela paciência em momentos de aselhice. À Joana, um agradecimento também pela companhia durante este ano e por todos os conselhos dados para dentro e fora do laboratório.
Um enorme obrigado a todos os meus amigos por me terem proporcionado momentos de descontração depois de horas a trabalhar. O apoio, mais do que sentido, permitiu manter a sanidade não só aquando do desenvolvimento deste trabalho. Aproveito também para agradecer o perdão pelas ausências aos encontros, especialmente devido à escrita deste trabalho.
À Ana Luísa Silva, não há palavras para agradecer por toda a paciência, apoio e carinho que nunca faltaram. Pelas palavras motivacionais e por nunca me deixar desistir de nada. E, particularmente, pelo interesse desmedido pelo meu trabalho e meu futuro.
A toda a minha família, por nunca saírem do meu lado e mesmo estando na outra ponta do país, o apoio deles nunca faltou. Quer seja por acreditarem demasiado nas minhas capacidades ou pelo envio de mantimentos para os tempos mais difíceis.
Resumo
Recentemente, o número de casos de fraude alimentar tem vindo a aumentar na Europa e a consequente, confiança do consumidor na qualidade do setor alimentar tem vindo a diminuir. Desta forma, torna-se crucial a existência métodos fiáveis, rápidos e de baixo custo para detetar adulteração alimentar criminosa, nomeadamente das carnes.
Nesta tese foram desenvolvidos quatro kits de deteção DNA: frango, peru, cavalo e porco em matrizes alimentares, usando a técnica de Real Time PCR (Polymerase Chain Reaction). O desenvolvimento foi feito através da otimização dos kits de deteção BIOPREMIER Real Time PCR já existentes, produzidos e comercializados pela BPMR. A otimização consistiu em vários ensaios de Real Time PCR com diferentes concentrações de reagentes e programas de PCR de maneira a encontrar as concentrações ótimas para a deteção de cada target. Após a otimização, testes de validação foram feitos para autenticar os novos kits. Estes permitiram aferir que a performance dos quatro kits foi melhorada com indicadores de especificidade e inclusividade superiores a 98% e um limite de deteção que varia entre 1pg e 10pg.
Além do desenvolvimento dos kits, foi feito um estudo de mercado e desenhada uma estratégia de transferência de tecnologia para o mercado. A crescente preocupação pela segurança alimentar e tecnologias competidoras são fatores que têm impacto na comercialização dos kits. O mercado alvo é composto por laboratórios de análise alimentar, pequenos ou médios, localizados na EU, que possuem um termociclador de Real Time PCR com canais FAM e ROX. Os planos de marketing e de negócios permitiram a implementação dos kits no mercado, criando a linha “SUPREME Real Time PCR detection kits”.
Em suma, a proposta de valor dos SUPREME Real Time PCR detection kits consiste na entrega de testes low-cost, rápidos e qualitativos para detetar carne em amostras alimentares.
Abstract
In recent years, food fraud cases have been increasing in Europe and, consequently, the consumer trust over the food sector quality have been decreasing. Thus, the existence of reliable, fast and low-cost methods to detect criminal adulteration of food becomes crucial.
In this thesis, four meat detection kits to detect chicken, turkey, horse and swine DNA in food matrices were developed, using Real Time PCR (Polymerase Chain Reaction) technique. The development was done through optimization of the four BIOPREMIER Real Time PCR detection kits produced and commercialized by BPMR. The optimization consisted in several Real Time PCR assays with different concentration of some reagents and different PCR programs in order to find the optimal conditions to the detection of each target. After the optimization, validation tests were performed to authenticate the newly created kits. These tests assessed that the performance of all four kits increased with specificity and inclusivity indicators greater than 98% and the Limit of Detection varying between 1pg and 10pg,
Besides the development of the kits, it was done a market analysis and designed a transfer to market strategy. The increasing concern for food safety and the competing technologies are factors that impact the commercialization of the kits. The target market are small or medium laboratories of food analysis, located in the EU, with Real Time PCR thermal ccycler with FAM and ROX channels. The marketing and business plan allowed the kits implementation in the market, creating the SUPREME Real Time PCR detection kit product line.
In summary, the SUPREME Real Time PCR detection kits value proposition consists in the delivery of low-cost, quick and qualitative tests to detect meat in food samples.
Table of Contents
List of Figures ...xiii
List of Tables... xvii
Abbreviations ... xix
List of Symbols ... xxi
List of Units ...xxii
1. Introduction ... 1
1.1. Food Fraud ... 1
2. Food and Environmental Tests: Technology involved, Validation tests, Materials and Methods ... 5
2.1. Real Time PCR ... 5
2.2. Materials and Methods ... 9
2.2.1. DNA Samples ... 10
2.2.1.1 DNA Extraction ... 10
2.2.1.2 DNA Quantification ... 11
2.2.1.3 Sample Verification ... 12
2.2.2. PCR Reagents ... 12
2.2.3. Optimization of PCR conditions ... 13
2.2.4. Analysis of Results ... 14
2.2.5. Validation Tests ... 15
2.2.5.1 Exclusivity Tests ... 15
2.2.5.2 Inclusivity and Sensibility Tests ... 16
2.2.5.3 Robustness Tests ... 17
2.3. Results and Discussion ... 17
2.3.1. Chicken Detection Kit ... 18
2.3.1.1 Optimization of PCR Conditions ... 18
2.3.1.1.2 Concentration of MgCl2 and dNTPs ... 20
2.3.1.1.3 Presence of DMSO... 22
2.3.1.1.4 Concentration of primers and probe ... 24
2.3.1.1.5 Annealing Temperature... 26
2.3.1.1.6 Duration of each cycle phase ... 28
2.3.1.1.7 Concentration of dUTP ... 30
2.3.1.2 Validation Tests ... 31
2.3.1.2.1 Exclusivity Test ... 31
2.3.1.2.2 Inclusivity and Sensibility Tests ... 32
2.3.1.2.3 Robustness Tests... 33
2.3.2. Turkey Detection Kit ... 34
2.3.2.1 Optimization of PCR Conditions ... 34
2.3.2.1.1 Type of primers and probe ... 34
2.3.2.1.2 Presence of DMSO... 36
2.3.2.1.3 Concentration of primers and probe ... 38
2.3.2.1.4 Annealing Temperature... 39
2.3.2.1.5 Duration of each cycle phase ... 42
2.3.2.1.6 Concentration of dUTP ... 44
2.3.2.1.7 Concentration of MgCl2 ... 45
2.3.2.2 Validation Tests ... 47
2.3.2.2.1 Exclusivity Test ... 47
2.3.2.2.2 Inclusivity and Sensibility Tests ... 47
2.3.2.2.3 Robustness Tests... 49
2.3.3. Horse Detection Kit ... 49
2.3.3.1 Optimization of PCR Conditions ... 49
2.3.3.1.2 Duration of each cycle phase ... 51
2.3.3.1.3 Type of primers and probe ... 54
2.3.3.1.4 Concentration of primers, MgCl2 and dNTPs ... 55
2.3.3.2 Validation Tests ... 58
2.3.3.2.1 Exclusivity Test ... 58
2.3.3.2.2 Inclusivity and Sensibility Tests ... 58
2.3.3.2.3 Robustness Tests... 60
2.3.4. Swine Detection Kit ... 60
2.3.4.1 Optimization of PCR Conditions ... 60
2.3.4.1.1 Presence of DMSO... 61
2.3.4.1.2 Annealing Temperature... 63
2.3.4.1.3 Duration of each cycle phase ... 65
2.3.4.1.4 Type of primers and probe ... 67
2.3.4.1.5 Concentration of primers and MgCl2 ... 68
2.3.4.2 Validation Tests ... 70
2.3.4.2.1 Exclusivity Test ... 70
2.3.4.2.2 Inclusivity and Sensibility Tests ... 71
2.3.4.2.3 Robustness Tests... 72
3. From the technology to the market ... 73
3.1. Market Analysis ... 73
3.1.1. SWOT analysis ... 73
3.1.1.1 Strengths (S) ... 75
3.1.1.2 Weaknesses (W)... 75
3.1.1.3 Opportunities (O)... 76
3.1.1.4 Threats (T)... 79
3.1.1.5.1 Strengths x Opportunities (SO) ... 81
3.1.1.5.2 Weaknesses x Opportunities (WO) ... 82
3.1.1.5.3 Strengths x Threats (ST) ... 82
3.1.1.5.4 Weaknesses x Threats (W T) ... 83
3.2. Marketing Plan ... 84
3.2.1. Marketing Strategy ... 84
3.2.1.1 Market Segmentation ... 84
3.2.1.2 Targeting ... 84
3.2.1.3 Positioning ... 85
3.2.2. Marketing Mix ... 86
3.2.2.1 Product... 86
3.2.2.2 Price... 87
3.2.2.3 Place ... 89
3.2.2.4 Promotion ... 90
3.3. Implementation ... 91
3.3.1. Market Entry and Expansion Strategy ... 91
4. Business Model ... 93
4.1. Business Model Canvas ... 93
4.1.1. Value Propositions ... 94
4.1.2. Customer Segments ... 94
4.1.3. Customer Relationships ... 94
4.1.4. Channels ... 94
4.1.5. Revenue Streams ... 95
4.1.6. Key activities ... 95
4.1.7. Key Resources... 95
4.1.8. Key Partners ... 95
5. Conclusions and Future Perspectives ... 97
Bibliography ... 99
List of Figures
Figure 2.1 Temperature changes in the first two PCR Cycle s.... 6 Figure 2.2 Mechani sm of action of hydrolysi s probe.... 9 Figure 2.3 Graphic representation of the PCR results: PCR 84 with current set of primers
and probe [A] and PCR 85 with the new set of primers and probe [B]. ... 20
Figure 2.4 Graphic representation of the PCR results: PCR 102 with lowest concentration of both reagents [A], PCR 103 with low concentration of MgCl2 and high concentration of dNTPs [B] and PCR 104 with the highest concentration of both reagents [C].. ... 21
Figure 2.5 Graphic representation of the PCR results: PCR 102 with DMSO [A] and PCR 110 without DMSO [B]. ... 23
Figure 2.6 Graphic representation of the PCR results: PCR 110 with a medium concentration of primers and probe [A], PCR 111 with low concentration of this reagents [B] and PCR 112 with the highest concentration [C]. ... 25
Figure 2.7 Graphic representation of the PCR results: PCR 110 with an annealing temperature of 60ºC [A], PCR 132 with lower annealing temperature [B] and PCR 133 with the annealing temperature at 62ºC [C]. ... 27
Figure 2.8 Graphic representation of the PCR results: PCR 110 [A], PCR 152 [B], PCR 153 [C] and PCR 154 [D]... 29
Figure 2.9 Graphic representation of the PCR results: PCR 153 with higher dUTP concentration [A] and of PCR 174 with lower concentration [B] ... 31
Figure 2.10 Graphic representation of the PCR results: chicken detection kit exclusivity test ... 32
Figure 2.11 Graphic representation of the PCR results: the chicken detection kit sensibility test. ... 32
Figure 2.12 Graphic representation of the PCR results: the chicken detection kit inclusivity test. ... 33
Figure 2.13 Graphic representation of the PCR results: PCR 86 with current set of primers and probe [A] and PCR 87 with the new set of primers and probe [B]. ... 35
Figure 2.14 Graphic representation of the PCR results: PCR 105 with DMSO [A] and PCR 113 without DMSO [B]. ... 37
Figure 2.16 Graphic representation of the PCR results: PCR 115 with an annealing temperature of 60ºC [A], PCR 134 with lower annealing temperature [B] and PCR 135 with the annealing temperature at 62ºC [C]. ... 41
Figure 2.17 Graphic representation of the PCR results: PCR 115 [A], PCR 155 [B], PCR 156 [C] and PCR 157 [D]... 43
Figure 2.18 Graphic representation of the PCR results: PCR 156 with higher dUTP concentration [A] and of PCR 175 with lower concentration [B]. ... 44
Figure 2.19 Graphic representation of the PCR results: PCR 156 with the lowest concentration of MgCl2 [A] and PCR 252 with the highest concentration of the reagent [B]. ... 46
Figure 2.20 Graphic representation of the PCR results: turkey detection kit exclusivity test ... 47
Figure 2.21 Graphic representation of the PCR re sults: turkey detection kit sensibility test.. 48 Figure 2.22 Graphic representation of the PCR results: turkey detection kit inclusivity test.
... 48
Figure 2.23 Graphic representation of the PCR results: PCR 116 with an annealing temperature of 60ºC [A], PCR 138 with lower annealing temperature [B] and PCR 139 with the annealing temperature at 62ºC [C]. ... 51
Figure 2.24 Graphic representation of the PCR results: PCR 116 [A], PCR 161 [B], PCR 162 [C] and PCR 163 [D]... 53
Figure 2.25 Graphic representation of the PCR results: PCR 255 using the new set [A] and PCFR 257 with the current set [B]. ... 55
Figure 2.26 Graphic representation of the PCR results: PCR 257 [A], PCR 259 [B], PCR 266 [C] and PCR 278 [D]... 57
Figure 2.27 Graphic representation of the PCR re sults: horse detection kit exclusivity test.. 58 Figure 2.28 Graphic representation of the PCR results: horse detection kit sensibility test.
. ... 59
Figure 2.29 Graphic representation of the PCR re sults: horse detection kit inclusivity test... 60 Figure 2.30 Graphic representation of the PCR results: PCR 100 with DMSO [A] and PCR
125 without DMSO [B] ... 62
Figure 2.31 Graphic representation of the PCR results: PCR 125 with an annealing temperature of 60ºC [A], PCR 136 with lower annealing temperature [B] and PCR 137 with the annealing temperature at 62ºC [C].. ... 64
Figure 2.33 Graphic representation of the PCR results: PCR 303 using the current set [A] and PCR 304 the new set [B]. ... 67
Figure 2.34 Graphic representation of the PCR results: PCR 304 [A], PCR 305/306 [B] and PCR 307/308 [C] ... 69
Figure 2.35 Graphic representation of the PCR re sults: swine detection kit exclusivity test.. 71 Figure 2.36 Graphic representation of the PCR results: swine detection kit sensibility test.
... 71
List of Tables
Table 1.1 Target Countries of BPMR and its National Food Safety Agencies ... 2
Table 2.1 Food Matrices and corresponding Identification Code. All the matrices were bought in the local supermarket and it were used two aliquots of 200mg of each. ... 11
Table 2.2 Samples used in the kit optimization for each target ... 13
Table 2.3 Positive Controls for each target ... 14
Table 2.4 positive and negative control results... 15
Table 2.5 Interpretation of the sample results ... 15
Table 2.6 Samples used in each kit inclusivity test ... 16
Table 2.7 List of ordered and optimized PCR conditions of the Chicken Detection kit and its BPMR Code. The PCR conditions comprises the kind and concentration of the master mix reagents and the PCR program defined. ... 18
Table 2.8 List of ordered and optimized PCR conditions of the Turkey Detection kit and its BPMR Code. The PCR conditions comprises the kind and concentration of the master mix reagents and the PCR program defined. ... 34
Table 2.9 List of ordered and optimized PCR conditions of the Horse Detection kit and its BPMR Code. The PCR conditions comprises the kind and concentration of the master mix reagents and the PCR program defined. ... 49
Table 2.10 List of ordered and optimized PCR conditions of the Swine Detection kit and its BPMR Code. The PCR conditions comprises the kind and concentration of the master mix reagents and the PCR program defined. ... 61
Table 3.1 SWOT Matrix. The SWOT matrix is a market analysis technique that cross -reference the Strength and Weakness of BPMR and SUMPREME Real PCR detection kits with the Opportunities and Threats of the market situation. ... 74
Table 3.2 Contact Points of FFN... 77
Table 3.3 Performance Map. ... 79
Table 3.4 Comparison between detection techniques... 80
Table 3.5 Price Comparison between BPMR and its competitors ... 88
Table 3.6 Scientific Distributors of SUPREME Real Time PCR detection kits. ... 89
Abbreviations
FCT Faculdade de Ciências e Tecnologia
EU European Union
PCR Polymerase Chain Reaction
ASAE Autoridade de Segurança Alimentar e Económica
UK United Kingdom
DNA Deoxyribonucleic Acid
DMSO Dimethyl sulfoxide
dNTPs Deoxynucleoside triphosphates
dUTP Deoxyuridine triphosphate
UDG Uracil DNA-glycosylase
FAM 6-Carboxyfluorescein
ROX 5’ CAL Fluor 610
IC Internal Control
List of Symbols
Tm Melting Temperature
CT Cycle Threshold
List of Units
ºC Degrees Celsius
g gram
mg milligram (10-3g)
μg microgram (10-6g)
ng nanogram (10-9g)
pg picogram (10-12g)
L
litre
μ
l
microliter
(10-6L)1.
Introduction
This thesis describes the optimization of four BIOPREMIER Real Time PCR meat detection kits and the definition of a technology to market transfer strategy. Each kit has a specific target and are used to detect DNA of chicken, turkey, horse present in food matrixes. The main goal of these kits is to confirm the meat authenticity, preventing food fraud.
In this work, the optimization will be described in a scientific point of view and will be made a market analysis to study and define the best strategies to market launch the products.
The Real Time PCR detection kits were optimized over writing of the thesis in BPMR – Produção e Desenvolvimento, Unipessoal, Lda (from now on designated as BPMR). BPMR is the owner of the kits under the brand BIOPREMIER Real Time PCR Detection Kits. The optimized kits partake in a new product line named SUPREME Real Time PCR.
In October 2016, SGS acquire 70% of Biopremier, which included the NGS technology and the services provided by the company. The remaining 30% were kept by the CEO of Biopremier, Pedro Fernandes Antunes, that created BPMR as a spin-off company
The success achieved by Biopremier granted capital investment from several venture capital companies, which allowed the growth of Biopremier. This growth permitted the development of new tests, using Real Time PCR technology, these tests were focused in identify meat authenticity.
Currently, BPMR defines itself as a producer and developer of real time PCR diagnostic kits, that can be used in agri-food, environmental, clinical and veterinary sectors. The company has 62 diagnostic kits sold to testing laboratories in European Union (EU).
BPMR mission is to become a global reference in producing and developing kits for diagnostics' laboratories, in real time PCR detection kits. BPMR innovation and the capability to offer solutions to the costumers are some of the characteristics, for which BPMR hopes to become a reference in its industry So, BPMR ensures the quality of its products, based on scientific skills and experience of its professionals, intended to beat its costumers’ expectations.
1.1. Food Fraud
Food fraud is, then, defined as any economical motivated deceptive practice regarding the food industry and it can be any adulteration, substitution, counterfeit, and intentionally mislabelling of food or food products (Spink & Moyer, 2011).
Despite the general definition of food fraud by the regulation, each EU country has its own set of laws regarding the number of checkpoints and the legal penalties.
In Portugal, the Autoridade de Segurança Alimentar e Económica (ASAE) is the entity responsible to inspect and ensure the enforcement of the rules defined by the European Parliament and by the Portuguese Parliament. To be deemed as food fraud, the food examined must contain at least 1% of not declared ingredient. In agreement with the Article 24 of the DL no28/84: Infracções antieconómicas e contra a saúde pública, the sentence for whom committed any kind of food fraud can extend from a small fine to 2 years in prison.
In the remaining countries of EU, the laws regarding the food sector and the national agency responsible to enforce those laws vary according to the country. The entities of the European countries targeted by BPMR are listed in Table 1.1. The European Food Safety Authority (EFSA) is a European agency that cooperates with all the mentioned agencies and provides scientific advice on food-related risk.
Table 1.1 Target Countries of BPMR and its National Food Safety Agencies
Country Food Safety Entity
Spain Agencia de Información y Control Alimentarios
(AICA)
France Agence nationale de sécurité sanitaire de
l’alimentation, de l’environnement et du travail
(ANSES)
Italy Comando carabinieri per la tutela della salute
(NAS)
Germany Bundesanstalt für Landwirtschaft und
Ernährung (BLE)
Belgium Agence Fédérale pour la Sécurité de la Chaîne Alimentaire (AFSCA
Netherlands Nederlandse Voedsel- en Warenautoriteit (NVWA)
UK Department for Environment, Food and Rural
Affairs (DEFRA)
The food fraud control differs of the food safety concept, since the food fraud implies every economical food related violations regardless of threating the public health or not, while the food safety concept is precautionary measures regarding the food consumption hazards (Spink & Moyer, 2011).
industry, as well as a decrease in the consumers trust in the food quality. In the same report, the main contributing factor to the increase of fraudulent practices is that the regulatory and judicial entities are more concerned to assure the food safety then its authenticity.
Although the food fraud is not necessarily a hazard to the public health, and that’s why the
authorities don’t focus on this issue, there are some instance where the well-being of the population
can be endangered. In example, if the labelling of a food product doesn’t intentionally report some ingredients, it can cause a reaction in people allergic to those ingredients. These misleading practices can also affect the lifestyle of some people. For example, if a product, marketed as vegetarian, contains animal ingredients, it is disrespecting the lifestyle choice of a vegetarian.
In the meat industry, there are several common fraudulent practices, namely the substitution of the animal species, the falsification of the origin or diet of the animal, and the addition of non-meat ingredients to increase the volume, like water (Ballin, 2010). These practices are most used in food products like hamburgers, sausages, minced meat and other meat derived products. In the next paragraphs, three food fraud cases are discussed in order to illustrate how food fraud in the meet industry is relevant.
In 1986, a bovine meat supplier, distributing in New York school cafeterias, was arrested for adulteration his products with water and vegetal filling, throughout 5 years, to increase the volume of the product with less meat (Everstine, Spink, & Kennedy, 2013).
In the United Kingdom (UK), in 2009, the food safety authorities found traces of size increasing products of bovine and swine origin injected in chicken products. These products were denatured bulking agents that bind water and increase the product weight (Everstine et al., 2013).
The mediatic case, for which Biopremier became known for, happened in 2013 when Irish inspectors found horse DNA in bovine products in several Irish and British supermarkets.
The same type of products (hamburgers, lasagne and minced meat) were investigated in all the EU producers, and it was discovered that in some foodstuff there was between 80% and 100% horse meat. Due to its proportions, it was called horse meat scandal and led to an increasing demand of fast DNA detection kits.
In response to this scandal and the lack of consumer’s trust, the EU created the European Union Food Fraud Network in 2013, which is a mechanism of cooperation of the competent authorities in the member nations, some non-member countries and the European Commission. This network allows the rapid communication between checkpoints and a more efficient detection and controls in cases of food fraud violations (“EU Food Fraud Network,” n.d.).
There are several methods and techniques to species identification and detect food adulteration. These methods can be based in detection of specific proteins or other immunological proprieties; however, they are not efficient in highly processed foods or are not very sensitive as DNA detection techniques. Assuring an exact, specific and highly sensitive detection of the meat species is a necessity for which the BIOPREMIER Real Time PCR Detection kits arise.
2.
Food Tests: Technology involved,
Validation tests, Materials and Methods
2.1. Real Time PCR
Kary Mullis, in 1985, has described an enzymatic amplification of DNA using a thermostable DNA polymerase, the Polymerase Chain Reaction (PCR) technique (Mullis & Faloona, 1987). This method is used in almost every molecular biology laboratories and it consists in the enzymatic and cyclic amplification of a DNA fragment using a thermostable DNA polymerase. The amplification results in the exponential increase of the number of copies of the wanted DNA fragment, in any sample containing DNA (Saik et al., 1988).
PCR technique can be used in molecular biology and microbiology to detect, identify or quantify the DNA of certain organism (Dooley, Paine, Garrett, & Brown, 2004; Yang & Rothman, 2004). Laboratories can also use this technology as a molecular diagnostic technique, overcoming the traditional microbiology techniques, as the time of diagnostic is shortened (Boer, Rahaoui, Leer, Montijn, & Vossen, 2015; Mirmajlessi, Destefanis, Gottsberger, Mänd, & Loit, 2015).
The PCR technique involves short heating and cooling cycles (Saik et al., 1988), which requires the use of a thermal cycler. Each thermal cycler has a thermal block capable of vary temperatures quickly enabling the reaction. The technique employs several reagents in a reaction mix, when exposed to the heating and cooling cyclers, can replicate the desired fragment (Welch, 2012).
The replication is catalysed by a thermostable DNA polymerase, often a Taq DNA
polymerase. This enzyme is resistant to elevated temperatures since it was originally extracted and isolated from Thermus aquaticus, a thermophilic bacterium (Chien, Edgar, & Trela, 1976; Liu &
Licata, 2014). The Thermus aquaticus was reported thriving in hot springs by Thomas D. Brock and
Hudson Freez, and its ability to survive at such hot temperatures has led it to become the source of several thermostable enzymes (Brock & Freeze, 1969). A thermostable enzyme does not denature at the elevated temperatures reached every PCR cycle.
Since the Taq DNA polymerase can only add nucleotides to an existing strand of DNA, the
The reaction mix of a PCR method needs also deoxynucleoside triphosphates (dNTPs), used as DNA polymerase substrate, allowing the formation of a new DNA strand. dNTPs mix is comprised of deoxyadenosine (dATP), deoxycytidine (dCTP), deoxyguanosine (dGTP) and thymine (dTTP) with triphosphate groups.
To complete the reaction mix, it is necessary a buffer solution to regulate the solution pH, and bivalent cations that acts as a cofactor for the DNA polymerase, increasing its yield and facilitate the reaction (Erlich, 1989).
As said before, the PCR technique involves heating and cooling cycles, however some methods have a holding stage before the cycling stage. This initial step is done at temperatures ranging from 94ºC to 98ºC, during 1 to 10 min, to ensure the complete denaturation of the original DNA sample. The denaturation of the DNA molecules is the disruption of the hydrogen bond between base pairs of the nucleotides from two annealed DNA strands (Wang, Lim, & Son, 2014).
The cycling stage consists of 20 to 50 repeating cycles and each cycle is comprised of three steps held at different temperatures, during 10 to 30 seconds each. In the end of every cycle, the quantity of target DNA fragments is twice the quantity at the beginning of the cycle. The changes of temperatures of the first two cycles are shown in Figure 2.1. The final count of the wanted DNA fragment is 2n, with “n” being the number of total cycles (Erlich, 1989). Since its development, the PCR technique has been used exhaustively because it decreases the need of original sample.
Figure 2.1 Temperature changes in the first two PCR Cycles. The first cycle starts with the denaturation
step at temperature higher than 90ºC., the second step is the annealing step at 60ºC. and finally happens the elongation step at 72ºC. After this last step, another cycle begins repeating the denaturation, annealing and
elongation steps at the same temperatures. Both cycles are separated by the orange line.
The annealing is the second step, in which the DNA primers anneal to each complementary
sequence at the 3’ end. The annealing temperature depends on the set of primers and is below the
Tm. The temperature must be chosen as carefully as possible if the temperature is too high the annealing may not happen; if the temperature is too cold it is possible to occur non-specific hybridization (Rychlik, Spencer, & Rhoads, 1990).
The third and last step of the cycling stage is the elongation step. In t his step, the DNA polymerase promotes the addition of the dNTPs to the 3’ end of the previously annealed primer, creating a new DNA strand, following using the existing strand as template. The temperature of this step is dependent of the chosen DNA polymerase. Each polymerase has an optimal elongation temperature, that maximize the replication yield and minimize the probability of errors during this step. The optimal elongation temperature of the Taq polymerase is 72ºC (Kubista et al., 2006).
Since the development of PCR technique, have arisen other PCR-based techniques or modification to the original method. The main goals of this modifications are decrease the non-specific amplification, facilitate the analysis of PCR results or use distinct types of samples. Hot Start PCR, Reverse Transcriptase PCR and Real Time PCR are some example of these modified techniques.
The technology developed in the experimental segment of this thesis uses Real Time PCR to detect specific DNA in food matrices.
Real Time PCR was developed by Higuichi, R in 1993 as a real time monitorization of amplification reactions system (Higuchi, Fockler, Dollinger, & Watson, 1993). This system was based on the intercalation of ethidium bromide (EtBr) in the amplified DNA at every PCR cycle. The reaction took place in a modified thermal cycler, that radiate the solution with ultraviolet (UV) light, and a CCD camera detected the emitted fluorescence. The intensity of fluorescence in each cycle was proportional to the number of DNA copies.
The ease of PCR analysis, provided by the Real Time PCR technique, led to a widespread use of this technology, and consequent improvements to the original system developed by Higuchi. The precision of the current Real Time PCR thermal cyclers allowed the use of other fluorescent agents to monitor the PCR amplification. A Real Time PCR thermal cycler consists in a conventional thermal cycler with a light source to excite the fluorescent agents, a light sensor to measure the intensity of the fluorescence, and an external computer to control de thermal cycler. (Arya, Shergill, Williamson, & Gommersall, 2005; Kubista et al., 2006) Currently, there are two wide used methods for the Real Time detection of PCR products: DNA-binding fluorescent dyes and fluorophore-labelle d oligonucleotides (Navarro, Serrano-heras, Castaño, & Solera, 2015; Ponchel et al., 2003; Tse & Capeau, 2003).
absorbed light (Navarro et al., 2015; Sanderson et al., 2014). Every fluorescent molecule has a light absorption wavelength range, in which is capable of emitting fluorescence; if the light focused on the molecule is outside this range, it does not emit fluorescence because it doesn’t absorb the energy.
The DNA-binding fluorescent dyes are non-specific intercalating agents that are inserted in the minor groove of the dsDNA, at the end of each PCR cycle (Navarro et al., 2015; Ponchel et al., 2003). The binding of these dyes increases its fluorescence, allowing the detection by the sensors of the thermal cycler. The main advantage of this detection method is that the use of DNA -binding dyes is cheaper than fluorophore-labelled oligonucleotides. However, such dyes are non-specific for any target, meaning that it is possible to detect non-specific PCR product or other by-products, such as primer dimers, thus biasing the PCR analysis. To minimize the effect of the non-specific DNA binding it can be done a melting curve analysis, since the specific DNA product denatures at a higher temperature than non-specific DNA and primer dimers (Ririe, Rasmussen, & Wittwer, 1997). The most common used DNA-binding dye is SYBR Green, that absorbs blue light and emits green light (Ponchel et al., 2003).
The fluorophore-labelled oligonucleotides are small single DNA strand with attached fluorophore, which is a small molecule capable of emitting fluorescence. The fluorophore molecules can be classified into donor or reporter fluorophore and acceptor or quencher fluorophore (Marras, 2006; Navarro et al., 2015). When light at a specific wavelength focus in a donor fluorophore molecule, his electrons are excited to the first energy state. The donor fluorophore can then emit fluorescence if the electrons relax to the ground state, however a can happen a Fluorescence Resonance Energy Transfer (FRET). FRET is a distance-dependent phenomenon and happens when a donor and receptor fluorophores are positioned within certain distance (10 and 100 Å) (Elangovan et al., 2003; Sekar & Periasamy, 2003). At those distances, the excited state energy is transferred from the donor fluorophore to the acceptor, that can dissipate this energy as heat (FRET-quenching), or emit as fluorescence, because the acceptor fluorophore can be a fluorescent as well. The fluorophore-labelled oligonucleotides can be sorted into three various categories: primer-probes, nucleic acid analogues, and DNA probes (Navarro et al., 2015). The Biopremier Real Time PCR detection kits uses DNA hydrolysis probes.
DNA probes are oligonucleotides coupled with a fluorophore or a set of donor and acceptor fluorophores. There are two types of DNA probes: hybridization probes and hydrolysis probes. With the hybridization probes, the fluorescence occurs when the probe anneals with the template DNA strand (Guo, Ju, & Turro, 2012; Marras, 2006).
Hydrolysis probes, also known as TaqMan ® probes, are design to bind to a sequence of
the template DNA molecule and have a donor fluorophore at the 5’-end and an acceptor fluorophore
at the 3’-end (Navarro et al., 2015) In solution and when annealed, the acceptor fluorophore
FRET-quenches the fluorescence emitted by the donor fluorophore due to its proximity. However, during
the extension step, the 5’-3’ exonuclease activity of the DNA polymerase degrades the DNA probe
separating both fluorophores, allowing the emission of fluorescence by the donor fluorophore end (Dooley et al., 2004; Navarro et al., 2015; Tse & Capeau, 2003).
essentially, combined with 6-Carboxyfluorescein (FAM) and 5’ CAL Fluor 610 (ROX). FAM is a fluorophore that has a maximum light absorption at a wavelength of 495 nm and emits fluorescence with a wavelength of 515nm (Dooley et al., 2004; Marras, 2006). While the ROX fluorophore absorbs maximum energy at a wavelength of 575 nm and emits light with a wavelength of 605 nm (Marras, 2006).
Figure 2.2 Mechanism of action of hydrolysis probe. [A] In the annealing step, the DNA probe (blue) and
the DNA primers (orange) bind to the DNA template. The probe has two fluorophores: the donor fluorophore
(F) and the acceptor fluorophore (Q). The donor fluorophore doesn’t emit fluorescence due to its proximity to the acceptor fluorophore. [B] During elongation step, the DNA Polymerase (P) promotes the addiction of dNTPs to the 3’ end of the DNA primer, building the new DNA strand (orange). [C] The 5’-3’ exonuclease
activity from the DNA polymerase degrades the probe, separating the donor fluorophore from the acceptor. Due to the increase of distance between both fluorophores, the donor fluorophore emits fluorescence, that can
be detected by the real time thermal cycler sensors.
2.2. Materials and Methods
The experimental procedure of the optimization of the BIOPRIMIER Real Time PCR meat detection kits and its validation tests were done at the BPMR facilities, located in Amadora INOVA. The BPMR facilities are divided into three independent laboratories and one equipment room, which follow a unidirectional flow, to minimize the risk of contamination between steps.
kits. The DNA is then extracted in this room from food matrices or microorganisms. However, it is necessary a biosafety cabinet (BSC) to protect the operator of any risk, since the microorganisms are harmful to the operator.
The next area is the PCR1 room. The room is equipped with a laminar flow cabinet and store the reagents to prepare the Master Mixes. The third chamber is the PCR2 room. The goal of this room is conclusion of the Master Mix by adding the Intern Control DNA, and the distribution of the Master Mix and sample DNA into PCR tubes, in another laminar flow cabinet. The laminar flow cabinets prevent any kind of sample contamination. Finally, the equipment room is equipped with the Applied Biosystems® 7500 Fast Real-Time PCR thermocycler.
The steps of the referred workflow follow intern protocols and regulations.
2.2.1. DNA Samples
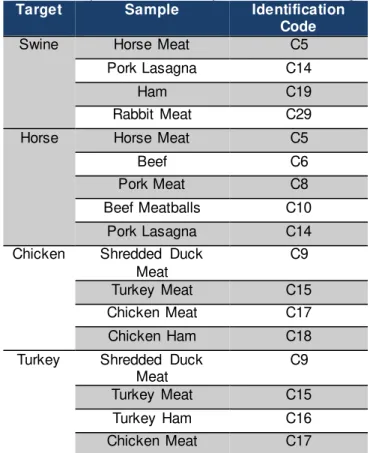
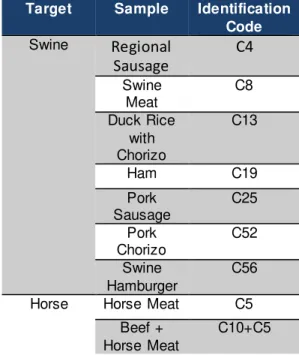
Since the optimized kits’ goal is to detect animal DNA in food matrices and to prove the labelling authenticity, the DNA must be extracted from a variety of food matrices All the food matrices were acquired in the local supermarket and comprises several types of raw meat, processed and ready-to-eat foods and vegetable and dairy products. The matrices were cut and separated into 12 aliquots of 200mg each and stored at -20ºC. Each matrix was coded with an internal Identification Code. The samples’ DNA were then extracted, quantified and verified.
The detailed list of matrices used in the optimization of the BIOPREMIER Real Time PCR detection kits is in the Table 2.1.
2.2.1.1
DNA Extraction
The extraction was performed using the Nucleospin ® Food kit from Macherey -Nagel. An extraction with this kit needs 200mg of homogenized food matrix.
2.2.1.2
DNA Quantification
After the extraction, it is necessary to quantify the DNA extracted to assure the precision in the optimization process. In this thesis, all the quantification assays were done with the Invitrogen Qubit® 3.0 quantitation kit. The kit uses the Qubit® 3.0 fluorometer to detect the fluorescence of DNA binding dyes. The quantification assay consists of the addition of 1μl of sample solution to 199μl of Qubit® working solution in a 500μl microtube, the final solution is then read in the fluorometer. The instrument directly shows the concentration of DNA in the sample solution.
Table 2.1 Food Matrices and corresponding Identification Code. All the matrices were bought in the local supermarket and it were used two aliquots of 200mg of each.
Identification Code Food Matrix
C4 Regional Sausage
C5 Horse Meat
C6 Beef
C8 Swine Meat
C9 Shredded Duck Meat
C10 Beef Meatballs
C12 Lamb Meat
C13 Duck Rice with
Chorizo
C14 Pork Lasagne
C15 Turkey Meat
C16 Turkey Ham
C17 Chicken Meat
C18 Chicken Ham
C19 Ham
C20 Potato
C21 Baby Food
C23 Corn
C24 Poultry Sausages
C25 Pork Sausages
C26 Goose Foie Gras
C28 Chicken Hamburger
C29 Rabbit Meat
C30 Soy
C31 Duck Foie Gras
C32 Cat Food
C33 Goat Cheese
C51 Pork Bean Stew
C52 Pork Chorizo
C53 Mortadella
C54 Chicken Nuggets
C56 Swine Hamburger
C57 Beef Hamburger
C60 Cow Cheese
C65 Boar Meat
C66 Vegetarian Meatballs
2.2.1.3
Sample Verification
To guarantee the authenticity of the samples, according to its label and verify the DNA in each to not mislead the optimization process, it was used the existing BIOPREMIER Real Time PCR Meat detection kits. The entire range of kits to identify meat DNA in food samples allow the detection of swine, horse, turkey, chicken, duck, cow, goat or sheep DNA.
2.2.2. PCR Reagents
The optimization process relies on several Real Time PCR’s, with a wide variety of conditions, specifically different concentrations of reagents and different PCR programs.
The reagents used in all Master Mixes throughout the experimental part of this thesis were: PCR ready water, NH4 Buffer, MgCl2, dNTPs, DNA polymerase, Deoxyuridine Triphosphate (dUTP), Uracil DNA-glycosylase (UDG). The mixes also contain DNA for reaction Internal Control (IC) and its respective set of primers and probe to ensure the quality of the reaction.
In all the mixes, a set of primers and probe are present; however, the set change according with the specific target. There are two sets of primers and probe design for each target, the one already used by BPMR and a newly designed set.
The presence of any inhibitor in the reaction mix, can be translated into a false negative result. To prevent this type of result the IC is added to the mix. The IC is amplified simultaneously with the target DNA and validates any negative result.
The dUTP and UDG serve as an additional step to avoid the laboratory contamination with PCR product. The DNA polymerase will use dUTP instead of dTTP in the extension step. The probability of the substitution of dTTP by dUTP depends on the concentration of these nucleotides. The UDG recognize and cleave the PCR product where the replacement has occurred (Burkardt, 2000; Kleiboeker, 2005).
2.2.3. Optimization of PCR conditions
The optimization of the conditions of the Real Time PCR comprises changes to the concentration of some reagents and changes in the PCR program. The changes’ goal is to improve the sensibility, specificity and yield of the PCR. The reagents which concentration was altered were MgCl2, dNTPs, dUTP, primers set specific for the target and IC DNA. The enhancer’s presence, DMSO or betaine, were also tested. The optimal annealing temperature and the specific time of each PCR step were tested after the concentrations of the reagents were defined.
Since it’s the optimization of four separated BIOPREMIER Real Time PCR Meat detection kits, four different sets of reactions, each aiming a distinct target, were completed. It was used different samples in each set, in order to test the specificity and sensibility of the kit.
The set of samples used in the optimization of each kit is listed in the Table 2.2.
Table 2.2 Samples used in the kit optimization for each target
Target Sample Identification
Code
Swine Horse Meat C5
Pork Lasagna C14
Ham C19
Rabbit Meat C29
Horse Horse Meat C5
Beef C6
Pork Meat C8
Beef Meatballs C10
Pork Lasagna C14
Chicken Shredded Duck Meat
C9
Turkey Meat C15
Chicken Meat C17
Chicken Ham C18
Turkey Shredded Duck
Meat C9
Turkey Meat C15
Turkey Ham C16
Chicken Meat C17
Table 2.3 Positive Controls for each target Target Positive
Control
Identification Code
Swine Ham C19
Horse Horse Meat C5
Chicken Chicken Ham C18
Turkey Turkey Ham C16
2.2.4. Analysis of Results
The optimal conditions were chosen by comparing the results of Real Time PCR assays and selecting the conditions with the best results. The results are shown in an amplification curve traced in a plot of fluorescence intensity by cycle. The fluorescence intensity is the strength of the fluorescence signal. Since it depends of the molecules excitation by the instrument, the results are shown in Arbitrary Units (a.u.) normalized to the base value. The intensity is proportional to the quantity of target DNA in the solution. The interpretation of the results of a Real Time PCR assay is associated with two variables: the fluorescence’s maximum intensity and the Cycle Threshold (CT). These indicators are associated with the higher concentration of initial DNA. The maximum intensity of fluorescence usually is the fluorescence intensity at the last cycle. The CT is the cycle in which the fluorescence intensity surpasses the fluorescence threshold and is associated to the start of the exponential amplification phase. A threshold is the value of intensity for which the fluorescence surpasses the background fluorescence intensity. The CT correspond to the cycle where the amplification curve intersects the threshold line. If the amplification curve isn’t visible or doesn’t intersect the threshold line, there was no DNA amplification, or the initial DNA concentration were lower than the limit of detection of the kit (“Real-time PCR : Understanding Ct,” 2011).
The CT and intensity necessary to consider an assay positive or not, varies from assay to assay. BIOPREMIER Real Time PCR meat detection kits, an assay is considered positive if has a CT lower than 37 and a fluorescence intensity higher than 50000
As said in session 2.1 Real Time PCR, the BIOPREMIER Real Time PCR meat detection kits have probes labelled with two fluorophores, the DNA probe for each target is labelled with FAM fluorophore and the IC probe is labelled with ROX fluorophore. The combination of these two probes allow a more thorough analysis.
Table 2.4 positive and negative control results
Target Detection
(FAM)
IC Detection (ROX)
Positive Control Positive Not Significant
Negative Control Negative Positive
If the controls match Table 2.4 results, the results of the samples can be interpreted as said in Table 2.5. A positive sample result means that this sample has targeted DNA. A negative sample result means that there is no targeted DNA present. An invalid result means that the reaction hasn’t occurred correctly; this result can be due to lack of some reagent or sample driven inhibition.
Table 2.5 Interpretation of the sample results Target Detection
(FAM)
IC Detection (ROX)
Interpretation
Positive Positive Positive Sample
Positive Negative Positive Sample
Negative Positive Negative Sample
Negative Negative Invalid
2.2.5. Validation Tests
The validation tests are extremely important in order to calculate the kits performance, and necessary to market launch the kits.
The set of validation tests comprises exclusivity, inclusivity, sensibility and robustness tests (Broeders et al., 2014). To ensure the validity of the kits, there should be done specificity validation tests and sensibility tests.
2.2.5.1
Exclusivity Tests
The exclusivity tests are a set of Real Time PCR assays with non-target samples, meaning that the matrices used have no target DNA. The exclusivity tests infer the affinity of the primers and
consequential specificity of the kits. The kits’ specificity indicator is the percentage of true negative
𝑆𝑝𝑒𝑐𝑖𝑓𝑖𝑐𝑖𝑡𝑦
𝐼𝑛𝑑𝑖𝑐𝑎𝑡𝑜𝑟 =
𝑇𝑟𝑢𝑒 𝑁𝑒𝑔𝑎𝑡𝑖𝑣𝑒 𝑅𝑒𝑠𝑢𝑙𝑡𝑠+100∗ 𝑇𝑟𝑢𝑒 𝑁𝑒𝑔𝑎𝑡𝑖𝑣𝑒 𝑅𝑒𝑠𝑢𝑙𝑡𝑠𝐹𝑎𝑙𝑠𝑒 𝑃𝑜𝑠𝑖𝑡𝑖𝑣𝑒 𝑅𝑒𝑠𝑢𝑙𝑡𝑠 (1)The exclusivity tests for each of the four targets used different samples. The lists of the samples used in each exclusivity test is available in the Appendix 1.
2.2.5.2
Inclusivity and Sensibility Tests
The inclusivity and sensibility tests are a set of Real Time PCR assays with samples with target DNA. The inclusivity tests ensure the kits detect the target DNA in all positive samples. The inclusivity
tests allow the calculation of the kits’ inclusivity indicator. This indicator is the percentage of true
positive results in all the inclusivity test results, including the true positive results and the false negative results, and must be 95% or higher. (Broeders et al., 2014; Kawamura, 2002). The inclusivity indicator is calculated through equation 2 (Kawamura, 2002). The sensibility tests use samples with target DNA at concentration of 100pg, 10pg, 5pg and 1pg to infer the limit of detection (LoD). The LoD is the lowest DNA concentration to having positive results in all samples.
𝐼𝑛𝑐𝑙𝑢𝑠𝑖𝑣𝑖𝑡𝑦 𝐼𝑛𝑑𝑖𝑐𝑎𝑡𝑜𝑟 =
𝑇𝑟𝑢𝑒 𝑃𝑜𝑠𝑖𝑡𝑖𝑣𝑒 𝑅𝑒𝑠𝑢𝑙𝑡𝑠 + 𝐹𝑎𝑙𝑠𝑒 𝑁𝑒𝑔𝑎𝑡𝑖𝑣𝑒 𝑅𝑒𝑠𝑢𝑙𝑡𝑠100 ∗ 𝑇𝑟𝑢𝑒 𝑃𝑜𝑠𝑖𝑡𝑖𝑣𝑒 𝑅𝑒𝑠𝑢𝑙𝑡𝑠 (2)The inclusivity and sensibility tests for each of the four targets used different samples. The lists of the samples used in each inclusivity and sensibility test is available in Table 2.6.
Table 2.6 Samples used in each kit inclusivity tes t Target Sample Identification
Code Swine
Regional
Sausage
C4
Swine
Meat C8
Duck Rice with Chorizo
C13
Ham C19
Pork
Sausage C25
Pork
Chorizo C52
Swine Hamburger
C56
Horse Horse Meat C5
Beef + Horse Meat
Pork Lasagna + Horse Meat
C14+C5
Beef Hamburger
+ Horse Meat
C57+C15
Chicken
Regional
Sausage
C4
Poultry
Sausage C24
Chicken
Meat C17
Chicken Hamburger
C28
Chicken
Nuggets C54
Turkey Turkey
Meat C15
Turkey Ham
C16
Poultry
Sausage C25
Turkey
Hamburger C55
2.2.5.3
Robustness Tests
The robustness tests are exclusivity and inclusivity tests, to infer the performance of the kits in adverse conditions. This method guarantees the performance of the tests assuming that the user’s equipment is not calibrated or shows temperature shifts (Broeders et al., 2014).
The robustness exclusivity tests comprise of regular exclusivity tests with as decrease the annealing temperature by 2ºC, to facilitate the primer annealing and facilitate the reaction.
The robustness inclusivity tests comprise of regular inclusivity tests with an increase the annealing temperature by 2ºC, to difficult the primer annealing and difficult the reaction
2.3. Results and Discussion
The results are shown in plots of intensity of fluorescence by cycle number and each plot is composed by amplification curves: target amplification curve and IC amplification curve. Both curves were analysed and compared between different assays, simultaneously. The curves were assessed according with the CT and the intensity of fluorescence, bearing in mind that higher intensity comprises a greater contamination risk.
All assays contained a positive and negative controls to evaluate the efficiency of the tests
by monitor potential contaminations, DNA degradations or operator’s mistakes.
Each PCR assay is labelled with a number that correspond to its BPMR code.
2.3.1. Chicken Detection Kit
2.3.1.1
Optimization of PCR Conditions
The PCR conditions comprises the kind and concentration of the master mix reagents and the PCR program defined to the chicken detection kit.
To guarantee the performance of the optimized solution and subsequent amplification of target DNA, preventing non-specific amplification, matrices with and without chicken DNA were used as testing samples. All samples were tested in a concentration of 1ng/μl. The results and subsequent analysis will highlight a sample with the targeted sequence (C18), and a sample without the target sequence (C9). Amplification is not expected in sample C9 because it is from duck meat. If an amplification is shown in sample C9, the PCR conditions must be reconsidered, because it means the lack of specificity of the test. To define the CT and consider an amplification positive, the amplification curve must have an intensity of fluorescence greater than the threshold of 50000.
In Table 2.7, it is shown the order of the conditions tested, as well as the PCR assays performed and the respective BPMR code.
To facilitate the comparison between different assays, plots were standardized and a maximum of 500 000 units of fluorescence intensity was defined.
Table 2.7 List of ordered and optimized PCR conditions of the Chicken Detection kit and its BPMR Code. The PCR conditions comprises the kind and concentration of the master mix reagents and the PCR program
defined.
Order Test Conditions BPMR Code
1 Type of primers and probe PCR 84 and 85
2 Concentration of MgCl2 and dNTPs PCR 102, 103 and 104
3 Presence of DMSO PCR 102 and 110
4 Concentration of primers and probe PCR 110, 111 and 112
5 Annealing Temperature PCR 110, 132 and 133
6 Duration of each cycle phase PCR 110, 152, 153 and 154
2.3.1.1.1 Type of primers and probe
The first condition optimized in the chicken detection kit was the type of primers and probe. The analysis was done to two different sets of primers and probe. The first set is already used by BPMR in the current BIOPREMIER Chicken detection kit and the second is a new set of primers and probe newly designed and never used in BPMR laboratories. Figure 2.3 shows the results obtained using the current set [A] and the new set [B] with the same samples. The samples represented are Chicken Ham, C18 (blue continuous line); Duck Meat, C9 (purple dotted line); Internal Control of the negative sample C9 (green dashed line) and Internal Control of the positive sample C18 (orange dotted and dashed line). The threshold is represented by the grey continuous flat line.
As expected, the sample C9 didn’t show amplification in any PCR, meaning that neither set
is unspecific and doesn’t detect duck.
Since the sample C18 have chicken DNA in it, it shows an amplification curve in both PCR. Analysing the CT, both curves pass the threshold near the 22nd cycle. However, the peak of fluorescence intensity of the sample C18 in PCR 84 is greater than the peak in PCR 85. This means that the current set of primes have a better affinity to the target DNA, than the new set, facilitating the annealing and consequently the DNA amplification.
Figure 2.3 Graphic representation of the PCR results: PCR 84 with current set of primers and probe [A]
and PCR 85 with the new set of primers and probe [B]. The samples represented are C18 (blue continuous line), C9 (purple dotted line), Internal Control of the negative sample C9 (green dashed line) and Internal Control of the positive sample C18 (orange dotted and dashed line). The threshold is represented by the grey
continuous flat line.
The primers and probe defined for the SUPREME Real Time Chicken detection kits are the current ones, because the peak of intensity of fluorescence of C18 is greater in PCR 84 and the set
of primers and probes doesn’t have an effect to the intensity of the fluorescence of the curve of the
IC negative samples.
2.3.1.1.2 Concentration of MgCl
2and dNTPs
The concentration of MgCl2 and dNTPs was defined after the set of primers and probe were chosen. The optimal concentration of these reagents was chosen by analysing the PCR 102, 103 and 104. The PCR 102 had the lowest concentration of both reagents, while PCR 104 used the highest concentration. The PCR 103 maintained the low concentration of MgCl2 of PCR 102 but used the high concentration of dNTPs of PCR 104. Figure 2.4 shows the PCR assays with the lowest concentration of MgCl2 and dNTPs [A], the highest concentration of the reagents [B] and with the mixture between both previous assays [C]. All assays were done using the same samples. The
0 50000 100000 150000 200000 250000 300000 350000 400000 450000 500000
0 5 10 15 20 25 30 35 40
In te n s it y ( a .u .) Cycle C9 C18
IC - N
IC - P
Threshold 0 50000 100000 150000 200000 250000 300000 350000 400000 450000 500000
0 5 10 15 20 25 30 35 40
In te n s it y ( a .u .) Cycle C9 C18
IC - N
IC -P
Threshold
A
samples represented are Chicken Ham, C18 (blue continuous line); Duck Meat, C9 (purple dotted line); Internal Control of the negative sample C9 (green dashed line) and Internal Control of the positive sample C18 (orange dotted and dashed line). The threshold is represented by the grey continuous flat line.
Figure 2.4 Graphic representation of the PCR results: PCR 102 with lowest concentration of both reagents [A], PCR 104 with the highest concentration of both reagents [B] and PCR 103 with low concentration of MgCl2 and high concentration of dNTPs [C]. The samples represented are C18 (blue continuous line), C9 (purple dotted line), Internal Control of the negative sample C9 (green dashed line) and Internal Control of the positive sample C18 (orange dotted and dashed line). The threshold is represented by the grey co ntinuous flat
line. 0 50000 100000 150000 200000 250000 300000 350000 400000 450000 500000
0 5 10 15 20 25 30 35 40
In te n s it y ( a .u .) Cycle C9 C18
IC - N
IC - P
Threshold 0 50000 100000 150000 200000 250000 300000 350000 400000 450000 500000
0 5 10 15 20 25 30 35 40
In te n s it y ( a .u .) Cycle C9 C18
IC - N
IC - P
Threshold 0 50000 100000 150000 200000 250000 300000 350000 400000 450000 500000
0 5 10 15 20 25 30 35 40
In te n s it y ( a .u .) Cycle C9 C18
IC - N
IC - P
Threshold
A
In PCR 102 (A), the results are as expected. The sample C9 didn’t amplify because it doesn’t have chicken DNA. The sample C18 with chicken DNA shows an amplification curve with a CT, approximately, in the 23rd cycle and a maximum intensity of fluorescence between 300000 and 350000. The IC of the negative sample also shows an amplification curve with a CT in the 34th cycle and with the intensity of fluorescence reaching the 200000. The IC of the positive sample didn’t amplify due to the competition between the target DNA and the IC for the reagents.
Although the positive sample C18, in PCR 104 (B), has a higher maximum intensity of fluorescence (around 500000) and a lower CT cycle (21st cycle) than the same sample in PCR 102, the sample C9 in PCR 104 shows amplification. The sample C9 doesn’t have chicken DNA in it and
it mustn’t amplify as non-specific amplification undermines the specificity of the kit.
The amplification of the negative sample and the better amplification curve of the sample C18 can be explained due to the increase in the concentration of MgCl2. The Mg2+ is a cofactor of the DNA polymerase by complexing with dNTPs forming the substrate of the enzyme. The ion also facilitates the base pairing between two strands of DNA increasing the stability of the primer annealing. In high concentrations of Mg2+, the substrate for the DNA polymerase is widely available and the high stability of primer annealing increase the probability of mispairing bases, diminish the specificity of the reaction (Markoulatos et al., 2002; Montgomery & Wittwer, 2014).
In PCR 103, the negative sample C9 didn’t amplify and the positive sample C18 have a good amplification curve with a CT in the 21st cycle and the lowest intensity of fluorescence, reaching 250000. However, the IC of the negative sample have a low and late amplification. The CT of this curve is almost in the last cycle and the intensity of fluorescence barely reach the 50000. The absence of a good amplification curve for the IC of the negative sample and the low intensity of fluorescence in the sample C18 amplification curve means that the conditions of this assay are not appropriate for meat detection.
When comparing with the PCR 102, the only condition changed was the concentration of dNTPs, which is greater in PCR 103. As said before, the Mg2+ ions complex with the dNTPs available forming the substrate that the DNA polymerase can use, however if there is too much free dNTPs it will cause a Mg2+ depletion and a consequent inhibition of the reaction, as verified in PCR 103 (Markoulatos et al., 2002).
After the analysis of the three PCR assays, the PCR 102 have the best combination of MgCl2 and dNTPs concentration. This assay used the lowest concentration of both reagents not compromising the specificity and not inhibiting the reaction. These conditions were selected for the SUPREME Real Time PCR Chicken Detection kit.
2.3.1.1.3 Presence of DMSO
negative sample C9 (green dashed line) and Internal Control of the positive sample C18 (orange dotted and dashed line). The threshold is represented by the grey continuous flat line.
Neither assay has non-specific amplification as the sample C9 didn’t amplify. The IC of
positive sample also didn’t amplify, due to the competition for the reaction reagents as it can be
verified with the high intensity of the target amplification curve.
Sample C18 shows an amplification curve in both PCR assays. The intensity of fluorescence in PCR 102 is between 300000 and 350000, which is lower when compared with the intensity of fluorescence in PCR 110, that reached 500000. The CT of the amplification curve is higher in PCR 102 (23rd cycle) than the CT of the amplification curve of the same sample in PCR 110 (21st cycle).
Figure 2.5 Graphic representation of the PCR results: PCR 102 with DMSO [A] and PCR 110 without
DMSO [B]. The samples represented are C18 (blue continuous line), C9 (purple dotted line), Internal Control of the negative sample C9 (green dashed line) and Internal Control of the positive sample C18 (orange dotted
and dashed line). The threshold is represented by the grey continuous flat line
This tendency is confirmed with the IC from the negative sample. In PCR 102, the amplification curve of this sample has a CT in the 34th cycle and the intensity of fluorescence reaches the 200000. While, in PCR 110, the amplification curve is better, having a CT in the 32nd cycle and the intensity of fluorescence almost reaches 300000.
0 50000 100000 150000 200000 250000 300000 350000 400000 450000 500000
0 5 10 15 20 25 30 35 40
In te n s it y ( a .u .) Cycle C9 C18
IC - N
IC - P
Threshold 0 50000 100000 150000 200000 250000 300000 350000 400000 450000 500000
0 5 10 15 20 25 30 35 40
In te n s it y ( a .u .) Cycle C9 C18
IC - N
IC - P
Threshold
![Figure 2.2 Mechanism of action of hydrolysis probe. [A] In the annealing step, the DNA probe (blue) and the DNA primers (orange) bind to the DNA template](https://thumb-eu.123doks.com/thumbv2/123dok_br/16497034.733622/37.892.187.713.239.612/figure-mechanism-action-hydrolysis-annealing-primers-orange-template.webp)
![Figure 2.3 Graphic representation of the PCR results: PCR 84 with current set of primers and probe [A]](https://thumb-eu.123doks.com/thumbv2/123dok_br/16497034.733622/48.892.200.717.102.645/figure-graphic-representation-pcr-results-current-primers-probe.webp)
![Figure 2.5 Graphic representation of the PCR results: PCR 102 with DMSO [A] and PCR 110 without DMSO [B]](https://thumb-eu.123doks.com/thumbv2/123dok_br/16497034.733622/51.892.202.717.358.903/figure-graphic-representation-pcr-results-pcr-dmso-dmso.webp)
![Figure 2.6 Graphic representation of the PCR results: PCR 110 with a medium concentration of primers and probe [A], PCR 111 with low concentration of this reagents [B] and PCR 112 with the highest concentration [C]](https://thumb-eu.123doks.com/thumbv2/123dok_br/16497034.733622/53.892.200.715.229.1032/figure-graphic-representation-results-concentration-concentration-reagents-concentration.webp)
![Figure 2.8 Graphic representation of the PCR results: PCR 110 [A], PCR 152 [B], PCR 153 [C] and PCR 154 [D]](https://thumb-eu.123doks.com/thumbv2/123dok_br/16497034.733622/57.892.216.707.97.1067/figure-graphic-representation-pcr-results-pcr-pcr-pcr.webp)
![Figure 2.9 Graphic representation of the PCR results: PCR 153 with higher dUTP concentration [A] and of PCR 174 with lower concentration [B]](https://thumb-eu.123doks.com/thumbv2/123dok_br/16497034.733622/59.892.201.716.102.640/figure-graphic-representation-results-higher-concentration-lower-concentration.webp)

![Figure 2.13 Graphic representation of the PCR results: PCR 86 with current set of primers and probe [A]](https://thumb-eu.123doks.com/thumbv2/123dok_br/16497034.733622/63.892.204.712.245.783/figure-graphic-representation-pcr-results-current-primers-probe.webp)
