Célia Marisa Costa Figueiredo Silveira
Licenciada em Bioquímica
Development of electrochemical nitrite
biosensors using cytochrome
c
nitrite
reductase from
Desulfovibrio desulfuricans
ATCC 27774
Dissertação para obtenção do Grau de Doutor em Química Sustentável
Orientador: Doutora Maria Gabriela Machado de Almeida, Investigadora Auxiliar da Faculdade de Ciências e Tecnologia
da Universidade Nova de Lisboa
Co-orientador: Doutor José João Galhardas de Moura, Professor Catedrático Aposentado da Faculdade de Ciências
e Tecnologia da Universidade Nova de Lisboa
Júri:
Presidente: Doutora Maria Rosa Santos de Paiva Arguentes: Doutor Lo Gorton
Doutor Christopher Michael Ashton Brett
Vogais: Doutora Margarida Maria Portela Correia dos Santos Romão Doutor Pedro Miguel Leal Rodrigues
Doutora Patrícia Mira Paes de Sousa Videira
Development of electrochemical nitrite biosensors using cytochrome
c
nitrite reductase from
Desulfovibrio desulfuricans
ATCC 27774
Célia Marisa Costa Figueiredo Silveira
2
0
1
CÉLIA MARISA COSTA FIGUEIREDO SILVEIRA Licenciada em Bioquímica
DEVELOPMENT OF ELECTROCHEMICAL NITRITE BIOSENSORS
USING CYTOCHROME C NITRITE REDUCTASE
FROM DESULFOVIBRIO DESULFURICANS ATCC 27774
Dissertação apresentada para a obtenção do Grau de Doutor em Química Sustentável pela Universidade Nova de Lisboa, Faculdade de Ciências e Tecnologia
Orientador: Doutora Maria Gabriela Machado de Almeida, Investigadora Auxiliar da Faculdade de Ciências e Tecnologia da Universidade Nova de Lisboa
Co-orientador: Doutor José João Galhardas de Moura, Professor Catedrático Aposentado da Faculdade de Ciências e Tecnologia da Universidade Nova de Lisboa
Júri
Presidente: Doutora Maria Rosa Santos de Paiva Arguentes: Doutor Lo Gorton
Doutor Christopher Michael Ashton Brett
Vogais: Doutora Margarida Maria Portela Correia dos Santos Romão
Doutor Pedro Miguel Leal Rodrigues
Doutora Patrícia Mira Paes de Sousa Videira
Development of electrochemical nitrite biosensors using cytochrome
c nitrite reductase from Desulfovibrio desulfuricans ATCC 27774
Copyright by Célia Marisa Costa Figueiredo Silveira, Faculdade de Ciências e Tecnologia da Universidade Nova de Lisboa e Universidade Nova de Lisboa
Novembro 2011
A Faculdade de Ciências e Tecnologia e a Universidade Nova de Lisboa tem o direito, perpétuo e sem limites geográficos, de arquivar e publicar esta dissertação através de exemplares impressos reproduzidos em papel ou de forma digital, ou por qualquer outro meio conhecido ou que venha a ser inventado, e de a divulgar através de repositórios científicos e de admitir a sua cópia e distribuição com objectivos educacionais ou de investigação, não comerciais, desde que seja dado crédito ao autor e editor.
- v -
Acknowledgments
Many people have given me valuable help during my Ph.D. project. I owe them much and I
hope that I will meet them again in the future.
First of all I would like to express my gratitude to my supervisors: Prof. José J.G. Moura,
who gave me the opportunity to work in his lab and enabled my studies and research and
also for the light shedding discussions. To Prof. M. Gabriela Almeida, I have to thank the
opportunity she gave me to come (and go ) work in these projects, for all her support,
teachings, ideas, encouragement and a lot more that, as she knows, I don’t have much talent
to express.
I thank Prof. Isabel Moura for allowing me to work in her lab and for all the helpful
discussions and support over these years.
I would like to acknowledge all the collaborators, which have contributed for this work and
made it possible.
To Stephane Besson for all his help in the kinetic studies and also to Sergey Bursakov.
Thanks to the sol-gel team from Faculdade de Farmácia, Universidade do Porto: Conceição
Montenegro, Alberto Araújo and Sofia Gomes who kindly received me in their lab in Porto.
I would like to thank Serge Cosnier and his group in CNRS Grenoble for the help in the
carbon nanotubes work and for the scientific discussions. To Michael Holzinger, Karine
Gorgy, Arielle LePellec and of course to Jessica Baur, who kept my electrodes working after I
came back to Portugal, thanks.
To Ana Viana from Faculdade de Ciências, Universidade de Lisboa, for the AFM analysis; to
Smijla Todorovic, for the Raman spectroscopy studies in ITQB and to Rui Silva from CENIMAT
FCT-UNL, for the SEM analysis, I thank all the inputs to the work, helping in the
morphological characterization of the biosensors, and for the helpful discussions.
From CCMar Universidade do Algarve, thanks to Pedro Rodrigues for having me in his lab
and allowing me to perform the DIGE experiments and to Odete Cordeiro and Mahaut De
Vareilles for all their help.
Thanks to Prof. Manuel F.R. Pereira from Laboratório Associado LSRE/LCM, Departamento
de Engenharia Química, Faculdade de Engenharia, Universidade do Porto for providing the
I thank Professor Bart Devreese from the University of Ghent, Mass Spectrometry
Proteomics group (L-ProBE), for the mass spectrometry analysis.
A special thank you to Ana Teresa Lopes, the lab technician for Grupo de Bioinorgânica
and Grupo de Biofísica e Bioquímica de Proteínas at REQUIMTE, for putting up with all my
questions, requests and everything else I kept asking of her all these years. Also thanks for
the teachings in anaerobic bacteria cultures.
To Beth Sommerville, who worked in the proteomics project, I thank all her patience and
hard effort.
I thank Marta Pimpão for all her work in the carbon nanotubes biosensors and for all the
good times in the lab.
I express my appreciation to all my present and past colleagues from Grupo de
Bioinorgância and Grupo de Biofísica e Bioquímica de Proteínas. I will remember always their
friendship, help, advices and shared knowledge, in and out of the lab. I have learned with all
and I thank them. For the ones who accompanied me in these last times, Gabi, Pablo, Sofia,
Marta Carepo, Raquel, Patricia, Catarina, Natália, Luís, Jacopo, Simone, Susana, Rui Almeida,
Leonardo, Luisa, Américo, Cristiano, Ana Teresa, Alexandra, thanks for everything.
A special thank you to Luisa Maia, for listening to me, always knowing how to cheer me
up, and helping me put everything in the right perspective.
To Alexandra Serra I thank for sharing knowledge and lab space with me and for being my
Ph.D. partner and friend.
Agradeço ao Rui Duarte, colega de laboratório e de gabinete pela ajuda e pelos momentos
divertidos que passamos. Ficarão sempre na minha memória, tal como ele.
Agradeço aos meus pais e irmã por me aturarem e ao resto da família e amigos por
perguntarem e demonstrarem sempre o seu apoio durante este percurso.
Finally, I thank for the financial support provided by REQUIMTE and Fundação para a
Ciência e Tecnologia (POCI/QUI/58026/2004 and SFRH/BD/28921/2006).
- vii -
Abstract
This thesis describes the construction of novel nitrite biosensors based on the cytochrome
c nitrite reductase (ccNiR) from the sulfate reducing bacteria Desulfovibrio desulfuricans
ATCC 27774.
The kinetic behavior of the enzyme was firstly evaluated using spectrophotometric
methods and a direct electrochemical approach. Due to ccNiR’s fast kinetics, electron
delivering from reduced mediators was rate-limiting in solution assays, so only apparent
kinetic constants can be estimated. Overall, the methods produced comparable results and
showed that the binding affinity for nitrite decreases whereas turnover increases with the
reduction potential.
The biosensing strategies presented have used amperometric/voltammetric transduction
and explored the fact that ccNiR displays a non-mediated electrochemical response to nitrite when adsorbed onto pyrolytic graphite electrodes. Different strategies were proposed for
protein immobilization.
In the sol-gel biosensor the protein was successfully incorporated in a porous silica glass
while promptly displaying catalytic currents. The minimum detectable nitrite concentration
was 120 nM. The biosensor’s response was stable up to two weeks and the analysis of nitrite
in freshwaters, using the standard addition method, was highly accurate.
Nanostructured configurations based on single- and multi-walled carbon nanotubes
deposits greatly enhanced the direct electron transfer of ccNiR. At optimal conditions, the
sensitivity to nitrite was 2.4 A.M-1.cm-2, the highest reported in nitrite biosensing. The
addition of protective coatings (e.g. laponite clay) increased the bioelectrode stability (60%
response after 248 days).
Surfactant films provided suitable microenvironments for ccNiR direct electrochemical
response. The biomembrane-like modifiers enabled a considerable augmentation of catalytic
currents when compared to bare electrodes (10 fold and 30% increased sensitivity with
n-dodecyl-β-D-maltoside).
A preliminary proteome analysis of D. desulfuricans cells grown with nitrate or sulfate as
electron acceptor was performed by 2D electrophoresis. It was shown that the oxidizing
substrate influences the protein expression, with ca. 15% of proteins having significant
changes.
Keywords: nitrite biosensors, cytochrome c nitrite reductase, direct electron transfer,
- ix -
Resumo
Esta tese teve por objectivo a construção de biossensores para a quantificação de nitrito
baseados na redutase do nitrito multihémica (ccNiR) extraída de Desulfovibrio desulfuricans
ATCC27774.
Em primeiro lugar, as características cinéticas da enzima foram estudadas recorrendo a
métodos espectrofotométricos e electroquímicos. Devido à elevada eficiência catalítica, a
cinética enzimática é limitada ao nível do redutor (mediador electrónico), pelo que as
constantes cinéticas são sempre aparentes. Os dois métodos usados produziram resultados
comparáveis e indicaram que a afinidade para o substrato diminui, enquanto que a
constante catalítica aumenta, com o potencial de redução.
A transdução da resposta dos biossensores assentou em técnicas
voltamétricas/amperométricas, explorando o facto da ccNiR apresentar uma resposta
electroquímica não mediada para nitrito quando adsorvida em eléctrodos de grafite
pirolítica. Para a imobilização da proteína foram testados diferentes materiais.
No biossensor preparado com sol-gel, a enzima apresentou respostas catalíticas rápidas
enquanto incorporada numa matrix não condutora. O limite de detecção de nitrito foi de
120nM. A resposta do sensor foi estável durante duas semanas e a quantificação de nitrito
em amostras reais foi bastante exacta.
Depósitos nano-estruturados à base de nanotubos de carbono permitiram aumentar
significativamente a resposta electroquímica da ccNiR. Em condições optimizadas, a
sensibilidade para nitrito foi 2.4 A.M-1.cm-2, o valor mais elevado até agora reportado. A
adição de camadas protectoras de laponite garantiu o prolongamento da estabilidade do
eléctrodo até 248 dias (60% da resposta inicial).
A utilização de filmes de surfactantes providenciaram um ambiente adequado ao aumento
da resposta catalítica da ccNiR. Com o n-dodecyl-β-D-maltoside, foi observado um
incremento de 30% na sensibilidade da resposta e de 10x nas correntes máximas.
A análise preliminar do proteoma de células de D. desulfuricans, crescidas com diferentes
substratos oxidantes (nitrato ou sulfato) foi realizada por electroforese 2D. O substrato
respiratório provou ter influência na expressão proteica, com cerca de 15% de proteínas a
apresentarem alterações.
Palavras-chave: biossensores de nitrito, redutase do nitrito multihémica, transferência
- xi -
Table of contents
Acknowledgments v
Abstract vii
Resumo ix
Table of contents xi
Figure Index xvii
Table Index xxiii
List of abbreviations and symbols xxv
Chapter 1 - General Introduction
1.1) Biosensors 3
1.2) Nitrite assessment 5
1.2.1) Human health risks 6
1.2.2) Environmental issues 7
1.2.3) Physiological significance/ Biological activity 7
1.2.4) Detection methods 8
1.3) Nitrite biosensors 9
1.3.1) Microbial based biosensors 11
1.3.2) Biosensors based on nitrite reductases 12
1.3.2.1) Amperometric and voltammetric biosensors 12
1.3.2.1.1) Biosensors based on mediated electrochemistry 14
a) Immobilization 15
a.1)Enzyme immobilization 15
a.2) Mediator immobilization 17
b) Analytical parameters 18
c) Stability 18
d) Real sample analysis 19
e) Response times 19
1.3.2.1.2) Biosensors based on direct electrochemistry 19
1.3.2.2) Potentiometric biosensors 20
1.3.2.3) Condutimetric biosensors 20
1.4) Cytochrome c nitrite reductase 21
1.5) Objectives 25
Chapter 2 - Kinetic characterization of cytochrome
c
nitrite reductase
2.1) Introduction 29
2.2) Experimental 32
2.2.1) Reagents 32
2.2.2) Enzyme assays 32
2.2.2.1) Discontinuous assay 32
a) Determination of ammonia - Indophenol blue method 33
b) Determination of nitrite - Griess method 34
2.2.2.2) Continuous enzymatic assay 36
2.2.2.3) Electrochemical assay 37
a) Electrochemistry 37
b) Electrode preparation 37
2.2.3) Molecular Docking Simulations 37
2.3) Results and Discussion 39
2.3.1) Mediated spectrophotometry 39
2.3.1.1) Determination of ccNiR enzymatic reaction product 39
2.3.1.2) Molecular interaction between ccNiR and redox mediators 42
2.3.1.3) Determination of ccNiR’s kinetic parameters 44
2.3.2) Direct electrochemistry 49
2.4) Temperature effect on ccNiR kinetic parameters 53
2.5) Conclusions 55
Chapter 3 - Sol-gel based biosensor
3.1) Introduction 59
3.1.1) Direct electron transfer based biosensors 59
3.1.2) Sol-gel based biosensors 60
3.2) Experimental 63
3.2.1) Reagents 63
3.2.2) Enzyme assays 63
- xiii -
3.2.4) Biosensor preparation 64
3.2.5) Characterization of the ccNiR/sol-gel film 66
3.2.5.1) Scanning electron microscopy (SEM) 66
3.2.5.2) Atomic force microscopy (AFM) 66
3.2.5.3) UV-vis spectroscopy 66
3.2.5.4) Resonance Raman spectroscopy 66
3.3) Results and discussion 67
3.3.1) Biosensor optimization 67
3.3.2) Characterization of the ccNiR/sol-gel membrane 72
3.3.2.1) Morphology 72
3.3.2.2) Spectroscopy 75
3.3.2.3) Electrochemistry 78
3.3.3) Response to nitrite 78
3.3.4) Interferences 83
3.3.5) Biosensor stability 84
3.3.6) Biosensor application in real samples 85
3.4) Conclusions 86
Chapter 4 - Carbon nanotubes based biosensors
4.1) Introduction 89
4.2) Experimental 93
Part A – Single-walled carbon nanotubes biosensor
4.2.1) Reagents 93
4.2.2) Electrochemical measurements 94
4.2.3) Bioelectrode preparation 94
4.2.4) Scanning electron microscopy (SEM) 95
Part B - Modified multi-walled carbon nanotubes biosensor
4.2.5) Reagents 95
4.2.6) MWCNT dispersions 96
4.2.7) Bioelectrode preparation 97
4.2.8) Electrochemical measurements 97
4.2.9) Scanning electron microscopy (SEM) 98
Part A – Single-walled carbon nanotubes biosensor
4.3.1) Morphologic characterization 99
4.3.2) Bioelectrode optimization 99
4.3.3) Bioelectrode response to nitrite 102
4.3.4) Interferences 104
4.3.5) Bioelectrode stability 105
Part B - Modified multi-walled carbon nanotubes biosensor
4.3.6) Non-catalytic signals 108
4.3.7) Bioelectrodes response to nitrite 110
4.3.8) Bioelectrode optimization 113
4.3.9) Morphological characterization 115
4.4) Conclusions 118
Chapter 5 - Cytochrome
c
nitrite reductase direct electron transfer in
surfactant films
5.1) Introduction 123
5.2) Experimental 128
5.2.1) Reagents 128
5.2.2) Biolectrode preparation 128
5.2.3) Electrochemical measurements 129
5.2.4) UV-Vis spectroscopy 130
5.3) Results and discussion 131
5.3.1) Non-catalytic direct electrochemistry of ccNiR in surfactant films 131
5.3.2) UV-vis characterization of ccNiR in the presence of surfactants 136
5.3.3) Nitrite reduction by ccNiR - surfactant films 139
5.4) Conclusions 143
Chapter 6 –
Desulfovibrio desulfuricans
ATCC 27774 Respiratory Flexibility – a
proteomic study
6.1) Introduction 147
6.1.1) Final electron acceptors: nitrate vs sulfate 148
6.1.2) Economical impact 150
- xv -
6.2) Experimental 152
6.2.1) Bacterial growth 152
6.2.2) Sample preparation 154
6.2.3) Sample preparation for 2DE and protein quantification 154
6.2.4) Two-Dimensional gel electrophoresis 154
6.2.5) Gel staining 156
6.2.6) Gel analysis 156
6.2.6) Protein identification 156
6.3) Results and Discussion 157
6.3.1) Cell growth 157
6.3.2) D. desulfuricans soluble proteome 158
6.3.3) D. desulfuricans membrane proteome 166
6.3.4) Soluble and membrane proteomes - considerations 170
6.3.5) ccNiR in the proteome of D. desulfuricans 171
6.4) Conclusions 174
Chapter 7 – Conclusions and Future Perspectives
7.1) Remarks on ccNiR DET based biosensors 179
7.2) Remarks on the proteomic study of D. desulfuricans cells 183
7.3) Future work 183
References 187
Annex 1 - Protein purification 201
- xvii -
Figure Index
Figure 1.1 - Schematic representation of the working principle of biosensors. 4
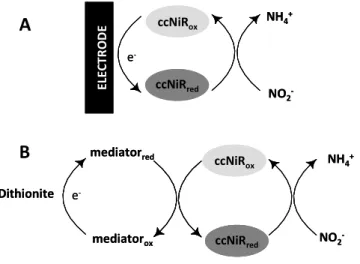
Figure 1.2 - Schematic representations of the working principles of enzymatic nitrite biosensors: A) Mediated transduction, B) Direct transduction. (medox – mediator in the
oxidized form; medred – mediator in the reduced form; NiRox – NiR oxidized state; NiRred –
NiR reduced state).
10
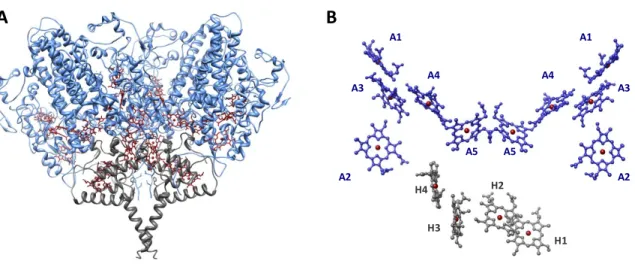
Figure 1.3 - Desulfovibrio vulgaris Hildenborough ccNiR A) view of the NrfA4NrfH2
complex: the catalytic subunit (NrfA) is depicted in blue and the electron donor subunit (NrfH) in gray, heme groups are shown in dark red; B) relative spatial arrangement of heme groups in a NrfA2NrfH complex, NrfA and NrfH hemes are tagged An and Hn,
respectively. Figure was prepared with Chimera software with pdb entry 2J7A from Brookhaven protein Data Bank [68].
22
Figure 2.1 - Reaction schemes for electrochemical A) and solution B) assays of ccNiR
activity. 31
Figure 2.2 - Ammonia calibration curve determined by the indophenol blue method. Cell
volume 1.104 mL. Linear regression y = 0.0140 x + 0.0143, R2 = 0.9997. 34
Figure 2.3 - Nitrite calibration curve determined by the Griess method. Cell volume 2 mL.
Linear regression y = 0.0234 x + 0.0220, R2 = 0.9974. 35
Figure 2.4 - Progression curves for ammonia (filled symbols) and nitrite (open symbols) for ccNiR reaction, in the presence of equivalent electron concentrations of dithionite
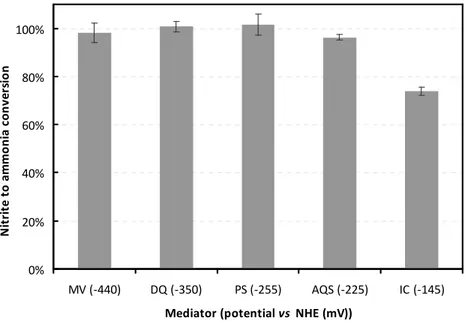
reduced mediators MV ( ); DQ ( ); PS ( ); AQS ( ) and IC (xж). Enzyme
concentration was 0.7 nM for MV, DQ, and PS assays, 7 nM for AQS, and 14 nM for IC. All assays were performed at 37°C. In the case of DQ assays the values for ammonia detection were corrected by adding a 25% to the final value, since a consistent 25% error was found in control experiments where ammonia was quantified in DQ containing solutions.
40
Figure 2.5 - Percentage of conversion of nitrite to ammonia in the presence of each mediator. Values were determined as the average of three enzymatic assays performed as described in the experimental section (reaction time 4 minutes). Dithionite was used as reducing agent. All assays were performed at 37°C. Enzyme concentration was 0.7 nM for MV, DQ and PS assays, 7 nM for AQS, and 14 nM for IC.
41
Figure 2.6 - ccNiR specific activities determined with an equivalent electron concentration of the mediators and with a saturating nitrite ( ) and hydroxylamine ( ) concentration. Incubation time was 4 minutes, that is, within the range of ammonia production at a linear rate. Dithionite was used as reducing agent. All assays were performed at 37°C. Enzyme concentration was 0.7 nM for MV, DQ and PS assays, 7 nM for AQS, and 14 nM for IC.
42
Figure 2.7 - Interaction complexes of ccNiR with the mediators MV, DQ, PS, AQS and IC. First five solutions obtained with the molecular docking algorithm PatchDock. Heme groups are depicted in dark red and mediators are represented in blue.
43
Figure 2.8 - Enzyme activities determined using 0.16 mM of nitrite at 37°C, with increasing concentrations of MV ( ) and DQ ( ), corresponding to absorbance values in the range 0.5 to 1.2. Enzyme concentration was 0.6 nM for MV and 7.4 nM for DQ assays.
Figure 2.9 - Enzyme activities determined using 0.16 mM of nitrite with increasing concentrations of PS. Enzyme concentration was 7.4 nM. Assays were conducted in 50 mM tris-HCl pH 7.6 at 37°C.
45
Figure 2.10 - Enzyme activities determined using equivalent electron concentrations (0.16 mM) of MV ( ), DQ ( ), PS ( ), at 37°C, with increasing nitrite concentrations. The solid lines represent the simulations to the Michaelis-Menten equation. Enzyme concentration was 0.6 nM for MV, 1.5 nM for DQ, and 7.4 nM for PS assays.
47
Figure 2.11 - Effect of electrode rotation speed on the current response of a ccNiR film on a PG electrode. The assays were carried out at 37°C in the presence of 10 µM of nitrite.
50
Figure 2.12 - A) Amperomograms of PG electrodes with immobilized ccNiR, in the presence of increasing amounts of nitrite, recorded at (a) −440mV, (b) −350mV, and (c)
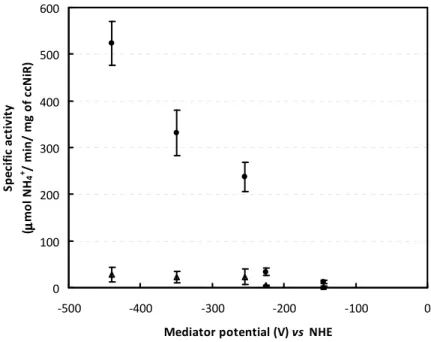
−255mV. B) Calibration curves performed at −440mV ( ), −350mV ( ) and −255mV ( ).
The assays were carried out at 37°C in phosphate buffer 0.1 M, pH 7.6, with an electrode rotation speed of 600 rpm. The enzyme amount on the electrodes was ca. 4.3 ± 0.6 pmol.cm-2. The solid lines represent the Michaelis-Menten simulations of enzyme
kinetics.
51
Figure 2.13 - Temperature effect on the specific activity of ccNiR. Assays were performed with 0.6 nM of ccNiR, 160 µM of nitrite and ca. 0.08 mM of dithionite reduced MV (Abs 604 nm ca. 1) in 0.2 M phosphate buffer, pH 7.6.
54
Figure 3.1 - Sol-gel formation reactions from silica based alkoxide precursors. 61
Figure 3.2 - A) Cyclic voltammograms of a sol-gel/ccNiR film (a) with (10 µM) and (b) without nitrite. The sol-gel was prepared with the optimal composition 225:1 H2O:EETMS
molar ratio and 74 pmol of ccNiR. B) Schematic representation of the reaction mechanism that describes the voltammograms profile, i.e., the enzyme undergoes a reversible electrochemical reduction followed by an irreversible chemical reaction (EC’).
67
Figure 3.3 - Effect of the enzyme amount on the biosensor’s response to nitrite, as determined by cyclic voltammetry. Sol-gel prepared with 1:225 EETMS:H2O molar
proportion. A) sensitivity; B) linear range.
71
Figure 3.4 - SEM micrographs of A) ccNiR/sol-gel film (signal amplification ×22, 5 kV), B) ccNiR/sol-gel film (signal amplification ×50, 5 kV), C) ccNiR in HEPES buffer doped sol-gel film (signal amplification ×50, 5 kV) and D) sol-gel film with phosphate buffer (signal amplification ×1000, 5 kV). The sol-gel was prepared with 74 pmol of enzyme and a 225:1 H2O:EETMS molar ratio and was deposited on pyrolytic graphite disks.
72
Figure 3.5 - SEM-EDS analysis of a ccNiR doped sol-gel film (74 pmol of enzyme and 225:1 H2O:EETMS molar ratio). A) SEM micrograph (signal amplification x500, 5kV), EDS graph
of points in A: B) 1, C) 2, D) 3 and E) 6.
74
Figure 3.6 - AFM images of A) sol-gel/ccNiR film, B) sol-gel/phosphate buffer film (control
electrode) deposited on highly oriented pyrolytic graphite. 75
Figure 3.7 - UV-Vis spectra of ccNiR: A) immobilized in sol-gel matrix in a glass slide hydrated in supporting electrolyte, B) in 0.1 M phosphate buffer pH 7.6, in the (a) oxidised and (b) dithionite reduced forms.
- xix -
Figure 3.8 - Experimental and component resonance Raman spectra of a ccNiR doped glass slide. Experimental spectrum is an average of 4, measured from different spots on the surface with 413 nm excitation, 20 s accumulation time and 750 mW laser power. The most prominent oxidation/spin state marker bands are indicated; dotted bands (1367 cm-1 and 1495 cm-1) are assigned to the high spin species and dashed band to
photoreduced protein.
77
Figure 3.9 - A) Current response for sol-gel/ccNiR modified electrodes to successive nitrite injections B) Calibration curves registered at different working potentials: (a) -0.9 V, (b) -0.7 V and (c) -0.5 V vs Ag/AgCl. Sol-gel/ccNiR formulation: 74 pmol of enzyme and 225:1 H2O:EETMS molar ratio.
79
Figure 3.10 - Calibration curves of a sol-gel/ccNiR ( ) and a sol-gel/ccNiR−graphite ( ) biosensor. Sol-gel/ccNiR formulations: 74 pmol of enzyme, 225:1 H2O:EETMS molar ratio
and 1 mg/mL of graphite for the doped preparation. The assays were carried out at -0.9V
vs Ag/AgCl.Linear regression y = -0.0493 x + 0.1844, R2 = 0.9945.
81
Figure 3.11 - A) Current response of a PGE/sol-gel/ccNiR biosensor to successive nitrite injections, B) Calibration curve ( ) and Michaelis-Menten simulations of enzyme kinetics (—). Sol-gel/ccNiR formulation: 74 pmol of enzyme, 225:1 H2O:EETMS molar ratio and 1
mg/mL of graphite. The assays were carried out at -0.9V vs Ag/AgCl with an electrode rotation speed of 600 rpm.
82
Figure 3.12 - Time effects on the biosensor sensitivity for nitrite determination. Sensitivity values were given by the slope of calibration curves performed periodically throughout 180 days. Inset: first 25 days of calibration. Sol-gel/ccNiR formulation: 74 pmol of enzyme and 225:1 H2O:EETMS molar ratio. Catalytic currents were measured at
-0.9V vs Ag/AgCl.
84
Figure 4.1 - SEM images of A) glassy carbon plate electrode covered with 12 layers of SWCNTs without enzyme coating; B) Same setup as (A) following immobilization of ccNiR. SEM conditions: beam length 4.8-5.2 mm, magnification x50 000, acceleration voltage 5 kV.
99
Figure 4.2 - Cyclic voltammograms of A) PG/ccNiR electrode (—) and of a PG/12-SWCNT/ccNiR electrode (—): (a) without NO2- and (b) with 10 µM NO2-. B) Same set of
experiments performed with GC electrodes.
100
Figure 4.3 - Effect of SWCNT layers on the maximum current values determined for the
reduction of nitrite by SWCNT/ccNiR modified PG ( ) and GC ( ) electrodes. 102
Figure 4.4 - Cyclic voltammograms of a PG/12-SWCNT/ccNiR bioelectrode in the
presence of varying nitrite concentrations. 102
Figure 4.5 - A) Calibration plot for nitrite response and B) correspondent linear regions,
for ( )PG/12-SWCNT/ccNiR and ( )PG/ccNiR electrodes. 103
Figure 4.6 - SWCNTs based biosensors sensitivity for nitrite as a function of time for
PG/12-SWCNT/ccNiR ( ); PG/12-SWCNT/ccNiR&polypyrrole ( ) and
PG/12-SWCNT/ccNiR/laponite ( ) electrodes. Sensitivity values were given by the slope of calibration curves performed periodically throughout 248 days.
105
Figure 4.7 - Matrix effect on the biosensors response to nitrite: maximum current density ( ); sensitivity ( ), as determined by the slope of the calibration curves for the first day calibration of the three types of electrode.
Figure 4.8 - Cyclic voltammograms of PG/5-MWCNT/ccNiR electrodes: A) MWCNT_orig (THF suspension), B) MWCNT_O2, C) MWCNT_HNO3, D) MWCNT_HNO3_N2_400 and E)
MWCNT_HNO3_N2_600.
109
Figure 4.9 - Effect of the surface chemical properties of the MWCNT on the maximum currents obtained with PG/5-MWCNT/ccNiR electrodes. A) point of zero charge, B) mass percentage of oxygen on the surface, C) BET (Brunauer-Emmet-Teller) surface area.
112
Figure 4.10 - Effect of the number of deposited nanotube layers on the non-catalytic and catalytic response of PG/MWCNT_O2/ccNiR biosensors. A) Current density in the absence
of nitrite (determined at -0.380 V vs SCE), B) ( ) Maximum current density values for nitrite reduction (measured at saturating concentrations of nitrite) and ( ) sensitivity, as determined by the slope of the calibration curves.
114
Figure 4.11 - Representative SEM images of MWCNT_O2 and ccNiR deposited on
pyrolytic graphite. A) 15 layers of MWCNT_O2, B) same setup as (A) after ccNiR
immobilization, C) mixed film of ccNiR and MWCNT_O2; D) layer of ccNiR directly over
the PG, E) sectional cut of setup (A), F) same sample at higher magnification.
116
Figure 5.1 - Schematic representations of surfactants in various forms, the headgroups are represented by the red circles and the hydrophobic tails are in blue. A) Spherical micelles, B) hemimicelles, C) bilayers and D) multilayers on electrode surfaces.
124
Figure 5.2 - Surfactant structures. Cationic head group: A) CTAB, B) DDAB; anionic: C) DHP, D) SDS, E) sodium choleate; non-ionic: F) DDM (n-dodecyl-β-D-maltoside); amphoteric: G) DMPC, H) Zwittergent 3-10.
125
Figure 5.3 - Cyclic voltammograms of ccNiR–surfactant films casted on PG electrodes in 0.1 M KCl and tris-HCl 50 mM pH 7.6; scan rate 20 mV/s. A) DDM, B) Zwittergent 3-10, C) SDS, D) cholic acid, E) DDAB, F) CTAB and G) control electrode with ccNiR only.
132
Figure 5.4 - A) Cyclic voltammograms of PG/ccNiR–DDAB electrode in 0.1 M KCl and 50 mM tris-HCl buffer pH 7.6 at different scan rates; from inside to outside: 0.0025, 0.005, 0.01, 0.02, 0.035, 0.05, 0.075, 0.1, 0.15, 0.2, 0.25 V.s-1, respectively. B) Linear dependence of the cathodic ( ) and anodic ( ) peak currents on the potential scan rate. Linear regressions y = -2.85x - 0.11, R2 = 0.999 and y = 2.05x + 0.03, R2 = 0.998,
respectively.
133
Figure 5.5 - Change in the potential of ccNiR’s signal in DDAB films as a function of pH. A) Cyclic voltammograms of PG/ccNiR–DDAB electrode at pH 7.6 and pH 4; scan rate 20 mV/s. B) Linear dependence of the formal potential of the redox couple depicted in (A) on the pH. Linear regression y = -0.0532x - 0.0885, R2 = 0.997.
136
Figure 5.6 - UV-Vis spectra of (gray line) oxidized and (red line) dithionite reduced A) ccNiR–DDM, B) ccNiR–Zwittergent 3-10, C) ccNiR–SDS, D) ccNiR–cholic acid, E) ccNiR– DDAB, F) ccNiR–CTAB and G) ccNiR solutions after one hour incubation in 0.1 M phosphate buffer pH 7.6.Enzyme concentration was 0.1 mg/mL and surfactants were 2XCMC (cf. Table 5.1).
137
Figure 5.7 - Cyclic voltammograms of a PG/ccNiR–DDAB bioelectrode in the presence of
varying nitrite concentrations. 139
Figure 5.8 - Effect of surfactant type on the sensitivity of PG/ccNiR–surfactant bioelectrodes, as defined by the slope of the linear part of the calibration curve. Surfactant concentration was 2 times the CMC. Zwitt – Zwittergent 3-10.
- xxi -
Figure 5.9 - Effect of surfactant type on the maximum current densities of PG/ccNiR– surfactant bioelectrodes at saturating nitrite concentrations (>0.8 mM). Surfactant concentration was 2 times the CMC. Zwitt – Zwittergent 3-10.
141
Figure 6.1 - Simplified A) Sulfur and B) Nitrogen cycles indicating steps were sulfate
reducing bacteria are involved. 149
Figure 6.2 - Schematic presentation of the reaction of CyDye DIGE fluor minimal dyes
with the amino group of a lysine residue of a protein [234]. 151
Figure 6.3 - Growth curves of D. desulfuricans cells in ( ) nitrate and ( ) sulfate based
VMN media. 157
Figure 6.4 - Proteomic analysis of the soluble proteins fraction of D. desulfuricans grown for 8h with nitrate or sulfate media. Image overlay using DIGE technology resulting from one gel experiment containing three differentially labeled samples: nitrate Cy3 (green), sulfate Cy5 (red), and pooled-sample internal standard Cy2 (blue). Gel images are oriented with high molecular weight on top to low molecular weight towards the bottom of the gel. 50 µg of each labeled sample applied on an 18 cm IPG strip pH 3-10NL, 12.5% polyacrylamide gel.
159
Figure 6.5 - Proteomic analysis of the soluble proteins fraction of D. desulfuricans grown for 16h with nitrate or sulfate media. Image overlay using DIGE technology resulting from one gel experiment containing three differentially labeled samples: nitrate Cy3 (green), sulfate Cy5 (red), and pooled-sample internal standard Cy2 (blue). Gel images are oriented with high molecular weight on top to low molecular weight towards the bottom of the gel. 50 µg of each labeled sample applied on an 18 cm IPG strip pH 3-10NL, 12.5% polyacrylamide gel. Circles indicate proteins identified by MS.
160
Figure 6.6 - Proteomic analysis of the soluble proteins fraction of D. desulfuricans grown for 24h with nitrate or sulfate media. Image overlay using DIGE technology resulting from one gel experiment containing three differentially labeled samples: nitrate Cy3 (green), sulfate Cy5 (red), and pooled-sample internal standard Cy2 (blue). Gel images are oriented with high molecular weight on top to low molecular weight towards the bottom of the gel. 50 µg of each labeled sample applied on an 18 cm IPG strip pH 3-10NL, 12.5% polyacrylamide gel.
161
Figure 6.7 - Overview of the 2D gel profile of the membrane fraction of D. desulfuricans
cells grown for 16h with nitrate media. Circles indicate proteins identified by MS: red ones refer to proteins up-regulated in sulfate growths, green to nitrate while blue circles indicate proteins without differential expression. The black arrow indicates the place of protein application in the 1st dimension gel strip by cup-loading. 60 µg of nitrate membrane sample were applied on an 18 cm IPG strip pH 3-10NL, 12.5% polyacrylamide gel stained with silver nitrate.
166
Figure 6.8 - Overview of the 2D gel profile of the membrane fraction of D. desulfuricans
cells grown for 16h with sulfate media. Circles indicate proteins identified by MS: red ones refer to proteins up-regulated in sulfate growths, green to nitrate while blue circles indicate proteins without differential expression. The black arrow indicates the place of protein application in the 1st dimension gel strip by cup-loading. 60 µg of sulfate
membrane sample were applied on an 18 cm IPG strip pH 3-10NL, 12.5% polyacrylamide gel stained with silver nitrate.
Figure 6.9 - Co-migration gel of membrane fraction of D. desulfuricans cells grown in nitrate media and ccNiR. Gray squares indicate the expected coordinates of NrfA and NrfH subunits of ccNiR. 5 µg of nitrate membrane sample and 5 µg of purified ccNiR were applied on an 7 cm IPG strip pH 3-10NL, 12.5% polyacrylamide gel stained with silver nitrate.
171
Figure 6.10 - PAGE analysis of ccNiR samples (10 µg) incubated with 2D solubilization solutions: 7 M Urea, 2 M thiourea, 0.5% IPG, 0.28% DTT and a) 2% CHAPS, b) 4% CHAPS c) 2% CHAPS & 2% ASB-14 and d) 2% CHAPS & 2% Zwittergent 3-10. 10 % Polyacrylamide native gel, stained with Coomassie blue.
- xxiii -
Table Index
Table 1.1 - Description and analytical parameters of nitrite reductase based biosensors (NA – not applicable; ND – not determined; MET – mediated electron transfer; DET – direct electron transfer; * – original values were converted to the same final unit).
13
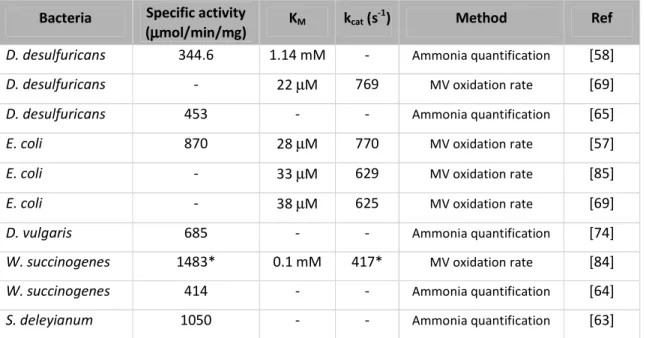
Table 2.1 - Activities and kinetic parameters for NrfA from different bacterial sources. * – original values were converted to the same final unit.
29
Table 2.2 - Mediators structure, formal reduction potential and molecular extinction
coefficient. 35
Table 2.3 - Kinetic parameters for the nitrite reduction reaction catalyzed by D. desulfuricans ccNiR obtained by the continuous spectrophotometric assay.
49
Table 2.4 - Kinetic parameters for nitrite reduction catalyzed by D. desulfuricans ccNiR obtained by the continuous spectrophotometric and the amperometric assays. * – Turnover number was determined according to [76].
53
Table 3.1 - Compositions of sol-gel based nitrite biosensors prepared with 3-APTMS, EETMS and TEOS in various water:silane proportions and different solvents.
65
Table 3.2 - Analytical properties of sol-gel/ccNiR based biosensors prepared with various
precursors, in different water:silane proportions. ND – not determined. 68
Table 3.3 - Analytical properties of sol-gel/ccNiR based biosensors tested at different working potentials. Sol-gel/ccNiR formulation 74 pmol of enzyme and 225:1 H2O:EETMS
molar ratio.
80
Table 3.4 - Response of the sol-gel/ccNiR biosensor to potential interfering species: percentage of nitrite current response in the presence of an equal amount of interferent. Sol-gel/ccNiR formulation: 74 pmol of enzyme and 225:1 H2O:EETMS molar ratio.
83
Table 3.5 - Analytical results of the sol-gel/ccNiR biosensor for two real water samples from Portuguese rivers. Sol-gel/ccNiR formulation: 74 pmol of enzyme and 225:1 H2O:EETMS molar ratio. Catalytic currents were measured at -0.9V vs Ag/AgCl.
85
Table 4.1 - Textural and chemical characterization of the MWCNT samples [187] and respective dispersion stability. SBET – Brunauer-Emmet-Teller surface area, %mO – mass
percentage of oxygen on the surface, pHPZC – point of zero charge.
96
Table 4.2 - Percentage variation of the bioelectrode response to 50 µM nitrite in the presence of the same concentration of a potential interfering species.
105
Table 4.3 - Textural and chemical characterization of the MWCNT samples [187]. SBET –
Brunauer-Emmet-Teller surface area, %mO – mass percentage of oxygen on the surface,
pHPZC – point of zero charge.
107
Table 4.4 - Effect of the type of modified MWCNT on the bioelectrode response to nitrite in tris-HCl buffer 50 mM pH7.6. All electrodes were prepared with five layers of nanotubes on PG surfaces.
110
Table 5.1 - Surfactant critical micellar concentrations. 129
Table 5.2 - Analytical characterization of PG/ccNiR-surfactant bioelectrodes. 140
Table 6.1 - Medium composition. The pH was adjusted to 7.45 - 7.55 with KOH. The solution was degassed by argon bubbling and sterilized by autoclaving (20 minutes at 120°C).
Table 6.2 - Composition of vitamin solution. The pH was adjusted to 7.4 with tris-HCl buffer 50 mM after dissolution of riboflavine with NaOH 1 M. The solution was sterilized with 0.2 µm filters.
153
Table 6.3 - Composition of Wolfes elixir. The pH was adjusted to 6.5 – 7.0 with KOH. 153
Table 6.4 - SDS-PAGE gel preparation. 156
Table 6.5 - Specific growth rate (µ) and doubling time (Td) of D. desulfuricans cells grown
in nitrate or sulfate media.
158
Table 6.6 - Statistical analysis of the soluble fraction of D. desulfuricans proteome performed with DeCyder sotware. The up and down regulated spots represent two-fold variations in relative spot volume.
162
Table 6.7 - Proteins from the nitrate and sulfate soluble fractions of D. desulfuricans cells identified by MS-TOF-TOF analysis of protein spots from 2D gels. Mascot protein score thresholds were 54 and 78 for protein identifications indicated with * and +, respectively.
Biological processes, cellular locations, MW, pI, are theoretical values predicted from sequence analysis according to databases and tools from the DOE Joint Genome Institute and ExPAsy Proteomics Server. Differential expression analysis was performed with ImageMaster 7.0 from GE Healthcare.
164
Table 6.8 - Proteins from the nitrate and sulfate membrane fractions of D. desulfuricans
cells identified by MS-TOF-TOF analysis of protein spots from 2D gels. Mascot protein score threshold was 54 for all identifications. Biological processes, cellular locations, MW, pI, are theoretical values predicted from sequence analysis according to databases and tools from the DOE Joint Genome Institute and ExPAsy Proteomics Server. Differential expression analysis was performed with ImageMaster 7.0 from GE Healthcare.
169
Table 7.1 - Analytic and kinetic parameters of ccNiR biosensors. All configurations were based on pyrolytic graphite electrodes. Analysis was performed by cyclic voltammetry except for the sol-gel configuration in which amperometry was also used. The stability was determined as the electrode being able to maintain at least 90% of its initial response to nitrite and up to no more catalytic current being observed (values in parenthesis). ND – not determined. *– Value determined with rotating disk electrode.
- xxv -
List of abbreviations and symbols
2DE two-dimensional gel electrophoresis
%mO mass percentage of oxygen on surface
3-APTMS 3-(aminopropyl)trimethoxy-silane
A electrode area
Abs absorbance
AFM atomic force microscopy
AQS anthraquinone-2-sulphonate
ASB-14 amidosulfobetaine-14
ATCC American Type Cell Culture
ATP adenosine triphosphate
BET Brunauer-Emmet-Teller
BSA bovine serum albumin
BV benzyl viologen
CAPS 3-(cyclohexylamino)-1-propanesulfonic acid
ccNiR cytochrome c nitrite reductase
cd1NiRs cytochrome cd1 nitrite reductases
CHAPS 3-[(3-cholamidopropyl)dimethylammonio]-1-propanesulfonate
CMC critical micellar concentration
CNT carbon nanotubes
CPG controlled pore glass
CTAB cetyltrimethylammonium bromide
CuNiRs copper-containing nitrite reductases
CV cyclic voltammogram
cyt cytochrome
DDAB didodecyldimethyl ammonium bromide
DDM n-dodecyl-β-D-maltoside
∆Ep peak potential separation
DET direct electron transfer
DHP dihexadecyl-phosphate
∆Icat catalytic current after baseline subtraction
DIGE differential in gel electrophoresis
DMF dimethylformamide
DMPC dimyristoylphosphatidyl-choline
DNase desoxiribonuclease
DQ diquat
DTT dithiotreitol
E potential
ε molar extinction coefficient
E0’ formal reduction potential
E1/2 half-wave potential
EC mechanism of electrochemical reaction followed by chemical reaction
EDS energy dispersive X-ray spectrometer
EDTA ethylenediamine-tetra-acetic acid
EETMS 2-(3,4-epoxycyclohexyl)-ethyltrime-thoxysilane
Ep peak potential
Epa anodic peak potential
Epc cathodic peak potential
ET electron transfer
EU European Union
F Faraday constant
FEG field emission guns
FIB focused ion beam
Γ surface coverage
GC glassy carbon
HEPES 4-(2-hydroxyethyl)piperazine-1-ethanesulfonic acid sodium salt
HPU hydrophilic polyurethane
HS high spin
Hsp heat shock protein
I current
I0 or Ic current in the absence of nitrite
IC indigo carmine
Icat catalytic current
IEF isoelectric focusing
Imax maximum current
Ip peak current
Ipa anodic peak current
Ipc cathodic peak current
IPG immobiline dry strip
- xxvii -
Jmax maximum current density
kcat turnover number
kcatapp apparent turnover number
KM Michaelis-Menten constant
KMapp apparent Michaelis-Menten constant
LDH layered double hydroxide
LOD lower limit of detection
LS low spin
µ specific growth rate
MALDI matrix-assisted laser desorption ionization
MES 2-(N-morpholino)ethanesulfonic acid hemisodium salt
MET mediated electron transfer
MS mass spectrometry
MV methyl viologen
MW relative molecular weight
MWCNT multi-walled carbon nanotubes
ν scan rate
n number of electrons transferred
NA not applicable
NADH nicotinamide adenine dinucleotide
ND not determined
NEDA n-(1-naphtil)ethylenediamine
NHE normal hydrogen electrode
NiR nitrite reductase
NL non-linear pH gradient
NOCs carcinogenic N-nitroso compounds
NOx nitric oxides
Nr number
nrf nitrate reduction by formate
Ø diameter
OD optical density
ox oxidized
PAGE polyacrylamide gel electrophoresis
PAH poly(allylamine hydrochloride)
PAPS-SO3H-V viologen-modified sulfonated polyaminopropylsiloxane
PBV poly(benzyl viologen)
PEG poly(ethylene glycol)
PFV protein film voltammetry
PG pyrolytic graphite
PGE pyrolytic graphite electrode
pHPZC point of zero charge
pI isoelectric point
pmf peptide mass fingerprinting
PPB N-(3-pyrrol-1-yl-propyl)-4,4´-bipyridinium
PPV poly(pyrrole-viologen)
PS phenosafranine
PSA ammonium persulfate
Q charge
red reduced
Ref reference
RNA ribonucleic acid
RNase ribonuclease
rpm rotations per minute
RR resonance Raman
SAM self-assembled monolayer
SBET Brunauer-Emmet-Teller surface area
SCE saturated calomel electrode
SDS sodium dodecyl sulfate
SE secondary electrons detector
SEM scanning electron microscopy
Sens sensitivity
SRB sulfate reducing bacteria
STM scanning tunneling microscopy
SWCNT single-walled carbon nanotubes
Td doubling time
TEMED tetramethylethylenediamine
TEOS tetraethoxysilane
TES N-[tris(hydroxymethyl)methyl]-3-aminopropanesulfonic acid
THF tetrahydrofurane
TMOS tetramethylsilane
- xxix -
Tris tris(hydroxymethyl)aminomethane
U unit of enzyme activity
Usp universal stress protein
UV-vis ultra violet – visible
v0 initial rate reaction
Vmax maximum rate of reaction
Zwitt Zwittergent 3-10
Microorganisms
A. faecalis Alcaligenes faecalis S-6
A. radiobacter Agrobacterium radiobacter
D. desulfuricans Desulfovibrio desulfuricans ATCC 27774
D. vulgaris Desulfovibrio vulgaris Hildenborough
E. coli Escherichia coli
M. hydrocarbonoclasticus Marinobacter hydrocarbonoclasticus
N. vulgaris Nitrobacter vulgaris
P. denitrificans Parococcus denitrificans
P. pantotrophus Paracoccus pantotrophus
R. sphaeroides Rhodopseudomonas sphaeroides
S. deleyianum Sulfospirillum deleyianum
Chapter 1
- 3 -
Chapter 1 - General Introduction
Biosensing has captured attention from the scientific community for a long time. Even
though the number of products introduced in the market is far behind the growth in
publications, the potentialities of this technology are well acknowledged and keep driving
the research forward. Nitrite has been indicated as an interesting analyte for biosensing, as
clear markets exist in food industry, pollution control and clinical diagnostics.
In this chapter a brief introduction to biosensors is first presented, highlighting interest,
applications and some of the advantages over other analytical methodologies. This topic is
followed by the issue of nitrite determination: reasons, risks to human health and
environmental and physiological occurrence. A description of nitrite determination methods
is then presented with the main focus on enzyme based biosensors, to which this thesis is
dedicated. Finally, the biological component of the biosensor studies here presented -
cytochrome c nitrite reductase from Desulfovibrio desulfuricans ATCC 27774 - is described
and characterized.
1.1) Biosensors
Research in biosensors was first introduced by Clark and Lyons in 1962 with the
development of an enzyme biosensor for glucose [1]. Since then, the interest in biosensor
technology has grown as a multidisciplinary research and development area involving the
fields of physics, chemistry, biochemistry, molecular biology, material science and
electronics, among others.
A biosensor is a self-contained integrated device composed of a biological recognition
system (bioreceptor) in direct contact with a physicochemical transducer. It converts the
bioreceptor’s response to a specific analyte into an analytically useful signal (Figure 1.1). This
signal can be proportional to the concentration of the analyte or simply an indication of its
existence in the sample [2].
A wide variety of biological elements can be exploited in biosensors including enzymes,
ever growing developments in molecular biology and engineering expand the list of possible
biological and biological mimicking biorecognition elements.
The transducers may be electrochemical (the most common and widespread), optical,
piezoelectric, magnetic, thermal, etc. [2-4,6]. Advances in transduction methodologies are
supported by the constant evolution in electronics, informatics, data mining and computer
technologies.
Figure 1.1 - Schematic representation of the working principle of biosensors.
The coupling between the bioreceptor and the transducer is a critical step in biosensor
development. It is important to preserve the biorecognition activity and guarantee
robustness and reproducibility to the sensor. The most commonly used methods for
immobilization are membrane and matrix entrapment, physical adsorption and covalent
binding [2-3]. The materials to be used should maximize the capabilities of the biological
component of the biosensors and at the same time provide a stable and protective
environment.
Biosensing strategies benefit from the high specificity of the biological element and the
sensitivity of the transducer mechanisms, making it possible to recognize and quantify
specific molecules in complex samples. The use of biosensor technology for analysis has thus
been considered advantageous in comparison to other analytical techniques [4]. In addition,
biosensors are simple to use, they can provide short response times and therefore allow
real-time measurements. They should also be easy and cheap to fabricate in miniature
dimensions, turning a long and elaborated laboratory protocol into a simple task, quickly
executed on-site [5]. As reagentless devices, biosensors may be viewed as environmentally
friendly analytical tools.
Protein Antibody DNA Cells etc… P h y si co ch e m ic a l si g n a l E le ct ri ca l si g n a l E le ct ri ca l si g n a l
Bioreceptor Transducer Output
Electrochemical Piezoelectric Thermometric Optical etc… Sample S p e ci fi c ta rg e t re co g n it io n Analyte Protein Antibody DNA Cells etc… P h y si co ch e m ic a l si g n a l E le ct ri ca l si g n a l E le ct ri ca l si g n a l
Bioreceptor Transducer Output
- 5 -
Biosensors have been designed for applications in a wide range of areas such as
medical/clinical analysis, agriculture, food quality, environmental analysis and defense/
bioterrorism prevention [7-8]. The most successful one is undoubtedly the glucose
biosensor. It is used worldwide by millions of diabetics to monitor glucose levels in blood;
hence, there is a huge demand in the clinical market, pushing forward the investment and
research in this particular area. This biosensor typically uses an electrochemical detection
method for monitoring the electron transfer associated to glucose degradation, catalysed by
glucose oxidase. Very recently, implantable glucose sensors, that allow continuous
monitoring, were launched in the market.
Stricter legislation within the United States of America and the European Union demands
improved and fast analysis of a growing number of analytes, especially in the environmental
sector. Accordingly, biosensing is surely able to grow in importance within the analytical
methodologies [5,7]. Nonetheless, a more widespread implementation of biosensor
technology for analysis still faces some challenges. These lie not only on market sizes for the
analytes or even in the competition with other analytical methods such as chromatography,
immunoassays and mass spectrometry, that are also being fast developed and offer high
precision results and low detection limits; the challenges are yet related with the conception
of biosensors, for example with the stability of the biocomponents, sensitivity, selectivity
and lifetime of the devices, either in use or in storage [6].
1.2) Nitrite assessment
Nitrite (NO2-) and nitrate (NO3-) salts are naturally present in environmental and
physio-logical systems. On top of their natural occurrence, anthropogenic inputs derive from their
use as fertilizers and food preservatives, for example. Nitrite and nitrate chemistries are
practically indissociable and they are generally coexistent in all types of sources. If in
excessive levels, these ions can have an adverse impact on public health and on ecological
systems. Nitrite is the foremost toxic agent, but the fairly inert nitrate is easily reduced to
nitrite by bacterial action in the soil, in food products or within the digestive system [9-10].
Not surprisingly, the concerns of potential toxicity have generated an increasing interest on
In order to manage environmental and health risks, deriving from exposure to these ions,
governmental agencies have implemented rules and directives to restrict the levels of NO3-
and NO2- in drinking waters and food products. European directive 98/83/EC has established
the maximum admissible levels of nitrate and nitrite in drinking water at 50 and 0.1 ppm,
respectively. Likewise, the World Health Organization has set these limits at 50 ppm (NO3-)
and 3 ppm (NO2-) (WHO/SDE/WSH/07.01/16). More recently, following the European Food
Safety Authority recommendations, 2006/52/EC directive has reduced the authorized levels
for these ions in meat and other food products, which should be controlled on the basis of
added rather than residual amounts (e.g. 150 mg/kg of nitrites in meat products).
Furthermore, the determination of nitrite in human physiological fluids is also commonly
used for clinical diagnosis [11].
1.2.1) Human health risks
Human exposure to nitrate and nitrite ions results largely from dietary ingestion of food
products. Only a minor percentage comes from drinking water, where the levels of these
compounds usually comply with regulation [9,12]. Nitrate occurs naturally in plants, which
are the main source of intake; lettuce, spinach, beetroot, radishes and celery, for example,
are nitrate-rich vegetables. Yet, large accumulation of NO3- is typically observed if vegetables
are grown in soils overloaded with nitrogen fertilizers [12-13]. Nitrite ions are essentially
supplied by processed foods; along with nitrate (E251, E252), nitrite salts (E249, E250) have
been largely used in the manufacturing of processed and cured meats, fishes and some
cheeses as anti-microbial and conserving agents and as enhancers of organoleptic properties
like color and flavor [14-15].
Methemoglobinemia is the principal adverse health effect caused by over-exposition to
NO3-/NO2-. Nitrite can irreversibly oxidize hemoglobin to methemoglobin, which is unable to
bind oxygen, endangering its transport through the body. This can cause clinical cyanosis
among other symptoms. Infants are particularly susceptible to nitrite induced
methemoglo-binemia, often referred to as the blue-baby syndrome; a small number of fatal cases has
been reported, generally associated to the consumption of water resources that failed
- 7 -
A second concern with nitrite effects on human health is the potential role of nitrite in
for-ming carcinogenic N-nitroso compounds (NOCs) via reaction with secondary amines [16-17].
Although many NOCs have been shown to be genotoxic in animal models, the relationship
between NO3-/NO2- intake and the risk of cancer in humans has not been unequivocally
proved so far [12]. No matter the controversy, the information generated from the analytical
surveillance of nitrite in food products is fundamental for the management of health risks.
1.2.2) Environmental issues
Accumulation of nitrate in the environment derives mainly from the use of nitrogen
fertilizers in agriculture; its conversion to nitrite is favored by anaerobic conditions [9].
Nitrite, on the other hand, is extensively used in textile, metal, petroleum and
pharmaceutical industries [18-19]. The anthropogenic input of NO3- and NO2- to the
environment can also occur through the photochemical conversion of atmospheric nitrogen
oxides (NOx) generated by all sorts of combustion processes (industrial, domestic and
automobile) [10,20-21].
An excessive input of nitrite and nitrate into the environment disturbs the biogeochemical
nitrogen cycle by interfering with the denitrification/nitrification processes [20,22]. These
highly soluble ions have high mobility through the soil which can lead to the contamination
of ground-waters supplies. Another concern regarding the accumulation of NO3- and NO2- in
the environment is the eutrophication of aquatic ecosystems, whose normal balance is
disrupted by enrichment with nitrogen nutrients that stimulate the overgrowth of some
algae species. The buildup of nitrite levels in intensive fish culture is another issue. The
inefficient dispersion of wastes and the lack of local replenishment with oxygenated waters
create the ideal conditions for microbial activity, resulting in an increase in ammonia and
nitrite concentrations. If left unattended this can affect the fish stock [9,22-23].
1.2.3) Physiological significance/Biological activity
Besides the input from dietary sources, NO3- and NO2- are also produced endogenously in
related to the nitric oxide (NO) metabolism. Nitric oxide is an important mediator in cell
signal transduction. It has a major role in regulating cardiovascular functions and in
modulating inflammatory, infectious and degenerative disorders [12,24]. As a consequence,
abnormal production of NO has been implicated in a number of pathological conditions such
as acute lung disease, atherosclerosis and septic shock [25-26]. Nitric oxide is an unstable
species with a very short lifetime; it is metabolized to nitrite and nitrate by reaction with
oxygen. NO formation can, thus, be indirectly determined through NO3- and NO2- ions
[25,27].
Recent studies have brought attention to nitrite itself as an important molecule in
physiology, associating it with intracellular signaling functions [26,28]. The concept of a
potential therapeutic use of nitrate and nitrite in human health has emerged afterwards
[12,24]. These current trends contribute for the enduring scientific and public interest on the
quantification of nitrite [25,28].
1.2.4) Detection methods
Given that nitrite and nitrate are simultaneously present in various types of samples, their
detection is intimately associated and some methodologies can, in fact, be used for both
ions. This implies the reduction of nitrate to nitrite, using copper or cadmium columns or
nitrate reductases [10].
Probably due to the diversity and complexity of the target samples, whether they are
physiological, from the environment, food or industry, a consensus on how to measure these
ions is far from being reached. There are numerous analytical methods available for the
determination of nitrite and nitrate ions: UV-Vis spectrophotometry (Griess reaction),
fluorescence spectrophotometry, capillary electrophoresis, ionic and gas chromatography
(associated with various detection systems, such as UV-vis, fluorimetry, electrochemistry
and mass spectrometry), electrochemistry, among others [9-11,29-32]. However, most of
these methods have shown important limitations such as sample pre-treatment stages,
susceptibility to matrix interferences, insufficient detection limits, low selectivity, long
analysis time and lack of portability. As a result, the analytical field is searching for
- 9 -
As mentioned in section 1.1 biosensors can offer a series of advantages over other
analytical methods, namely the inherent specificity and selectivity of the biorecognition
reactions. At this stage the discussion will be set on nitrite detection only. Nitrite reductase
enzymes are the sensing elements most commonly used in nitrite biosensors. Additionally,
heme proteins, like myoglobin and hemoglobin [33-34], and microbial based biosensors
[35-36] have been employed in the quantitative determination of nitrite.
Nitrite biosensors will be described in more detail in the following sections. These devices
are generally characterized by high sensitivity and low limits of quantification, thereby
indicating biosensors as reliable options for nitrite detection. The main issues in nitrite
biosensing are the availability and cost of the proteins and the low stability of the devices, a
consequence of the fragile and complex nature of both the immobilizing layers and of the
proteins themselves [9-10].
1.3) Nitrite biosensors
Over the last fifteen years, biosensor technology has been exploited as a route to provide
reliable nitrite quantification in complex samples. Accordingly, diverse protein electrodes
and optical devices were presented in the literature. The strategies proposed for protein
immobilization have relied on a variety of materials, ranging from non-conducting polymers,
electropolymerized films, redox active clays, sol-gel silica glasses, carbon nanotubes and
DNA tethers, either alone or in composite formulations.
The main obstacles of electrochemical biosensors are the firm immobilization of the
protein without denaturation or leakage and the achievement of an efficient electronic
communication between proteins and electrodes. In the context of nitrite biosensors, the
majority of proposals have employed redox mediators (e.g. viologen derivatives) that display
a fast and reversible electrochemical response and are able to shuttle electrons rapidly to
the protein redox centers, following the transducing scheme depicted in Figure 1.2A. In
accordance to an EC’ mechanism (electrochemical reaction followed by a chemical one), the
increase in cathodic peak current resulting from the regeneration of the oxidized mediator
by the catalytic reaction step is directly related to the amount of substrate being processed.
active enzyme and the electrode material were also reported (Figure 1.2B); in this situation,
the increase in catalytic currents results from the direct regeneration of enzyme cofactors.
This type of communication with the electrode is typically harder to achieve due to the
insulating nature of protein polypeptide chains and the location of redox centers which are
commonly deeply buried within the protein structure. In addition, the protein molecules can
have an unfavorable orientation on the transducer surface, thus hindering the electron
exchange and sometimes contributing to an increased distance between the electroactive
centers and the electron transfer partner (the electrode).
Figure 1.2 - Schematic representations of the working principles of enzymatic nitrite biosensors: A) Mediated transduction, B) Direct transduction. (medox – mediator in the oxidized form; medred –
mediator in the reduced form; NiRox – NiR oxidized state; NiRred – NiR reduced state).
Besides dictating the efficiency of electrochemical transduction, the biosensor design also
plays a fundamental role in defining the response features. For example, sensitivity and
response time, which strongly depend on mass transfer limitations, are particularly
influenced by the characteristics of the immobilization matrix.
In the next section the nitrite biosensors reported in the literature will be described. These
devices were categorized into two main groups: microbial based biosensors and nitrite
reductase biosensors. Furthermore, the latter section was grouped according to the type of
E LE C T R O D E medox medred NiRred NiRox
NO2
-NH4+ or NO e -E LE C T R O D E medox medred NiRred NiRox
NO2
-NH4+ or NO e -e -NiRred NiRox
NO2
-NH4+ e -E LE C T R O D E NiRred NiRox
NO2