Anthropometric Thermal Evaluation
and Recommendation Method of
Physiotherapy for Athletes
Ana Sofia Roque Domingues
M
ASTER
D
ISSERTATION
Mestrado Integrado em Bioengenharia
Supervisor: Ricardo Vardasca, Ph.D., AMBCS
Co-Supervisor: Eduardo Marques, MSc.
Nowadays, injuries are identified as persistent and serious problems in the sports activity. Ankle sprains compose a significant part of these injuries and present high frequency and associated costs. Among other issues, this condition is related to the common persistence of sequel and re-occurrences. The disregard for its severity and a reduced follow-up of the treatment may be pointed as associated causes.
The aim of this dissertation consisted in the assessment and monitoring of physiotherapy procedures for cases of ankle sprain. Infrared thermography, a non-contact, non-invasive, non-ionizing, precise and safe medical imaging modality, has been used for analyzing the temperature distribution of the affected area since this type of pathology has a marked effect on it. In order to establish an association between the collected data and the respective subject, the development of a methodology for extracting anthropometric measures with the Microsoft Kinect was also an objective of this work .
Although not being a primary goal, it was also intended to use these two techniques for establishing a set of anatomical control points in whole body thermograms. This contribution was seen has a pilot study for the automation of the thermal images analysis that is still manually performed.
The thermal evaluation was conducted on rugby players from CDUP (Centro de Desporto da Univer-sidade do Porto) team, who were followed for a 30 days period. This monitoring process was focused on athletes that were recovering from ankle sprains and receiving physiotherapeutic treatment. A parallel col-lection was performed using the Microsoft Kinect sensor to capture RGB-D images from subjects external to the team. An algorithm was developed in order to extract the referred measures from these images, being created a complete methodology of image acquisition and processing.
The descriptive evaluation of the collected thermograms and the statistical analysis of the absolute ther-mal symmetry values obtained has allowed to confirm the presence of a pathology in the injured subjects. It has been also possible to associate the recovery stage of each injury with the temperature distribution observed and, in every case, confirm a positive evolution of the ankle sprain.
Regarding the anthropometric evaluation, 12 measures have been automatically extracted from RGB-D images of each subject, whose values were compared with the obtained from the Qualisys system. The relative errors obtained allowed to identify the most critical steps of this estimation. Using these measures and others additionally determined, a gender discriminant algorithm was developed and tested, presenting a percentage of correct classifications of 83%.
The results obtained by applying the developed algorithm in whole body thermograms were very promising, having been marked relevant anatomical points. In the future, with the proper optimization, the integration of both techniques may answer the need of having a fully automated method for thermal images analysis.
The main goals of this work have been achieved, proving that the infrared thermography is a useful tool for assessing and monitoring ankle sprains and being possible to establish a suitable methodology for the acquisition and analysis of thermograms. The estimation of anthropometric landmarks and measures using a low-cost depth sensor confirmed to be an important auxiliary procedure both for subjects profiling and thermograms analysis.
This work would not have been possible without the contribution and support of several people. First and foremost I would like to thank my supervisors: Dr. Ricardo Vardasca for the motivation, continuous advis-ing and constructive discussion, and Eduardo Marques for the everyday guidance, helpful ideas, inspiradvis-ing advices and endless patience throughout the entire project. I also acknowledge the VCMI (Visual Comput-ing and Machine Intelligence) group and the INESC TEC for the great work environment provided and for all the support.
Moreover, I would like to acknowledge Márcio Borgonovo and Professor Joaquim Gabriel for all the advices and assistance, and Professor Luísa Estriga for the help in establishing contacts and for all the ideas and pertinent questions.
I would also like to thank everyone from CDUP for always being present to help, specially, Manuel Ruivo for the assistance and medical insights and Miguel Moreira for the availability and interest. I also take this opportunity to thank all those people who have never hesitated to help and take an active, and sometimes repetitive, role in this project, the participants: a great part of this thesis is literally you and I could not be more grateful.
During this path, I have always counted with the unconditional support of those who are closest to me and to whom I should thank every day. To my parents, who have given me the affection, help and trust that made me go throughout one more phase of my life and who are the greatest examples of persistence and good-willing. To my brother, my all-time role-model, and to my sister-in-law, my little nephew and my grandparents that are always encouraging me. A very special thanks to João Amaral for the everyday support, for all his patience, for giving me the right advices in the right time and for never stop believing in me. I could not pass the opportunity of thanking my “fellow travelers”: Filipa, Inês and Rita, for all the help they gave me and for making every day far better.
In a moment of closure, I would also like to thank all my friends that pass these unforgettable 5 years with me and to all those that, by one reason or another, I could not always be with: you are always showing me that friendship is what makes every experience matter.
Sofia Domingues
Nelson Mandela
1 Introduction 1
1.1 Motivation . . . 1
1.2 Objectives . . . 3
1.3 Contributions . . . 3
1.4 Structure of the Dissertation . . . 3
2 Literature Review 5 2.1 Ankle Joint . . . 5
2.1.1 Anatomy and Physiology . . . 5
2.1.2 Injuries . . . 9
2.1.3 Thermal Physiology . . . 10
2.2 Medical Thermal Imaging . . . 12
2.2.1 Historical Overview . . . 13
2.2.2 Principle of IRT . . . 13
2.2.3 Medical Thermography . . . 14
2.2.4 Thermography in Sports Medicine . . . 15
2.3 Anthropometry in Biometric Identification . . . 16
2.3.1 Biometrics . . . 17 2.3.2 Anthropometry . . . 18 2.4 Conclusions . . . 23 3 Methodology 25 3.1 Ethical Issues . . . 25 3.2 Thermography . . . 25 3.2.1 Sample Characterization . . . 25 3.2.2 Image Acquisition . . . 26 3.2.3 Image Analysis . . . 27 3.3 Anthropometry . . . 29 3.3.1 Data Collection . . . 29
3.3.2 Anthropometric Measures Estimation . . . 31
3.3.3 Gender Estimation . . . 38
3.3.4 Evaluation of the Anthropometric Assessment . . . 41
3.4 Identification of Anatomical Control Points in Thermograms . . . 41
3.4.1 Regions of Interest in Thermograms . . . 42
3.5 Conclusions . . . 43
4 Results 45 4.1 Thermographic Monitoring of Ankle Sprains . . . 45
4.1.1 Sample Characterization . . . 45
4.1.2 Statistical Analysis . . . 46
4.1.3 Follow-up . . . 47
4.2 Anthropometric Assessment with Microsoft Kinect . . . 53
4.2.1 Silhouette Extraction . . . 53
4.2.2 Anthropometric Landmarks: Descriptive Evaluation . . . 53
4.2.3 Anthropometric Measures: Quantitative Assessment . . . 54
4.3 Gender Estimation . . . 55
4.4 Identification of Anatomical Control Points in Thermograms . . . 56
5 Discussion 59 5.1 Thermographic Monitoring of Ankle Sprains . . . 59
5.2 Anthropometric Evaluation with Microsoft Kinect . . . 60
5.3 Identification of Anatomical Control Points in Thermograms . . . 62
6 Conclusion 63
References 65
1.1 Schematic representation of dissertation structure . . . 4
2.1 Movements of the foot ensured by the ankle joint: plantar flexion, dorsiflexion and limited eversion and inversion . . . 6
2.2 Bone structure of the ankle joint . . . 6
2.3 Medial ligament of the ankle joint . . . 7
2.4 Lateral ligament of the ankle joint . . . 7
2.5 Blood circulation of the foot . . . 8
2.6 Ankle sprain - Illustrative representation of the trauma and damaged ligaments: calcane-ofibular and anterior talcalcane-ofibular . . . 9
2.7 Heat transfer through and above the skin . . . 11
2.8 Schematic representation of the human body thermoregulation process . . . 12
2.9 Standardized position for anthropometric measurements . . . 19
2.10 Anatomical landmarks . . . 19
2.11 Measures considered for obtaining lengths . . . 20
2.12 Skeletal joints extracted from the Microsoft Kinect depth images . . . 21
3.1 Views and regions of interest considered in this study . . . 27
3.2 Schematic representation of the setup used for RGB-D images acquisition with Microsoft Kinect . . . 30
3.3 Representation of the selected anthropometric measures . . . 31
3.4 Schematic representation of the method outline . . . 32
3.5 Silhouette obtained from the Canny edge detector: open contour composed by objects with different segments . . . 33
3.6 Outputs from the different refinement processes . . . 34
3.7 Regions of the body defined in the silhouette by considering the skeletal joins obtained from Microsoft Kinect . . . 35
3.8 Visual identification of outliers - pixels considered background in the Kinect mask and as foreground in the improved silhouette . . . 36
3.9 Anthropometric landmarks used to extract the corresponding measures . . . 37
3.10 Identification of the wrist landmark . . . 37
3.11 Anthropometric measurements used in gender discrimination . . . 40
3.12 Thermogram segmentation . . . 42
4.1 Graphical representation of the mean values of thermal symmetry obtained in the front and lateral views for the different types of cases reported: controls, left ankle sprain and right ankle sprain . . . 46
4.2 Thermograms of Subject 3 in the different days of examination (1 and 25) . . . 48
4.3 Graphical representation of the Subject 3 evolution during the thermal examination period 49 4.4 Thermograms of Subject 5 in the different days of examination (1 and 29) . . . 49
4.5 Graphical representation of the Subject 5 evolution during the thermal examination period 50 4.6 Thermograms of Subject 9 in the different days of examination (1 and 29) . . . 51
4.7 Thermograms of Subject 12 in the different days of examination (1 and 19) . . . 52
4.8 Graphical representation of the Subject 12 evolution during the thermal examination period 52 4.9 2D and 3D representation of the anthropometric landmarks automatically determined with
the developed algorithm . . . 54 4.10 Critical aspects identified in the gender discrimination algorithm . . . 56 4.11 Anatomical control points estimated in whole body thermograms . . . 56
2.1 Soft biometric traits . . . 18
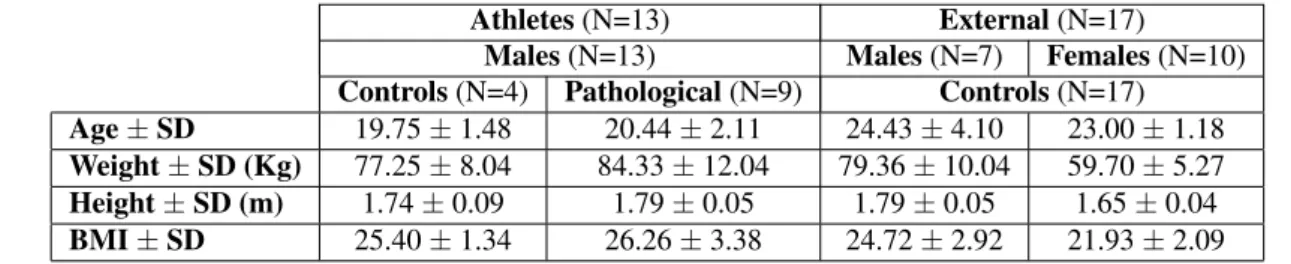
3.1 Characterization of the sample used in the thermographic evaluation in terms of number of subjects (N), age, weight, height and BMI, with the respective standard deviations (SD) . . 26
3.2 Mean values and respective standard deviations (SD) for relative humidity and temperature during thermal images collections . . . 26
3.3 Characterization of the sample used in the anthropometric evaluation in terms of number of subjects (N), age, weight, height and BMI, with the respective standard deviations (SD) . . 29
3.4 Weights assigned to each measure considered in the candidate selection . . . 35
4.1 Sample characterization in terms of mean temperatures(oC) observed in each ROI for con-trols and pathological cases . . . 45
4.2 Results from the Kolmogorov-Smirnov test) . . . 46
4.3 Results from the Student’s t-test) . . . 47
4.4 Results from the Mann-Whitney test) . . . 47
4.5 Thermal symmetry values for Subject 9 in Day 1 and Day 29 . . . 51
4.6 Results from the Mann-Whitney test conducted for the two cases followed during rehabili-tation . . . 53
4.7 Mean results obtained in the metrics used for silhouette evaluation and the respective ratio in number of pixels . . . 53
4.8 Results obtained from the quantitative assessment of the anthropometric measures estimation 54 4.9 Results from the gender estimation algorithm . . . 55
AIST National Institute of Advanced Industrial Science and Technology BMI Body Mass Index
CAESAR Civilian American and European Surface Anthropometry Resource CDUP Centro de Desporto da Universidade do Porto
IR Infrared
IRT Infrared Thermography
ISAK International Society for the Advancement of Kinanthropometry K-S Kolmogorov Smirnov
MRI Magnetic Resonance Imaging PBC Percentage of Bad Classifications RICE Rest Ice Compression Elevation ROI Region Of Interest
SD Standard Deviation SDK Software Development Kit
Introduction
The ankle is the most commonly injured joint in the human body [1], accounting for 25% of all the locomo-tor system trauma [2]. It is estimated that, on average, each person experiences 2 to 3 ankle injuries during a life time [3].
Ankle sprains represent 85% of all the injuries suffered in this region and present the higher frequency. They occur when a sudden twisting movement of the foot makes the supporting ligaments stretch or tear [3].
Studies [4, 5] have shown that this condition has an incidence of 1 per 10000 patients per day and an annual peak of 7.2 per 1000 patients. The most affected age group comprises ages ranging from 21 to 30 years old. As most common consequences of this injury, it is possible to identify: pain, loss of mobility and functional instability [6].
In sports, particularly in those involving sharp cutting movements, such as basketball, soccer, rugby and volleyball, ankle sprains are a persistent problem [3, 7]. For being a contact sport with hard collisions, rugby is associated with high injury risks, mostly musculoskeletal, concussions or related to joints [8]. The major part of the injuries correspond to ligaments tear and occur in the tackle phase, showing the effect of collision in causing these injuries. In professional sports teams, when a key player suffers a severe injury that forces him to leave competition, enormous financial losses are usually inevitable. For that reason considerable investments are being made in the prevention and efficient treatment, in order to avoid first and recurrent ankle sprains [6].
In this section, the presented problem will be addressed with more detail, giving relevance to the treat-ment and rehabilitation procedures. The financial impact associated, some issues related to the conducted treatment and a potential improvement of this process will also be approached. Finally, the objectives of this work will be established and the dissertation structure outlined.
1.1
Motivation
Nowadays, ankle sprains are considered an actual public health problem, mainly because of its high fre-quency and associated costs [2]. Although no estimation is found for several countries, considering the values known from Netherlands, an average ofe360 is spend in every sprained ankle case [9]. The finan-cial impact of this injury in sports is not only related to the treatment costs but also with the absence of
important athletes that have a key role in the success of the team and, therefore, in its economical revenue [10].
There is often a disregard for the importance of this injury, by patients and physicians. Since diagnosis tests are not always conclusive and the pain experienced by the patient is subjective, ankle sprains are sometimes seen as trivial injuries and their treatment is underrated. For this reason, there are sequels and reoccurrences cases both in athletes and in the general population. In fact, in a recent work it has been reported that, 3 years after the injury, only 36 to 85% of the patients achieve a full recovery [2].
Several studies [11, 12, 13] indicate that, in ankle sprain cases, conventional treatment is more appropri-ate and presents better results than surgery. It consists in the application of the RICE (Rest Ice Compression Elevation) protocol followed by early immobilization, using preferably a semi-rigid brace, and rehabilita-tion [2]. The monitoring of the rehabilitarehabilita-tion process is crucial for a consistent and effective treatment. Only with a careful supervision by the physiotherapist and with patient cooperation, a complete recovery is accomplished and the risk of re-sprain is minimized [2].The decision of returning to play is based on subjective information that sometimes leads the athletes to take serious risks. Since there is no efficient way to attest the fully recovery of an ankle sprains, physiotherapists and doctors rely on their experience and in the athletes feedback. However, different athletes have different healing capacities, response to medications and pain tolerance biasing this process. Therefore, a rehabilitation monitoring tool would help in these decisions, by giving quantitative information about the injury regression [14].
Infrared Thermography (IRT) may assume an important role in the monitoring of physiotherapeutical procedures. This technique has already a long history in medical applications. It was first used to eval-uate pain in 1964 [15] and since then it has proven to be a reliable and appropriate tool to address many conditions.
The human body emits an amount of infrared (IR) radiation that is detectable by thermal cameras and processed in order to produce corresponding images, thermograms, where each pixel corresponds to a tem-perature value [16, 17]. In cases of pathologies associated with infection or inflammation, some increases in skin temperature may be registered in the affected areas. Ankle sprains are typically hyperthermic and appear as non-homogeneous regions in the thermograms [18].
At the present, IRT already is used as an injury assessment tool for athletic animals and a lot of research is being conducted in order to apply this technique in humans [19]. IRT is a invasive, contact, non-ionizing, objective and, therefore, harmless and safe medical imaging method, which has a high potential to be used in the previously mentioned problem.
In order to perform a complete monitoring of this type of therapeutic process, it becomes relevant to maintain a complete profile of the subject. Soft biometrics are attributes that characterize people, however they lack in the robustness required to differentiate them. With a selection of soft biometrics, it is possible to create a patient’s profile, considering characteristics, such as: gender, ethnicity, height, weight, BMI (Body Mass Index) and measures of specific parts of the body, anthropometric measures [20].
The Microsoft Kinect is a sensor that combines a standard RGB camera with a depth camera and has been initially developed for game purposes [21]. However, an increasingly interest is being showed in order to use this equipment to perform biometric and anthropometric studies [22]. Therefore, the use of this technology appears has an interesting option to improve the purposed work.
Since the needed technologies for further investigate this proposed solution, as well as valuable human resources, are available in the University of Porto, exploring this field is a relevant and pertinent opportunity.
1.2
Objectives
The aim of this study is to evaluate the possibility of applying infrared thermography in the assessment and monitoring of physiotherapy procedures for cases of ankle sprain in rugby players. Since body conditions are different from subject to subject, it is also intended to establish a methodology for estimating biometric features that can be used to profile the patient, such as: gender, height and other anthropometric measures.
In order to accomplish the referred aim, the following objectives were established:
• Establish a standardized protocol of thermal imaging capture and analysis for the follow-up of ankle sprains;
• Perform a statistical analysis to evaluate the thermal patterns analyzed and characterize this injury;
• Define and implement a methodology for anthropometric measurement of a subject, by using RGB-D images from Microsoft Kinect;
• Evaluate the accuracy and robustness of Microsoft when used as a tool in the extraction of anthropo-metric measures by comparing the results with the obtained using a proper validation system;
• Complement the subject’s characterization with the gender, determining it automatically using the anthropometric data.
Some difficulties and disparities are still experienced in the analysis of thermograms for medical appli-cations since there is no automatic analysis method available. Therefore, it is also intended to work towards this goal and develop an algorithm to detect body contours and identify specific anatomical points.
1.3
Contributions
Three main contributions have result from the proposed work:
1. It has identified a new and suitable application of thermography in the monitoring of physiotherapy in sprained ankles which can be applied to other musculoskeletal disorders.
2. An algorithm for determining anthropometric measures and the gender of a subject by using RGB-D images obtained from the Microsoft Kinect was presented and its performance evaluated, consisting in a different methodology from those already existent in literature and having results comparable and similar to the state-of-art.
3. It has suggested the use of depth sensors, such as the Microsoft Kinect, to extract control points in thermograms, making a first contribution towards this goal.
1.4
Structure of the Dissertation
This dissertation is composed by 6 chapters (Figure 1.1). After this introductory section, Chapter 2 ad-dresses the anatomical and physiological characterization of the ankle joint and its most common injuries, namely ankle sprains. It also presents the IRT technique, with more focus in its application in the medicine. Anthropometry will also be object of detail in the second chapter, with respect to its application in biomet-rics. In Chapter 3, the experimental methodology applied for recording and analyzing thermal images will
be presented. The acquisition process for Microsoft Kinect will also be detailed, as well as the algorithm developed for the detection of anthropometric measures and its validation. Chapter 4 presents the main results obtained, which are discussed and related to the literature in Chapter 5. Finally, Chapter 6 gives a global perspective of the developed work, presenting relevant conclusions and final remarks. It also pro-vides guidelines and questions to be explored in future work.
Literature Review
In this chapter, the anatomical and physiological concepts related to this work will be presented, including: the injuries that most affect the ankle joint, the anatomy of this region and the physiological basis of thermal imaging. The following sections present the techniques in study and the state-of-art of the application of thermography in medicine and in sports injuries and also of the use of anthropometric measurements as biometric features.
2.1
Ankle Joint
The ankle joint forms the articulation between the leg and the foot. Due to its anatomical structure, it is more stable when the foot is dorsiflexed. When assuming other positions, the ankle becomes more fragile and vulnerable to different injuries [1].
In this section, the anatomy of the ankle will be addressed, as well as the injuries that may occur in this region, in particularly those affecting its ligaments – the sprains. The physiological phenomena in which thermography is based is also presented.
2.1.1
Anatomy and Physiology
The lower limb has several important functions, such as: support of the body weight, gravity control and locomotion [23]. It presents three segments: gluteal region, legs and feet. The joint between the last two is named ankle or talocrural joint and involves three bones: the talus of the foot, the tibia and fibula of the leg. The ankle joint is synovial and passes the body weight from the tibia to the talus, allowing foot move-ments of dorsiflexion, plantar flexion and limited inversion and eversion (Figure 2.1). The articular surfaces of this joint are covered in hyaline cartilage [1, 23].
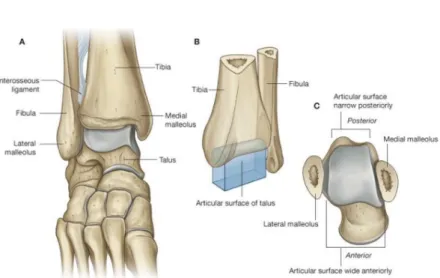
Since the anterior and posterior margins of the tibia and fibula are practically nonexistent and the medial and lateral margins are very extensive, together they create a “deep bracket-shaped socket” [23] for the talus (Figure 2.2.B).
The articular surface of talus has the shape of short half-cylinder (Figure 2.2.C) with one end turned to the lateral side and the other to the medial. Its upper side has two ends covered by hyaline cartilage and fits into the bracket-shaped socket structure. Two membranes enclose the articular cavity: a synovial and a fibrous. The synovial is attached to the articular surfaces margins and is covered by the fibrous one, which is also attached to the adjacent bones.
Figure 2.1: Movements of the foot ensured by the ankle joint: plantar flexion, dorsiflexion and limited eversion and inversion (From [1]).
.
Figure 2.2: Bone structure of the ankle joint: A. Foot in plantar flexion (anterior view). B. Schematic representation of the joint. C. Articular face of the talus (superior view) (From [23]).
The ankle joint is most stable when it is in dorsiflexion. In this position, the talus’ wider surface (anterior) moves into the joint and fits tighter into the “socket” formed by tibia and fibula. On the contrary, when plantar flexed, it is the narrower part (posterior) that fits the joint, resulting in a less stable position [23].
2.1.1.1 Ligaments
Medial and lateral ligaments stabilize the ankle joint. The medial ligament, also named deltoid, is large and triangular shaped. In the apex, it is attached to the medial malleolus and, in the base, to a line that connects the tuberosity of the navicular bone to the tubercle of the talus. Considering the points of attachment, four parts of the medial ligament can be identified (Figure 2.3):
• The tibionavicular: attached in front to the tuberosity of the navicular bone;
• The tibiocalcaneal: inserted in the sustentaculum tali of the calcaneus bone;
• The anterior tibiotalar: attached to the medial surface of the talus.
Figure 2.3: Medial ligament of the ankle joint (From [23]).
The lateral ligament is also composed by three different ligaments (Figure 2.4):
• The anterior talofibular: connects the anterior margin of the lateral malleolus to the adjacent region of the talus;
• The posterior talofibular ligament: passes from the malleolar fossa, through the medial side of the lateral malleolus, to the posterior process of the talus;
• The calcaneofibular ligament: attached to the malleolar fossa on the posteromedial side of the lateral malleolus and to a tubercle on the lateral surface of the calcaneus .
2.1.1.2 Arterial and Venous Circulation
The arterial blood supply of the foot (Figure 2.5.A) is ensured by branches of the posterior tibial and dorsalis pedis arteries. The posterior tibial artery passes through the medial side of the ankle and enters the foot through the tarsal tunnel. Between the medial malleolus and the heel, the posterior tibial artery originates a small medial plantar artery and a larger lateral plantar artery. The dorsalis pedis begins when the anterior tibial passes the ankle joint and ends up joining the deep plantar arch in the sole of the foot. Tarsal branches of the dorsalis pedis pass over the tarsal bones and supply adjacent structures, anastomosing with a network of vessels formed around the ankle [23].
Interconnected networks of superficial (Figure 2.5.B)and deep veins rise from the foot. The deep veins follow the same path as arteries and superficial veins originated from different sides of the dorsal venous arch pass onto the medial side or onto the back side of the leg (the great saphenous vein and the small saphenous vein, respectively) [23].
Figure 2.5: Blood circulation of the foot: A. Arterial circulation. B. Superficial veins. (From [23]).
2.1.1.3 Muscles
Leg muscles inserted in this joint and in foot bones ensure ankle movement. The tibialis anterior muscle has origin in the lateral surface of the tibia and is inserted into the medial cuneiform of the ankle and in the first metatarsal bones. It is responsible for the dorsiflexion and inversion movements of the foot. During locomotion, this muscle stabilizes the ankle, supporting the medial arch of the foot.
A superficial muscle attached to the head of the fibula, the fibularis longus, allows the eversion and plantar flexion of the foot. It passes through the lateral side of the leg, becomes a tendon posteriorly to the lateral malleolus of the ankle and finally attaches to the medial cuneiform and first metatarsal. The tibialis posterior also participates in support and plantar flexion and inversion movements and the fibularis tertius in dorsiflexion and eversion movements of the foot [23].
2.1.2
Injuries
In order to understand the wide variety of injuries that may occur in the ankle joint, it is very important to have a specific anatomical perspective of this region. Usually the ankle joint is observed as a fibro-osseous ring with a coronal orientation [23]:
• The distal ends of tibia and fibula form the upper part;
• The ligaments connecting the medial and lateral malleolus to the tarsal bones form the sides of the ring;
• The subtalar joint (not part of the ankle joint) delineates the bottom.
Considering this structure, it is easier for a physician to analyze the damage resulting from each type of injury. For example, a disruption of the ring may occur not only by a damage to the bones – fracture –, but also by a damage to the ligaments – sprain – that is likely to be missed by plain radiographs [23].
2.1.2.1 Ankle Sprains
When ligaments of the ankle are torn partially or completely, it is considered that a sprain has occurred (Figure 2.6). A strong and forced inversion of the foot appears as the most common cause of this injury, resulting in lateral ligaments damage. More remotely, medial ligaments may also be affected by an eversion of the foot, being frequently associated with a malleoli fracture [1].
A sprained ankle usually occurs when the foot is plantar flexed, since it is less stable in this position and, consequently, needing more ligament support. The most common sprain involves the anterior talofibular ligament that is also affected by inversion sprains. The calcaneofibular ligament is sometimes also involved in this type of injury (Figure 2.6) [24].
Figure 2.6: Ankle sprain - Illustrative representation of the trauma and damaged ligaments: calcaneofibular and anterior talofibular (From [1]).
Ankle sprains have been object of several studies [11, 13, 25, 26] concerning different perspectives: epidemiological impact, prevention possibilities, treatment options, etc. Acute ankle sprains may be more or less serious and are classified considering different parameters: anatomical damage, trauma mechanism, clinical presentation, severity or a combination of all. Regarding the severity, three grades are accepted to classify this injury: grade I (mild), grade II (moderate), grade III (severe) [10].
The most common consequences of a sprained ankle are pain and loss of mobility. However, in addition to these acute effects, chronic ankle instability may also occur. In this case, the patient has his physical capacity limited for a larger period of time. Hubbard et al. [25] reported that this condition may last for a year after the incident. More serious consequences can also arise, such as: articular degeneration of the ankle and osteoarthritis, as the risk of having this disease increases in these situations.
Usually an initial improvement is observed in the first two weeks that follow the incident. After this period, the progression becomes slower [13]. Once a patient has suffer from an acute ankle sprain, it becomes more likely that he has the same injury in the already affected ankle [10], which is called re-sprain. A review on the subject [13] showed that 3% to 34% of the patients suffer re-sprains, occurring from 2 weeks to 96 months after the first injury.
A wide variety of methods have been used in the past for ankle sprains treatment, such as: surgical repair, splint or plaster cast immobilization and functional treatment [10]. Currently, the functional treatment, also called conventional, is the accepted one among the physicians community, since it has proven to have the best results. In this method, the RICE protocol is immediately applied, being followed by an early immobilization, using preferably a semi-rigid brace. When this first response is completed, a rehabilitation process is conducted [2, 13].
The injured tissue passes through different phases during the healing process: the inflammatory, the proliferative and the maturation. In the first, it is recommended that the ankle is protected, avoiding stress to the newly formed tissue. During the following phases, it is crucial to help the correct alignment and strengthening of the collagen fibres. Considering these biological processes, physical therapists develop a rehabilitation plan. However, this method is not yet standardized nor its effectiveness was evaluated. Nevertheless, it is already known that a supervised rehabilitation is crucial for a better recovery [26] and that balance and coordination exercises have the ability to reduce the related symptoms and the risk of re-injury [27]. Even so, it is still estimated that only 36% to 85% of the patients achieve full recovery from ankle sprains at 2 weeks to 36.2 months. After 3 years, there are still patients who report residual symptoms, including pain and instability [13]. However, considering the actual magnitude of the investigation on this subject, it is possible that in the future, with a well-planned and supervised treatment, these numbers will improve.
2.1.3
Thermal Physiology
The human body is homoeothermic, it has the ability to regulate and maintain the core temperature level needed to survive. This is a vital characteristic, since body’s internal temperature must be kept within a limited range of values (36-37.5oC), in order to guarantee its normal functions. When superior to 7oC, temperature variations may even become fatal [28]. On the contrary, the body’s skin surface, due to the interaction with the external environment, experiences many temperature variations, taking a part in this regulatory process.
There are several aspects that affect this parameter: internal processes, disease states and external con-ditions. In a neutral environment, the thermoregulatory processes are not activated and the body balance
is maintained thanks to heat transfers [29]. The body’s heat loss occurs through four different physical mechanisms (Figure 2.7): conduction (3%), convection (15%), radiation (60%) and evaporation (22%), in unclothed and resting conditions [28, 30].
Figure 2.7: Heat transfer through and above the skin (From [29]).
Heat passes from internal organs through body structures to the skin, by conduction, while losses through body fluids are made by convection. Human body also transfers heat by evaporation processes, losing a considerable amount of water through skin, membranes and breath. However, since the rate of evaporation is directly related to the air humidity, in an environment with a high relative humidity, heat may be gained through condensation, instead of lost. Heat transfers also occur through radiation when the infrared waves dissipated from the body are more than the absorbed [28].
2.1.3.1 Thermoregulation
The thermoregulatory process has a major importance to the organism. It ensures that temperature is kept within the interval previously referred, a crucial factor to survival.
Thermoregulation is controlled by the autonomous nervous system that responds to cold and warm sensations perceived by nerve endings located in the skin. There are ten times more cold sensors then hot, being also closer to the surface. For this reason, the human body responds more rapidly to cold. When changes in temperature occur, the referred sensors send signals to the anterior hypothalamus, through the sympathetic nerve system. In response to low temperatures, the signal is then passed to the posterior hypothalamus. The human body’s responds to a decrease in external temperature by activating appropriate mechanisms in opposition to this stimulus, resulting in: vasoconstriction, shivering, muscle tensing and slow increase of the metabolism rate. In the opposite situation (temperature rise), a complementary process is triggered, inducing vasodilation and sweat glands activation [28, 29]. The signal and heat paths involved in thermoregulation are presented in Figure 2.8.
A local response may also occur. If a particular region of the body is cooled or warmed, sweating and vasoconstriction may be locally induced, even if the control of the whole body temperature is being differently carried [29]. Thermoregulation differs from individual to individual and depends on several parameters, such as: age, BMI and gender; that have also to be considered when studying the temperature processes of the human body [28].
Figure 2.8: Schematic representation of the human body thermoregulation process (From [31]).
2.1.3.2 Microcirculation
The part of the blood circulation that is held by the small blood vessels (< 100µm in diameter): arterioles, capillaries and venules, is called microcirculation.
Since these structures are characterized by having thin muscular walls, any differences in blood flow may influence the peripheral temperature, leading to a process of heat transfer to the environment by IR radiation. These differences are commonly a result of pathological conditions, such as: increase of total pe-ripheral resistance of arterioles (associated with hypertension), deregulation of the endothelium production of nitric oxide, etc. [28].Therefore, by analyzing the IR radiation emitted by the human body, it is possible to infer about some pathologies.
2.2
Medical Thermal Imaging
Nowadays, apart from patient symptoms and medical history, medical diagnoses are aided by complimen-tary methods, which can be classified as structural (X-Ray, ultrasound imaging, etc.) or functional (ECG, EEG, etc.). According to this classification, medical thermal imaging is considered a functional method [30].
Every condition associated with the presence of inflammation in superficial tissues or with an abnor-mal blood flow, is a potential object of study of this technique [16]. When compared to others methods, thermal imaging presents many characteristics that may be identified as differentiating factors. Since it is non-invasive and does not use harmful radiation, its application for human body assessment is, not only interesting and medically relevant, but also completely safe, allowing to monitor the peripheral vascular and the autonomous nervous systems.
Over the last 50 years, thermal imaging has been used in medicine [16] and it has already proven to be a valid and important contribution to the understanding of several conditions, such as: osteoarthritis, rheumatism and circulatory disturbances [28, 30].
In this section, the infrared thermography will be further analyzed with reference to its historical evo-lution and theoretical basis. The current application of this technique in medicine and in sports injuries, namely in ankle sprains, will also be addressed.
2.2.1
Historical Overview
Since the beginning of medicine, there is an association between body temperature and disease [16]. In fact, the human body’s temperature is closely related to its healthy balance and physiological functioning [28]. The first literature reference to this subject was made by Hippocrates, who analyzed a wet mud’s change in speed of drying when being put in contact with the skin of the abdomen, due to an increase in its temperature [32]. Actual attempts of measuring this propriety have just begun after 1612, when Santorio developed the first clinical thermometer [30].
The origin of thermal imaging dates back to 1800, when infrared radiation was discovered by Sir William Herschel. Several years later, in 1868, Wunderlich established the use of clinical thermometers into the clinical routine and characterized temperature conditions in several pathologies. His doctoral thesis (“On the Temperature in Diseases”) along with the discovery of the bolometer, an infrared measurement device (Samuel Langley, 1880) constituted two major contributions for the appearance of thermal imaging. In 1929, the first IR camera was invented by Tihanyi for Britain’s aircraft defense. However, it was only in 1956 that Ray Lawson used the Evapograph, the first conventional camera, for studying the temperature distribution of a breast cancer tumor tissue [28].
2.2.2
Principle of IRT
The human body emits an amount of IR energy whose intensity depends on the temperature of the skin, as well as, on its emissivity [17]. This parameter reflects the relative ability of a surface to emit energy by radiation, which is given for a specific temperature by the ratio between the radiant emittance of an object to the emittance of a blackbody [28, 17]. A blackbody is, therefore, an object able to completely absorb all incident radiation and emit the same amount, presenting an emissivity of 1 [28].
The total energy radiated by a blackbody per unit of area and per unit of time is proportional to the fourth power of its absolute temperature. This relation is stated by the Stefan-Boltzmann law [33]. In order to characterize the infrared radiation emitted by the object, the Planck’s law must be considered [34]. According to this equation, a blackbody radiates energy at all frequencies, tending to zero in low and high frequencies and short and long wavelengths. At room temperature, it does not emit visible light, being also important to consider the Wien’s displacement law that describes the relation between the spectrums of a blackbody at different temperatures [28].
Skin involves the major part of the body structures, isolating them from the environment. When dried, the human skin has an emissivity of 0.98, according to the Planck’s Law. This makes the human body a nearly ideal blackbody and a long wave IR radiator, with an maximum emission at 9.3µm [30].
In thermography, this energy radiated by the human body is detected by thermal cameras and used to produce images called thermograms. It is important to point that thermography is a low penetration technique, providing information until just 2.5 mm below the skin surface [28]. Thermal cameras may be grouped in two categories: cooled and uncooled. The cooled sensors operate at cryogenic temperatures and
require a previous cooling procedure that may be ensured by liquid nitrogen or argon gas (older devices) or by thermoelectric or stirling coolers (new devices). The uncooled sensors are smaller, less expensive, easier to use and have an unlimited time of utilization [28]. A thermal camera comprises five main components:
• Optics: lenses that may be made of Silicon (long-wavelength) or Germanium (short wave-length);
• Infrared detector array: converts the infrared radiation into the corresponding electrical signal;
• Shutter system: responsible for image correction, if the camera is in auto-adjust mode;
• Digital signal processing module: processes the electrical signal into a radiometric picture, perform-ing temperature calculations.
Other relevant aspects that differ between cameras are: thermal resolution and spacial resolution. The first is equivalent to the smallest difference in temperature that the camera can discriminate and is commonly referred by camera as Noise Equivalent Temperature Difference (NETD). The spacial resolution establishes the fineness of object detail reproducible in a thermal image and is usually given by the total number of pixels displayed [35].
2.2.3
Medical Thermography
Nowadays, IRT is applied in the most diverse fields, from mechanical and electrical industry to military and medical applications [17].With this technique, the different temperatures values of a scene are obtained and recorded in less than a second [16].
The use of thermography in medicine dates back to 1956 [17]. However until recently, its application raised a lot of reservations and doubts. The reduced quality presented by imaging systems in the past and the lack of methodological standards were the main causes of this reluctance [18]. In the last few years, a great development of the used equipment and analysis procedures has been observed. Along with this technological evolution, the price of the the thermal cameras has progressively decreased, becoming more accessible. IRT cameras are now powerful devices with high pixel resolution, a thermal sensitivity below 0.01 K and capable of ensuring a stable image, with a [18, 30]. This technique’s reliability was also improved by the establishment of overall practices promoted by thermographic organizations from all over the world [18].
Considering previous publications in the field, the European Thermographic Association, now called European Association of Thermology, published the first two official documents on standardization of ther-mal imaging in 1978 [36] and 1979 [37], regarding the thermographic terminology and the recommended procedure for locomotor diseases, respectively [38]. Ever since then, several works have been developed in order to achieve a complete standardization of thermography. In 2006, Plassmann et al. [39] proposed a group of tests that should be performed in order to assure the quality of the images collected. Two years later, Simpson et al. [40] suggested the use of external temperature references for calibration purposes. The Glamorgan Protocol was also a significant contribution with the definition of 24 body regions and 90 regions of interest (ROIs) that should be considered in these studies [38]. The use of ROIs was a great step in the improvement of accuracy and reproducibility of IRT in medicine, since these allow comparative analysis between studies [28].
During the last 20 years, some attention as also been employed in the establishment of guidelines to the collection and reporting procedures, including: patient’s preparation and assessment, equipment operation, required room conditions, thermal provocation and analysis methods [28, 38]. The medication, meals and
exercise that a subject had prior to the examination have to be controlled since they may affect the shell temperature, biasing the results. The environmental conditions, as temperature, humidity, air circulation and incident radiation, are also important factors that have to be considered [28].
IRT is now recognized as a valuable diagnostic tool in medicine, being used in a wide range of ar-eas, from dermatology to orthopedics and neurology, for evaluating pathologies that significantly affect the homeostasis of specific body regions [18]. Currently, the studied conditions are mainly circulatory or inflammatory and comprise: rheumatoid arthritis, Raynaud’s disease, osteoarthritis, fibromyalgia and complex regional pain syndrome [16, 30].
As any other medical technique, IRT also presents some limitations including: vulnerability to exterior disturbances that may intensify the noise detected, expensive and easily damaged equipment, low penetra-tion capability (2.5 mm) and technical experience required [28, 30]. It is also important to consider that due to is lack in specificity, IRT must be used as complementary medical tool, whose results must be com-bined with other human body imaging techniques (computed tomography, magnetic resonance imaging, ultrasound, etc.), which provide important structural information [18, 28].
Nevertheless, IRT is still a reliable, objective, non-ionizing and non-contact method that, unlike other commonly used techniques, does not use any harmful radiation, being completely safe [30].
2.2.4
Thermography in Sports Medicine
There are few studies regarding the use of IRT in sports and an even more reduced number is obtained when considering pathology diagnosis and monitoring [17]. However, some studies [18, 19, 41] have already explored sports pathologies, such as: traumatic lesions, fractures, pain in the lumbosacral region, spinal cord lesions, etc.
Competition and training exposes athletes to a great physical stress, pushing the locomotor system to its limits [18]. Less supervised athletes wait sometimes weeks, or even months before seeing a physician after suffering an injury. Moreover, even when an early detection is accomplished, athletes are not always capable of accurately pointing the injured regions, showing a natural tendency to identify only the area with higher pain intensity [41]. These two moments – early detection and localization – represent crucial steps in determining the most adequate treatment [18], therefore, an auxiliary technique could allow a better recovery.
With IRT, thermal changes (increase or decrease) can be verified in the body skin temperature. If an injury occurs in soft tissues, the vascular and metabolic systems induce physiological changes that will also affect the temperature distribution in the affected area [41]. When a sympathetic or unmyelinated nerve is involved in the injury, feedback mechanisms increase the level of catecholamines in the affected area and a microcirculatory vasospastic effect occurs locally – the local temperature decreases. The same temperature manifestation occurs, when there is a degeneration process, reduced muscular activity or poor perfusion [19, 41]. On the contrary, acute injuries lead to vasodilatation and increase of inflammatory mediators in the area, which result in an increase of the metabolism and blood flow in the region – the local shell temperature rises. Considering this, it is possible to assess these conditions recurring to thermography [41]. Hildebrandt et al. [18] presented conclusive results regarding the application of IRT to address overuse injuries in football (medial shin splint and pain in the Achilles region), running (pain in Achilles region), swimming (shoulder pain) and youth sports (enthesopathy of the ligamentum patellae). Several studies
[17, 18, 42] have been conducted in matter, covering knee pathologies: Arfaoui et al. [17], for exam-ple, concluded that IRT was a reliable tool to detect specific temperature patterns in athletes with knee osteoarthritis.
The studies already conducted sustain the possibility of using IRT for addressing other injury cases. Due to their high occurrence and epidemiology (see Chapter 1), ankle sprains are largely studied in different areas. However, there are not many works regarding the application of IRT to this injury. Nevertheless, some important observations have been made: Asagai et al. [43] reported some cases of high temperature around the trauma site and reduced temperature in the periphery, on the first day after the injury; this cold skin pattern was interpreted as indicative of poor prognosis and long recovery time [19]; Schmitt and Guillot [44], reported, several years ago, that the thermal distribution of temperature in ankle sprains was related to the recovery time recommended: a bilateral isothermia reflected a minor injury treated in 1-2 weeks; a thermal asymmetry between sprained and healthy ankle of 1.5oC to 2.0oC required usually a recovery of 4 weeks.
Healthy people present a symmetric thermal distribution. Thermal symmetry of the human body has been defined [45] as the ‘degree of similarity’ of two ROIs mirrored across the main longitudinal axis of the human body and which are identical in shape and size, being taken at the same angle. When an injury induces a localized increase in temperature, it will disturb this normal symmetric pattern [18]. In fact, it has been established that a different superior to 0.5±0.3oC is abnormal and may point to a pathological condition [46].
As any other physiological manifestation, a temperature change may be a result of different causes and cannot be assuredly related to a specific condition without further analysis. Therefore, observational data of the injury collected for a significant period of time and a deeper understanding of the biological phenomena have to be taken into account by the physicians and physical therapists. In order to use IRT to address sports injuries, it is crucial that a comparative analysis is performed, considering injured and correspondent non-injured areas. It is also ideal that a continuous follow-up is conducted, for a better understanding of the progression of these modifications. By considering all these factors, it would become possible to create a database of normal and pathological data. [18].
Thermography is now seen as a helpful technology that may help athletes, coaches, physicians and physical therapists in cases of injuries for prevention, early detection and therapy assessment. It is the least expensive non-invasive method that presents absolutely no harm to the patients. Among other issues and challenges that are currently presented to IRT, the construction of a biometric system applied in thermal images to complement this technique and the automatic discovery of anatomic control points to delineate the geometrical and standardized regions of interest that are currently used, are pointed as relevant break-throughs [28]. These two challenges will be subject of analysis in the present work.
2.3
Anthropometry in Biometric Identification
Face, voice and gait are parameters that have always been used to recognize people. Regardless the process, a person’s identification is performed by analyzing physiological and behavioral characteristics, from which some are classified as biometrics for being markedly distinguishing [47, 48]. Soft biometrics refers to the traits that also characterize people, although lacking in the robustness required to differentiate them. Some examples of these features are: eyes color, gait, stature and ethnicity [49].
Anthropometry is the part of anthropology that studies human body measurements. This field comprises the extraction and detailed analysis of different parameters, such as: weight, height, body lengths and
circumferences, skinfold thickness, etc. [50]. Since these dimensions describe the human body, they can serve as a reference to construct a subject’s profile and actually be used as biometric features.
In this section, the biometrics and anthropometry fields will be presented in more detail, with special reference to the use of anthropometric measures as soft biometrics. In order to develop an evaluation system with a biometric signature based on anthropometric measures, it is crucial to have a complete understanding of these subjects. The use of Microsoft Kinect for this purpose will also be analyzed, considering some studies developed in the area.
2.3.1
Biometrics
The biometrics field provides reliable methodologies for person’s recognition. Biometric identification has already many applications in a broad range of areas including, for example, surveillance and multi-user platforms [48, 51].
A system based in these features is basically a pattern recognition system capable of collecting data from an individual, extract relevant features from it and compare them to a specific dataset. This dataset is composed by the information of different attributes needed to match the individual to one of them [47, 51]. Biometric traits may be grouped on hard and soft biometrics. In order to be classified as hard biometrics, a human characteristic has to satisfy four basic requirements [47]:
• Universality: every person must present it;
• Collectability: it has to be possible to quantitatively measure it;
• Distinctiveness: it must be sufficiently different in any two subjects;
• Permanence: the characteristic has to be sufficiently invariant over a period of time.
Some examples of hard biometrics are: fingerprints, iris, retina, face appearance, etc., which had already been explored in several studies, proving to be useful in different applications. More recently, researchers have started to give an increasing relevance to soft biometrics [52].
2.3.1.1 Soft Biometrics
During the 19th century, Alphonse Bertillon was the first to present the concept of human identification systems based on morphological characteristics. This was the beginning of biometry as a field of study [20]. However, only several years later, soft biometrics were first introduced by Jain et al. [53], referring to them as traits that provide information about the subjects, without being capable of establishing an absolute identification. This is due to the fact that in soft biometrics some of the referred requirements, such as distinctiveness and permanence, may not be completely satisfied [20].
A selection of the characteristics already classified as soft biometrics is presented in Table 2.1. With the technological and scientific development occurring in this area, more are being identified.
These biometric features are qualified in terms of distinctiveness and permanence. In this group, dis-tinctiveness is equivalent to the strength with each trait allows subject identification and is, in most cases, reduced. Height, for example, presents medium distinctiveness since considering a random sample it may be a distinguishing factor, despite being the same for a large number of people. Likewise, soft biometrics may also not be invariant for a long period of time.
Table 2.1: Soft biometric traits (Adapted from [20]).
Trait Permanence Distinctiveness
Facial measurements High Medium
Ethnicity High Medium
Gender High Low
Height Medium/High Medium
Weight Low/Medium Medium
Gait Medium Medium
Body measurements Medium/High Medium/High
Clothes color Low Medium
Currently, these traits are being largely used in different applications: session-based systems, database search for preliminary exclusion and in systems based in hard biometrics in order to improve their reliabil-ity [20, 52]. When compared to the hard, soft biometric features may seem to present only disadvantages. However, several works in this area [53, 54] have shown the opposite. Some main advantages can be re-ferred: the increase in speed and accuracy of already existing systems, computational efficiency, deducibil-ity from classical traits and user-friendly behavior in data acquisition. As mentioned before, limitations in permanence and distinctiveness may be pointed. However, by considering a well-established group of soft biometric traits, this drawback may be overpassed [20], being possible to create a complete profile of a subject [49].
The different soft biometrics may be grouped in different categories: facial, body and accessory (eye glasses, for example). Body soft biometrics comprise traits as: gait, weight, height and body measurements; and will be the main focus of this work, namely, the two lastly referred.
The height estimation algorithms comprise some basic steps: they have to first recognize the foreground and the background, then, automatically extract real coordinates of the environment and finally, considering this information, they have to estimate the distance from the top of the head to the feet [20]. This topic is already vastly presented in the literature and studies are now more focused on optimizing these algorithms in order to improve their precision [20].
Work in body measurements extraction is developed regarding different purposes. A relevant example is the study conducted by BenAbdelkader et al. [55], which involved body height and shoulder breadth extraction in order to create a multimodal identification system.
2.3.2
Anthropometry
Anthropometry studies are applied in different areas, such as: in biomechanics for posture evaluation, in medicine for prevention of musculoskeletal lesions and in nutrition, addressing, for example, the relation between eating habits and changes in body dimensions [56, 57].
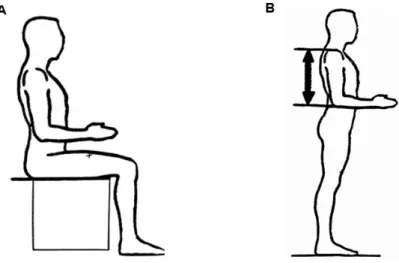
There are two types of anthropometric data: static and dynamic. The first refer to body dimensions and include: height, arms and legs length, waist and tight circumference, etc. These measures are usually collected considering fixed anatomical points or landmarks and with the subject assuming standardized postures (Figure 2.9). Dynamic measurements are those collected in order to evaluate the movement amplitude associated with the performance of defined tasks [56].
Over the years, an increasing need for the standardization of static measurement practices has arisen, resulting in the establishment of a set of practices that have to be applied in order to obtain a comprehensive
Figure 2.9: Standardized position for anthropometric measurements: A. Upper leg length measurement. B. Upper arm length measurement (From [58]).
anthropometric profile. Specific equipment is required in these studies, including: stadiometers (for stature and sitting height), weighting scales, anthropometric tape (for girths), anthropometers or segmometers (for heights and lengths), anthropometric boxes (for iliospinale height) and several types of calipers.
Before any measurement, specific anatomical landmarks need to be marked. They are identifiable body points that establish where the measurement sites are located. The landmarks usually considered, and which are referred in the International Society for the Advancement of Kinanthropometry (ISAK) standards document [57], are presented in Figure 2.10.
2.3.2.1 Measurement Items
Anthropometric measurements are classified in different categories: basic, skinfolds, lengths and breadths. The basic measurement items are: body mass, stature and sitting height. Skinfolds refer to the thickness of some body areas (triceps, biceps, subscapular, abdominal, etc.) where the skin is intentionally fold. Body circumferences, or girths, are also collected from different regions (head, neck, forearm, chest, waist, thigh, etc.) and are measured using a flexible tape. Lengths may be direct, if measured from landmark to landmark, or derived, if based in projected heights taken from the floor (Figure 2.11). Finally, breadths are horizontal lengths of specific regions that are measured with calipers. Even though an unequivocal identification may not be possible, using only these anthropometric features, a complete profile of the subjects is achieved [57].
Figure 2.11: Measures considered for obtaining lengths: A. Direct lengths. B. Projected heights (From [57]).
Over the years, anthropometric studies have been carried out using traditional methods, which had precision-related issues and were time-consuming practices. In fact, conducting a reliable and reproducible anthropometric study requires large samples, because of the high variability of human dimensions, and extensive work with each individual. Therefore, the development of digital devices for body scanning introduced the possibility of overcoming these aspects, by automatically acquiring anthropometric mea-surements [59].
2.3.2.2 Microsoft Kinect in Anthropometry
The detection of the human body in images using computer vision techniques is a wide studied subject comprising complex questions. The major difficulties are associated with the high variability of the scenario in terms of illumination conditions, background configuration and acquisition point of view. The use of range images in this area became a practical solution to these issues. However, the first data acquisition devices of this type of images were expensive and had considerable dimensions, limiting their use [22]. With the appearance of low cost depth cameras, this subject gained more relevance. In fact, these devices
have been successfully employed in different fields, including robotics, forensics, object recognition and scene segmentation [60].
Anthropometry has also been an explored field of application for low cost cameras. As already referred, anthropometric measurements were traditionally performed recurring to time-consuming manual methods with uncertain precision. The first automatic methods for body dimension extraction were based in 3D point clouds [59, 61]. Even though this methodology resulted in high-quality data, it was complex and required a 360 degrees collection, involving expensive equipment and strict environmental conditions [21]. Considering this, low cost range cameras are naturally a useful tool in this area [59].
Several studies [60, 62, 63] identified Microsoft Kinect has a reliable and accurate device for clinical purposes. This product is a low price multisensory device, capable of collecting both depth and RGB images [22] at a frame rate of 30 fps [60]. It was originally created in 2010, for game purposes, as an interface for the Microsoft Xbox 360 [21]. However, over the years its use has spread to technological and scientific applications.
The Microsoft Kinect uses near-IR light reflected from the scenario to measure the distance of any point to the sensor, modeling the surfaces curvature. With this information, a real-time depth map with the range values is created. When used to detect the human figures, the KinectSDK (Software Development Kit)1or OpenCV2modules must be used to process this information and manage to estimate 20 and 15 joints of the body, respectively (Figure 2.12) [21, 22, 64].
Figure 2.12: Skeletal joints extracted from the Microsoft Kinect depth images: A. Joints from KinectSDK (From [21]). B. Joints from OpenCV (From [64]).
Considering these joints, it is possible to describe the subject’s posture and extract anthropometric fea-tures. Since these measurements cannot be directly obtained from Kinect, there are some studies [21, 61] ex-ploring different methods to estimate them from the extracted information. Samejima et al. [21] developed a full body dimensions estimation method, considering some of the points extracted from Microsoft Kinect. In this study, using the National Institute of Advanced Industrial Science and Technology (AIST) anthro-pometric database, four body dimensions (height, iliocristal height, biacromial breadth and bitrochanteric breadth) were chosen by a linear multiple regression analysis in order to estimate other 52, with a regression formula based in a principal component analysis. Only height was directly obtained from the KinectSDK. The errors obtained in the measurements estimation were relatively low, all inferior to 16%, however, the sample used in this analysis was reduced (10 subjects). Therefore, this method would have to be further
1http://www.microsoft.com/en-us/kinectforwindows/ 2http://opencv.org/
tested to define its accuracy. Also in this context, Azouz et al. [61] presented an algorithm for automatic recognition of anthropometric landmarks on 3D human scans. This method presented a good accuracy for most of the landmarks, according to a validation process involving 30 human models with different shapes. The images were obtained from the CAESAR (Civilian American and European Surface Anthropometry Resource) database [65], which may also be used in future work for data training. Although requiring a larger dataset (200 images for training and 30 for validation) and not addressing anthropometric measure-ments estimation, when compared to the previously referred, this study was more representative and also presented low error rates: less than 2 cm for most of the landmarks.
Studies on biometric applications of Microsoft Kinect have also been conducted. Regarding body di-mensions, the study performed by Araujo et al. [51] may be used as reference. It has explored the viability of using Kinect as a tool to create a biometric profile, considering anthropometric measurements. These parameters were extracted from static images of different subjects, without requiring the subject to place himself in standard position in front of the sensor. The results showed the existence of a pose dependency on the information obtained from the Microsoft Kinect, reporting some inconsistency in the identification of skeleton points due to the different poses assumed. A standardized and cooperating position had to be required or different poses had to be considered in the training data.
When using soft biometrics, such as body measures, for subject’s characterization, it is important to consider that these traits are not individually distinctive or permanent. Therefore, the use of a specific set of anthropometric measures combined may minimize this weakness. Moreover, the fusion of different types of soft biometrics can be crucial to this end, being object of study in several recent works [66, 67, 20]. Comprising a set of distinct traits, such as gender, age, ethnicity, height and body sizes, more robustness and accuracy are achieved. In this work, gender will be considered to complement the information gathered from the anthropometric analysis, for being a discrete trait capable of providing more accuracy and minimize the complexity of the user’s profile process.
2.3.2.3 Gender Estimation
Although being less distinctive, soft biometric features such as gender and ethnicity, are also important descriptors of a person and may be automatically extracted from anthropometric traits. Some studies [68, 69, 67] have already reported methodologies for estimating a subject’s gender from recorded images, presenting promising results. However, facial features are commonly analyzed for this purpose, not being considered other traits that may assume a relevant and complementary role in this type of classification.
In several levels of the human body’s anatomy, it is possible to identify sexual dimorphic features [70]. Most anthropometric studies on this field are focused in only one feature [71, 72, 73] instead of in a more distinguishing combination of them. Fullenkamp et al. [70] have studied this matter, purposing three different optimized combinations of anhropometric measurements for gender discrimination, considering different populations. In that study, the required measurements were performed by non-automatized tradi-tional methods, having presented high accuracy values for the three discriminant functions: 99.5% for the North-America (2391 participants) and Italy (800 participants) functions and of 98.5% for the Netherlands’ (1265 participants).
2.4
Conclusions
Considering the presented studies, it is possible to verify that there is an absence of a methodology for assessing, with IRT, the evolution of a pathology recovery during physiotherapy treatments. It can also be concluded that there is the need for a new solution for automatically estimate anthropometric measures. In this context, the use of Microsoft Kinect for the determination of body dimensions may provide positive results and enable the use of these parameters and of other related biometric traits, in order to create a subject’s profile. Regarding thermograms analysis, there is also an absence of a method for conducting an automatic segmentation of these images into regions of interest, which would allow a more standardized thermographic evaluation.
![Figure 2.4: Lateral ligament of the ankle joint: A. Lateral View. B. Posterior View (From [23]).](https://thumb-eu.123doks.com/thumbv2/123dok_br/19204041.955096/23.892.158.780.832.1061/figure-lateral-ligament-ankle-joint-lateral-view-posterior.webp)

![Figure 2.6: Ankle sprain - Illustrative representation of the trauma and damaged ligaments: calcaneofibular and anterior talofibular (From [1]).](https://thumb-eu.123doks.com/thumbv2/123dok_br/19204041.955096/25.892.309.624.716.1062/figure-illustrative-representation-damaged-ligaments-calcaneofibular-anterior-talofibular.webp)
![Figure 2.8: Schematic representation of the human body thermoregulation process (From [31]).](https://thumb-eu.123doks.com/thumbv2/123dok_br/19204041.955096/28.892.191.666.156.486/figure-schematic-representation-human-body-thermoregulation-process.webp)
![Figure 2.11: Measures considered for obtaining lengths: A. Direct lengths. B. Projected heights (From [57]).](https://thumb-eu.123doks.com/thumbv2/123dok_br/19204041.955096/36.892.184.661.401.710/figure-measures-considered-obtaining-lengths-direct-lengths-projected.webp)
![Figure 2.12: Skeletal joints extracted from the Microsoft Kinect depth images: A. Joints from KinectSDK (From [21])](https://thumb-eu.123doks.com/thumbv2/123dok_br/19204041.955096/37.892.186.750.570.788/figure-skeletal-joints-extracted-microsoft-kinect-joints-kinectsdk.webp)