Effects of climate change in the biomass of the Montado
agro-sylvo-pastoral system
Sara Filipa Girante Mimo
Dissertação para a obtenção do Grau de Mestre em
Engenharia do Ambiente
Orientador(es): Professora Doutora Cláudia Cordovil
Professora Doutora Cristina Branquinho
Júri:
Presidente: Doutor António José Guerreiro de Brito, Professor Associado com Agregação do(a) Instituto Superior de Agronomia da Universidade de Lisboa.
Vogais:
Doutora Cláudia Saramago de Carvalho Marques dos Santos Cordovil, Professora Auxiliar do(a) Instituto Superior de Agronomia da Universidade de Lisboa, orientadora;
Doutora Maria Teresa Machado Dias, Bolseira de Pós-Doutoramento do(a) Faculdade de Ciências da Universidade de Lisboa.
i
Acknowledgements
A realização da presente dissertação apenas foi possível devido à ajuda imprescindível de várias pessoas, a diferentes níveis, mas nem por isso menos relevantes, às quais tenho muito a agradecer.
Obrigada Professora Doutora Cláudia Cordovil por ter aceitado orientar-me e, com base nos meus interesses para temas de estudo, ter sugerido e facilitado a parceria entre as duas instituições de ensino, durante todo o processo de elaboração desta dissertação.
Obrigada Professora Doutora Cristina Branquinho por me ter permitido ingressar neste projeto e ter aceitado orientar-me, fomentando assim a minha aprendizagem a novos conhecimentos que certamente serão uma mais-valia para o meu futuro. Obrigada ainda, por todo o apoio e atitude prestável que sempre demonstrou durante o decorrer desta dissertação.
Obrigada Alice por todo o apoio, paciência e simpatia demonstradas ao longo da realização desta dissertação. Sem a tua preciosa ajuda e acompanhamento, este trabalho final não teria sido possível.
Obrigada Melanie, a minha companheira de saídas de campo. Obrigada pelo apoio, companheirismo e paciência demonstradas. Obrigada também pela forma como me recebeste e transformaste facilmente uma relação de trabalho numa amizade.
Obrigada a todos aqueles que, direta ou indiretamente, permitiram a recolha de dados essenciais para a elaboração desta dissertação, de onde destaco: Pedro Pinho e Cristina Soares.
Enquanto Instituição de Ensino, onde passei cinco anos da minha formação académica, quero agradecer também ao Instituto Superior de Agronomia pela formação prestada, condições de trabalho e ambiente, que facilitaram a minha aquisição de conhecimentos e aprendizagens, e os quais foram cruciais para a realização deste projeto.
Obrigada à Faculdade de Ciências da Universidade de Lisboa por me ter permitido desenvolver grande parte do trabalho prático aqui apresentado nas suas instalações.
Obrigada às minhas grandes amigas e colegas de Mestrado, por toda a amizade e companheirismo.
Por fim, e porque sem eles sim, nada disto teria sido possível, muito obrigada Mãe e Pai! Obrigada por me terem guiado durante toda a vida, e me terem dado a oportunidade
ii de estudar aquilo que sempre quis. E, acima de tudo, muito obrigada por me acompanharem sempre e incentivarem-me a seguir os meus sonhos.
iii
Abstract
The present dissertation aims at understanding how the future climate change scenarios may affect the production of grassland biomass in the montado agro-sylvo-pastoral system, by studying the effects of precipitation, aridity and topography (slope) in both the field, in different sites along a climatic gradient in Alentejo, and in greenhouse trials, using the seedbank collected at those sites.
The impact of these three factors was studied independently, in order to understand the importance of each of them for biomass productivity and, consequently, determine the main driving factors.
The results showed a stronger effect of precipitation during the growing season on biomass productivity, in both field and greenhouse trials, thus highlighting this factor, among the three studied, as the major driver of biomass response and consequently of future changes in the landscape of montado agro-sylvo-pastoral system in Alentejo.
The comparison of field and greenhouse trial was also intended to study the seedbank ability to retain information regarding the past climate history of its site of origin – ‘memory’. Results showed that in greenhouse, regardless of the locations from where the soil samples were taken, the seed bank responded similarly in terms of biomass production, vegetation cover, species richness and flowering onset when subjected to similar favorable conditions in the greenhouse – regular and abundant watering.
iv
Resumo
A presente dissertação visa compreender de que forma os futuros cenários previstos para as alterações climáticas afetarão a produção de biomassa de pastagens nos sistemas de montado do Alentejo, estudando o efeito de três fatores ambientais: precipitação, índice de aridez e topografia (desvio padrão do declive) no campo, em diferentes locais ao longo de um gradiente climático na região do Alentejo, e em estufa, através do banco de sementes recolhido nesses locais.
O impacto destes três fatores foi estudado de forma independente, por forma a perceber qual deles suscitaria uma maior resposta relativamente à produtividade da biomassa e, consequentemente seria o maior condicionante.
Os resultados obtidos demonstram uma clara predominância do efeito da precipitação durante a estação de crescimento sobre a produção de biomassa, tanto em campo como em estufa (através de rega), destacando assim este fator, de entre os três em estudo, como o maior regulador de resposta imediata da biomassa e assim, de futuras alterações na paisagem do sistema agro-silvo-pastoril montado, no Alentejo.
Pretendia-se ainda, com a comparação entre campo e estufa, estudar a capacidade do banco de sementes para reter informação relativa ao passado histórico climático do respetivo local de proveniência – ‘memória’. Observou-se que na estufa, independentemente do local de onde era proveniente o banco de sementes, este respondeu de forma semelhante em termos de produção de biomassa, cobertura da vegetação, riqueza de espécies e início da floração, quando sujeito a condições favoráveis semelhantes na estufa, isto é, a rega periódica e abundante.
v
Resumo Alargado
Futuros cenários climáticos para a Península Ibérica preveem um aumento da variação no regime de precipitação, com um aumento da temperatura média anual e um decréscimo da precipitação anual. Diversos estudos têm também vindo a evidenciar o efeito das alterações climáticas como potenciador do aumento de aridez, uma vez mais, devido ao aumento das temperaturas, que irão aumentar as taxas de evapotranspiração e, consequentemente diminuir a quantidade de água disponível nos solos.
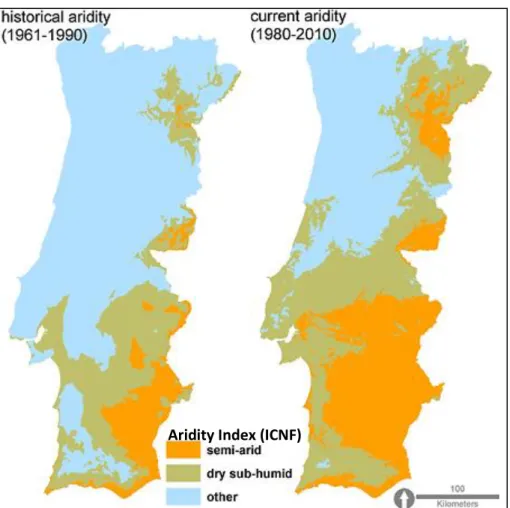
Considerada uma variável de longo termo (variável estável das condições climáticas médias ao longo de 30 anos), o aumento da aridez representa uma ameaça de desertificação. Um estudo regional de aridez necessita de um índice de aridez apropriado, o qual é definido como um indicador quantitativo de deficiência hídrica num certo local, e é calculado através do rácio entre precipitação e evapotranspiração de referência.
Ainda que os sistemas agroflorestais possuam um papel importante e positivo na conservação ambiental, estes estão a enfrentar um declínio na biodiversidade da sua biomassa, na Europa. O sistema agro-silvo-pastoril montado, caracterizado pela vasta presença de sobreiros, azinheiras e plantas anuais do tipo C3, encontra-se em cerca de 800,000 ha do território português, estando predominantemente situado na região do Alentejo. Apesar de serem sistemas resilientes e bem adaptados, a estabilidade dos montados pode ser perturbada por diversas alterações extremas, tais como: variáveis externas aleatórias relacionadas com a destruição de árvores e intensidade da regeneração natural; variáveis baseadas na gestão, que podem afetar o sistema ao nível da fisiologia das árvores e estrutura do solo (mobilização, risco de erosão, redução da matéria orgânica, perda de fertilidade, etc.). Assim, e do ponto de vista do valor socioeconómico, herança cultural e biodiversidade, o sistema montado é classificado pela Agência Europeia do Ambiente, como um sistema agrícola de elevado valor natural, estando também incluído no Anexo I da Diretiva Habitats da União Europeia (92/43/CEE).
Sob o regime climático médio avaliado pelo Programa de Acão Nacional de Combate à Desertificação, cerca de 36% do território continental português encontra-se já ameaçado pela desertificação. Assim, com base nas previsões acima referidas relativamente às alterações climáticas (aumento da temperatura e redução da precipitação), é expectável um aumento da vulnerabilidade de algumas regiões do território português e, consequentemente, o aumento de problemas ambientais como erosão do solo, fogos florestais, perda da diversidade biológica, etc.
vi Estudos têm vindo a reforçar também a importância das alterações climáticas no declínio da diversidade de espécies, uma vez que o clima é um importante fator limitante na distribuição de espécies a grandes escalas. Isto porque, parâmetros que caracterizam uma comunidade, como a sua riqueza em espécies ou composição florística não são apenas influenciados pelo grau de perturbação às quais as espécies estão sujeitas, mas também a fatores ambientais menos previsíveis, como flutuações nas condições meteorológicas.
Assim, a presente dissertação tem como objetivo compreender de que forma os futuros cenários previstos para as alterações climáticas afetarão a produção de biomassa de pastagens nos sistemas de montado do Alentejo, estudando o efeito de três fatores ambientais: precipitação, índice de aridez e topografia (desvio padrão do declive) no campo, ao longo de um gradiente climático na região do Alentejo, e em estufa, através do banco de sementes recolhido nesses locais. Ao todo, foram 17 os diferentes locais selecionados a partir do Inventário Florestal Nacional, com base nas seguintes características:
Altitude: entre 150 e 300 m;
Solo: predominantemente ácido (pH < 6.5), de litologia sedimentar e metamórfica, e sem registos de fogos nos últimos 40 anos.
O presente estudo conta com diferentes dados recolhidos ao longo de três anos (2013, 2014 e 2015), e teve como foco a obtenção das seguintes respostas: produtividade em campo; produtividade do banco de sementes em estufa; comparação entre a biomassa superficial e a biomassa em profundidade do banco de sementes em estufa, diversidade de espécies do banco de sementes em estufa; monitorização da fenologia de algumas das espécies mais representativas da região (Agrostis pourretii, Brachypodium distachyon, Gaudinia fragilis, Lolium rigidum, Leontodon taraxacoides, Tolpis barbata e Vulpia geniculata); comparação da produção de biomassa em campo com a produção de biomassa do banco de sementes em estufa.
Em ambos os principais ensaios feitos neste estudo (campo e estufa), uma conclusão geral pode ser retirada relativamente ao principal fator relacionado com a produção de biomassa: a precipitação. A precipitação do ano hidrológico desempenhou um papel importante como regulador da produção de biomassa, tanto no campo como em estufa onde, neste último caso, a mesma quantidade de água fornecida à comunidade de plantas provenientes de locais diferentes originou valores de produção de biomassa semelhantes.
vii Em termos de produção de biomassa em campo, os resultados mostraram que o declive tem também um papel importante: quanto maior o declive, menor a produção de biomassa. Estes resultados permitiram assim concluir que a topografia do local é fundamental. Relativamente ao declive, foi ainda possível concluir que existe uma menor variação de produção de biomassa entre anos em locais com maior declive, reforçando a ideia de que este é um fator também a ter em consideração em futuros estudos.
Pretendia-se ainda, com a comparação entre campo e estufa, estudar a capacidade do banco de sementes para reter informação relativa ao seu passado histórico climático do respetivo local de proveniência – ‘memória’.
Contudo, no ensaio desenvolvido em estufa, tanto o índice de aridez como o declive não apresentaram um impacto significante na produção de biomassa, cobertura vegetal, número de espécies e data da primeira floração. Em vez disso, o banco de sementes em estudo na estufa, respondeu positivamente ao fator de disponibilidade de água, ao qual esteve submetido através de uma régua periódica e abundante. Esta resposta da biomassa revela que a precipitação do ano hidrológico, por si só, é capaz de alterar uma resposta prévia da biomassa, se as condições de disponibilidade de água se alterarem. Assim, a biomassa germinada em estufa não aparentou possuir uma ‘memória’ climática histórica, mas sim, responder de forma imediata a variações inter-anuais de precipitação. Em suma, isto significa que se a precipitação do ano hidrológico se alterar num determinado local, também a resposta da biomassa em termos de produtividade se irá alterar naquele ano, aumentando ou diminuindo de acordo com a quantidade de precipitação.
Relativamente às diferentes profundidades do solo no banco de sementes em estufa, diferentes respostas de produtividade da biomassa foram também registadas, como tem vindo a ser defendido em vários estudos, com uma maior produção e riqueza de espécies à superfície. Estes resultados reforçam assim a ideia da existência de diferenças cronológicas a diferentes profundidades do solo, e demonstram a necessidade da inclusão deste fator em futuros estudos respetivos à produção de biomassa.
Contudo, as causas de degradação do solo, desertificação e consequente redução na produção de biomassa na região do Mediterrâneo, estão relacionadas de forma complexa com outros diversos fatores biofísicos, o que torna difícil a quantificação do total impacto das alterações climáticas sobre estes ecossistemas. Assim, este estudo também demonstra a importância da necessidade de futuros estudos a larga escala.
viii A presente dissertação permite salientar ainda aquilo que tem vindo a ser defendido relativamente à necessidade de atuação e respostas a diferentes níveis e setores no combate às já existentes alterações climáticas registadas. Reforçando, desta forma, a ideia de que medidas mitigatórias são necessárias, de forma a assegurar um futuro sustentável, e a diminuir a necessidade de futuras medidas adaptativas no combate às alterações climáticas.
ix
Table of Contents
Chapter 1 – Introduction ... 1
1.1. Climate change predictions ... 1
1.2. Montado system ... 3
1.3. Climate change and the montado ... 5
1.4. Motivations ... 6
Chapter 2 – Materials and Methods ... 10
2.1. Sampling sites ... 10
2.2. Field biomass production ... 11
2.3. Greenhouse biomass production and species richness ... 12
2.3.1. Year of 2013 ... 12
2.3.2. Year of 2014 ... 12
2.4. Environmental factors data ... 14
2.4.1. Hydrological year precipitation ... 14
2.4.2. Aridity index ... 14
2.4.3. Slope ... 14
2.5. Data analysis ... 14
Chapter 3 – Results and Discussion ... 15
3.1. Field biomass production ... 15
3.1.1. Biomass production of 2014 and 2015 and precipitation ... 15
3.1.2. Biomass production of 2014 and 2015 and aridity index... 16
3.1.3. Biomass production of 2014 and 2015 and slope ... 17
3.2. Greenhouse biomass production ... 18
3.2.1. Soil samples of 2013 ... 19
3.2.2. Soil samples of 2014 ... 19
3.2.2.1. Average biomass production and site characteristics ... 19
3.2.2.2. Final vegetation cover and number of species with site characteristics ... 19
3.2.2.3. Average biomass production, final vegetation cover and number of species at different depths ... 21
3.2.2.4. Flowering monitoring ... 22
3.3. Greenhouse vegetation cover versus site vegetation cover of 2014 ... 26
x Chapter 5 – References... 29
xi
Index of Tables
Table 1 - Type of climate according to the FAO aridity index (adapted from Moral et al.,
2015). ... 2
Table 2 - Pearson’s correlation coefficients, at p < 0.05, between average biomass
production of 2014 and 2015 and aridity index. ... 16
Table 3 - Pearson’s correlation coefficients, at p < 0.05, between average biomass
production and site characteristics for 2013 seed bank trial. ... 19
Table 4 - Pearson’s correlation coefficients, at p < 0.05, between average biomass
production and site characteristics for 2014 seed bank trial. ... 19
Table 5 - Pearson’s correlation coefficients, at p < 0.05, between final vegetation cover and
number of species with site characteristics for 2014 seed bank trial (1: surface; 2: depth). 20
Table 6 - Monitoring of first flowering date of Agrostis pourretii along the aridity index, at
different depths... 22
Table 7 - Monitoring of first flowering date of Brachypodium distachyon along the aridity
index, at different depths. ... 22
Table 8 - Monitoring of first flowering date of Gaudinia fragilis along the aridity index, at
different depths... 23
Table 9 - Monitoring of first flowering date of Leontodon taraxacoides along the aridity
index, at different depths. ... 23
Table 10 - Monitoring of first flowering date of Lolium rigidum along the aridity index, at
different depths... 24
Table 11 - Monitoring of first flowering date of Tolpis barbata along the aridity index, at
different depths... 24
Table 12 - Monitoring of first flowering date of Vulpia geniculata along the aridity index, at
different depths... 25
Table 13 - Pearson’s correlation coefficients, at p < 0.05, between final vegetation cover of
xii
Index of Figures
Figure 1 - Evolution of the climate classification base on the Aridity Index. Source: Rosário
(2014). ... 3
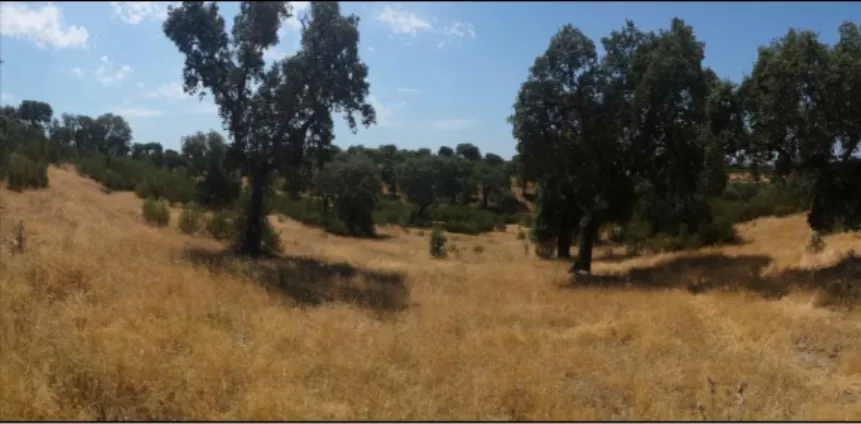
Figure 2 - Representative photo of the selected sites. ... 11
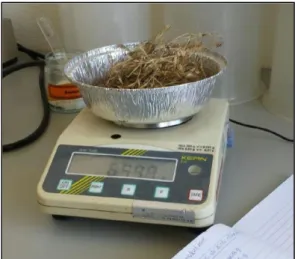
Figure 3 - Weighing of the 2014 biomass... 12
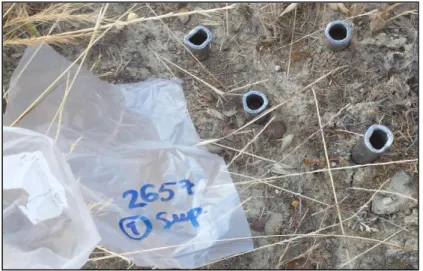
Figure 4 - Soil sample collection at a 0-5 cm depth. ... 13
Figure 5 - 2014 Seed bank trial. ... 13
Figure 6 - Relation between average biomass production and currently hydrological year precipitation. ... 15
Figure 7 - Difference between 2015 and 2014 average biomass along the aridity index. .. 16
Figure 8 - Relation between average biomass production and slope. ... 17
Figure 9 - Difference between 2015 and 2014 average biomass along the slope. ... 18
Figure 10 - Variations in average biomass production (A) vegetation cover (B) and number of species (C) in seed bank samples, at different depths. ... 21
Figure 11 - Greenhouse final vegetation cover versus field final vegetation cover at different depths. (R1: surface determination coefficient; R2: depth determination coefficient). ... 26
xiii
Abbreviations
ET Evapotranspiration
UNCCD United Nations Convention to Combat Desertification
UNCED United Nations Conference on Environment and Development
AI Aridity Index
ET0 Reference Evapotranspiration
FAO Food and Agriculture Organization
EEA European Environmental Agency
HNVF High Nature Value Farmland
CEE European Economic Community
AES Agri-environment Schemes
CAP Common Agricultural Policy
EU European Union
ESAs Environmentally Sensitive Areas
ESs Ecosystem Services
GLASOD Global Assessment of Soil Degradation
PET Potential Evapotranspiration
ANPP Aboveground Net Primary Productivity
AFN Autoridade Florestal Nacional
1
Chapter 1 – Introduction
1.1. Climate change predictions
Future climate change scenarios for the Iberian Peninsula predict an increasingly variable precipitation regime, with the increase of annual mean temperatures and the decrease of annual precipitation. Consequently, the risk of drought in Mediterranean ecosystems is likely to increase (Jongen et al., 2013).
Drought is a natural phenomenon of uncertain frequency, duration and severity, occurring when water availability is significantly below certain established levels, resulting in a diminished water resources availability, and reduced carrying capacity of the ecosystems (Moreira, Mexia, & Pereira, 2013). In fact, based on the future scenarios, an increasing drought frequency in Portugal for the February to March period, and also a decrease in the Mediterranean region’s cold season precipitation, has been already in place (Jongen et al., 2013). Those called precipitations extremes (meteorological droughts or episodes with extremely high precipitation amounts – above the 95th percentile –, also known as ‘wet extremes’), are of major interest, mainly due to their potential damage impacts (Costa, Santos, & Pinto, 2012).
There is also evidence that climate change will increase aridity globally due to the increasing temperatures, conducing to higher rates of evapotranspiration (ET) (Girvetz & Zganjar, 2014). Not a synonymous of drought, which already mentioned, is defined as a temporary reduction in the precipitation in a determined area (Moral et al., 2015), aridity refers to the dryness of the atmosphere, being a long-term measure (stable variable) of 30 years-average climate conditions. Its increase represents a threat of desertification, affecting more seriously fields like agricultural and water supply, given that this last one can be a limiting factor for plant growth and distribution. Approaches based on aridity gradients have been frequently used to study aridity impacts on Mediterranean ecosystems (Sternberg et al., 2011).
A regional study of aridity needs an appropriate aridity index (AI), that can be defined
as a quantitative indicator of water deficiency in a certain location (Moral et al., 2015). It is calculated as the ratio between precipitation (moisture supply) and reference evapotranspiration (ET0) (Girvetz & Zganjar, 2014). This ratio, together with soil
physico-chemical properties, determines the amount of soil moisture available for biological productivity (Safriel, 2006). Thus, an aridity index – numerical indicator of the degree of dryness of the climate at a specific location – can be used for monitoring and predict
2
droughts, or for assessing areas sensitive to desertification, as a climate index. And so, the higher the values of the aridity indices in a certain region, the greater the water resource availability. The Food and Agriculture Organization (FAO) aridity index is frequently utilised to assess spatial patterns of aridity at a country or regional level (Moral et al., 2015) – Table 1.
Table 1 - Type of climate according to the FAO aridity index (adapted from Moral et al., 2015).
Classification Aridity Index
Hyper-arid AI < 0.05 Arid 0.05 ≤ AI < 0.20 Semi-arid 0.20 ≤ AI < 0.50 Dry sub-humid 0.50 ≤ AI < 0.65 Wet sub-humid 0.65 ≤ AI < 0.75 Humid AI ≥ 0.75
Desertification, defined by the United Nations Convention to Combat Desertification (UNCCD) as land degradation in arid, semi-arid and dry sub-humid areas (Pereira, Louro, do Rosario, & Almeida, 2006), is generally viewed as an advanced stage of land degradation, when vegetation cover falls below some level – about 35 % (Sentis, 2006), and is a result of various factors, including climatic variations and human activities (Pereira et al., 2006), striving to produce essentials for human livelihoods, like food, fibers and forage, by exploiting a major service of dryland natural ecosystems: land, or biological productivity. Thus, the first signs of desertification serve also as an indicator that the threshold between sustainable and non-sustainable dryland development has been crossed (Safriel, 2006).
Under the mean climatic regime evaluated by the National Action Programme to Combat Desertification, about 36% of the Portuguese continental territory is already threatened by desertification. Thereby, higher temperatures and less precipitation will induce to a major impact of droughts on the Portuguese continental territory, increasing the vulnerability of some Portuguese regions, and consequently their economic and environmental problems, e.g. by increasing soil erosion and forest fires, and by decreasing agro-forestry-grazing productivity, aquifers recharge and biological diversity (Costa et al., 2012).
3
1.2. Montado system
Montados on the Iberian Peninsula are agro-sylvo-pastoral systems composed of cleared cork (Quercus suber) and holm oak (Quercus ilex rotundifolia) trees, contributing about 33% of the world cork oak area, and 54% of the mean annual world cork production (Pinto-Correia, Ribeiro, & Sá-Sousa, 2011). These agro-sylvo-pastoral systems, similar to the dehesa in Spain, with about 800,000 ha in Portugal, cover most of the Southern region of the country, in the region of Alentejo, where it covers 730,000 ha (Pinto-Correia et al., 2011). Its origin comes from natural forests, following the removal of trees by human activities such as clearing, burning and grazing (Castro & Freitas, 2009).
The present relevant production activities occurring in the montado system, are: cereal crops cultivated in long rotations, combined with fallowing, and extensive livestock grazing/raising (Pinto-Correia et al., 2011).
This evergreen oak woodlands in Portugal, are characterized by diverse understorey vegetation – which has a significant role in the ecosystem function –, similar to Mediterranean grasslands, and by C3 annual plants species (Jongen et al., 2013). Most of
Figure 1 - Evolution of the climate classification base on the Aridity Index. Source: Rosário (2014).
4 those plant and fungi species found in these landscapes are considered as non-timber forest products for human use. Nevertheless, in terms of biodiversity, montado landscapes represents an richness of 60-100 flowering plant species per 0.1 ha (Pinto-Correia et al., 2011).
Although montados are well adapted and resilient systems, their stability can be disturbed by different extreme changes, such as: random external variables that relate to tree mortality or damage, and intensity of natural regeneration; management-based variables that can affect the system at tree level physiology (debarking, crown and root pruning), and at a site level, mainly by soil structures modifications, like soil mobilisation, erosion risk, organic matter depletion, fertility loss, etc. At the moment, the observed effects on the loss of tree density, are a result of numerous combinations of these factors, which are also a response from climate change (Pinto-Correia et al., 2011), and when the canopy structure of cork oak agro-sylvo-pastoral systems is low in terms of tree density, the vegetation resembles to natural savannas (Acácio & Holmgren, 2014). Nevertheless, although trees are frequently taken into account when measuring ecosystem services (ESs) related to biomass production, such as carbon sequestration, the productivity of annual plants is also an important part of the ecosystem produced biomass (Pinho et al., 2015), especially in regard of their function as an important soil protection mechanism and respective improvement of water infiltration.
An assessment carried out by FAO, based on data collected by the project “Global Assessment of Soil Degradation” (GLASOD), showed that 19,5% of drylands of the world have been affected by soil degradation, being the Mediterranean region subjected to significant degradation of its natural resources for a long period (Kosmas et al., 2006).
From the point of view of biodiversity, socio-economic value and cultural heritage conservation, montado is classified by the European Environmental Agency (EEA), as a High Nature Value Farming (HNVF) system, regarding the several conservative initiatives of EEA to prevent the loss of farmland biodiversity (Sérgio Godinho, Gil, Guiomar, Neves, & Pinto-Correia, 2016), and is also included in Annex I of the European Union Habitats Directive (92/43/CEE) (Godinho et al., 2016; Sá-Sousa, 2014). HNVF systems comprise ‘areas in Europe where agriculture is a major (usually the dominant) land use and where that agriculture supports, or is associated with, either a high species and habitat diversity or the presence of species of European conservation concern, or both’, and are related to low external input farming systems under traditional practices (Lomba et al., 2014). This concept was created with the objective of typifying and helping to preserve agricultural systems with biodiversity value, but this classified HNVF systems have been declining, mainly due to rural depopulation, agricultural desertion and afforestation in marginal farming areas, along with
5 land use intensification in most productive areas. It is then commonly agreed that agri-environment schemes (AES) and other funding mechanisms implemented by the Common Agricultural Policy (CAP) of the European Union (EU) could play a big role for the improvement of this trends (Ribeiro et al., 2014).
1.3. Climate change and the montado
Environmentally Sensitive Areas (ESAs) to desertification around the Mediterranean region exhibit different sensitivity to desertification for various reasons (Kosmas et al., 2006).
Rainfall fluctuations are common in Mediterranean climates, and have been cited as one of the possible causes of the high diversity in annual pastures, as they permit the coexistence of numerous species with differing requirements (Peco, Espigares, & Levassor, 1998).
By the scope of projected climate changes scenarios, runoff is expected to decrease, as a result of lower rainfall, soil water deficits are expected to increase, as well as potential evapotranspiration (PET), leading to a decrease in streamflow (Serpa et al., 2015).
All the already above mentioned predicted impacts of climate change in soil and water, that will increase the desertification susceptibility of large areas, assume a great place, particularly in southern and northeaster Portugal (Costa et al., 2012). Other predictable consequence of climate change in montado is the spread wildfires that can transform the actual montado mosaic into large and persistent shrub-lands (Pinto-Correia et al., 2011).
These grassland ecosystems are normally considered as being very sensitive to climate changes, especially in terms of precipitation, with the interannual variation in aboveground net primary productivity (ANPP) being correlated with the interannual variation in precipitation, not only to the size, but also to the timing of precipitation inputs (Jongen et al., 2013). Therefore, global warming has been also pointed out, by several studies, has a threat for numerous plant species, given the importance of climate as a limiting factor of species distributions at macro ecological scales (Monteiro-Henriques & Espírito-Santo, 2011). In fact, Mediterranean ecosystems threatened by desertification, characterised by a great richness of species, are facing a drastically diminished is this characteristic, when degradation processes act (Rubio & Recatalá, 2006). Parameters that characterized the community, such as its species richness or floristic composition, are not only influenced by the degree of disturbance that communities are submitted to, but also by less predictable environmental factors such as fluctuations in meteorological conditions (Peco et al., 1998).
6 In the Mediterranean basin region, the standard deviation of the slope around a sampling point is a surrogate of soil quality and hydrology. These are significant differences for Mediterranean plant communities, where, as we have seen already, water availability is an important limiting factor (Sternberg & Shoshany, 2001).
The challenge to predict the ecosystems response to climate change is based on the multi-dimensional and multi-scale nature of the problem (Sternberg et al., 2011). Therefore, it becomes clearer the need of models based on the present relationships between climate and species, in order to fulfil the lack of a first approach to predict the already present impacts of climate change on species distributions (Monteiro-Henriques & Espírito-Santo, 2011).
1.4. Motivations
Although agroforestry systems play a positive and important role on environmental conservation, these systems are still facing a declining in diversity extension in Europe (Moreno, 2008).
As we have seen above, the causes of land degradation and desertification in the Mediterranean region are mainly related to complex interactions of diverse natural biophysical factors (climate, soil, topography, vegetation cover), which mainly determine the land hydrology, but also, due to social economic factors (population increase or decrease, migration, socio-cultural and economic changes, institutions), which determine land use changes (deforestation, fires, cropping, grazing, constructions) mainly affecting the hydrology of a territory (Sentis, 2006).
In order to preserve the actual characteristics of the montado and its identity, it is crucial to adopt good practices focused on long-term objectives and to promote its regeneration as a whole system. For that, adaptive management techniques are required, based on growth models and decision support systems, relying in knowledge-based monitoring systems (Pinto-Correia et al., 2011).
It has been recognized, by several organizations, that indicators are playing an increasingly important role in supporting development policies for protecting land from desertification. These indicators can become a valuable tool for land users or policy makers if certain criteria are met. Also, various studies have been shown that indicators are related to the type of ESAs (Kosmas et al., 2006).
On the one hand, the climatic conditions determine the amount, time and spatial variability of precipitation and, indirectly, the regime and quantity of evapotranspiration from
7 natural and man-made ecosystems. Therefore, the precipitation and ET regimes influence and characterize land conditions. On the other hand, the land condition, referring to soil hydraulic properties and vegetation cover, influences or determines the partition of the precipitation into the various components of the hydrologic cycle (i.e., interception, direct evaporation, surface runoff, and infiltrated water), which partitions again into vegetation ET, subsurface flows and groundwater flows. Therefore, water resources influence and are affected by land condition, mainly in which concerns the hydrologic balance at the local scale (Pereira et al., 2006).
Some literature refers to changes in plant communities and biomass production with soil depth, being this factor also an important one to consider, when studying the response of biomass to changes in the environment (Hirzel & Matus, 2013; Niemi et al., 2005; H. M. Wang et al., 2014). Buried viable seed banks play an important role in the conservation and restoration of plant communities (Thompson et al. 1997), and are important predictors of plant response to changing land use and climate (Hodgson & Grime 1990). There is abundant evidence that deeply buried seeds are older than shallow ones, allowing the indirect estimation of seed longevity based on the ratio of deeply buried to shallow seeds (Bakker 1989; Thompson et al 1997). Widely used standardized protocols to study seed bank longevity propose the sampling of soil cores to a depth of 10 cm, with the subdivision of each core in a 0-5 cm and 5-10 cm layer (Bekker et al. 1998; Kleyer et al. 2008).
Precipitation, as a parameter, is then one of the most relevant ones used in terms of climatic change impacts studies, especially for systems that critically depend on its amounts and regularity, like the agro-sylvo-pastoral system montado. Not only by describing the climatic conditions at a given location, but also in assessing which potential impacts on many natural as well as socioeconomic systems (Costa et al., 2012).
As several studies conducted in the Mediterranean Basin indicate, the hydrological behaviour of different land-cover types is linked to the existing vegetation and to its spatial and seasonal variation patterns (Serpa et al., 2015). There were considered four scales of variability in terms of understanding how the climate risk associated with the transformation of the system has led to an extreme biophysical degradation in Alentejo, to the point of reaching the desertification stage: the scale of the rainfall event, the seasonal distribution of rainfall, the dry or excess rain phases, and the secular trend. These four scales, separately or in synergy, defy the balance of soil-vegetation complex (de Brum Ferreira, 2001). Nevertheless, several studies demonstrated that the relationship between precipitation variability and interannual variation in ANPP remains unclear, given that an ecosystem’s sensitivity to precipitation variability depends on vegetation structure, species composition,
8 soil characteristics and climate zone (Castro & Freitas, 2009; Jongen et al., 2013; Moreno, 2008).
There is also evidence that species are already shifting their ranges in response to changes in regional climates, such as: altering their phenology, some are facing extinction, or even have become extinct (Thuiller et al., 2008).
The effects of climate change on vegetation can be studied directly or indirectly. The first approach involves monitoring of dynamic, long-term vegetation changes in permanent plots, which involves long study periods (observations over, at least, 30 years). However, in many cases it is necessary to draw conclusions about successional trajectories from short-term observations. This indirect approach typically involves extrapolation from spatially distinct sites that are expected to represent certain stages in a temporal succession, to temporal patterns – the space-for-time substitution (Sternberg et al., 2011). Thus, in this study, this space-for-time approach was adopted, assuming that biotic responses to climatic changes can be inferred from current species distributions and their correlations with abiotic factors (Fleischer & Sternberg, 2006), given that this static approach is necessary in several fields of scientific inquiry where direct observation of ‘chronsequences’ are feasible (Sternberg et al., 2011). Knowing that in case of effects of memory in space, the space for time in this study is only an approximation. On the other hand, if there is no memory effect, the space as time surrogate can be used. Also, despite of all the results of future predictions of climate change studies, the local climate change signal could be significantly different from the large-scale mean signal, thus reinforcing the need of assessment studies at a regional-scale (Costa et al., 2012).
Given the already mentioned precipitations scenarios not only focused on central tendency parameters, but also on the projected changes in the occurrence of extremes (an increasing drought frequency in Portugal for the February to March period, and a decrease in the Mediterranean region’s cold season precipitation), and since this is the growth phase of plants, particularly annual species, their productivity can be compromised. Therefore, in this study we focused largely on the response of productivity of characteristic annual species.
Finally, those predictions are of high importance in developing proper both mitigation and adaptation measures at a local scale, being expected that future scenarios, specifically developed for Portugal and its regions, can be used as reliable information for consulting by stakeholders, decision and policy makers (Costa et al., 2012).
9 Therefore, in this study, the specific objectives were to study the productivity of biomass in 12 different sites in Alentejo, along a climatic gradient in space, over 3 years (2013, 2014, and 2015), in terms of:
Site productivity;
Seed bank productivity in greenhouse;
Above-ground versus under-ground seed bank productivity in greenhouse; Seed bank floristic diversity in greenhouse.
Greenhouse vegetation cover versus field vegetation cover Relating with 3 different environmental factors:
Precipitation; Aridity index; Slope.
10
Chapter 2 – Materials and Methods
The present dissertation is part of the project “Modelling ecosystem structure and functional diversity as early-warning indicator of desertification and land-degradation – from regional to local level”, developed by the research group "Ecology of Environmental Change" of the Faculty of Science, University of Lisbon.
This chapter includes all the experimental work of this study, organized into six central sections:
I. Sampling sites;
II. Field biomass production;
III. Greenhouse biomass production and species richness;
IV. Environmental factors data;
V. Data analysis.
2.1. Sampling sites
The sampling sites – circular plots (250 m radius) – were chosen based on the sites of the Portuguese National Forest Inventory (AFN, 2010). From the c. 336000 points distributed across the country, only the ones with Holm-oak woodlands as main land-use type were pre-selected. Then, a smaller set of sites was chosen, based on environmental factors, in order to homogenize the sampling condition, and to ensure that only the effects of aridity were taken into account. This homogenization was done by selecting, from all possible sampling sites available, the ones with the following characteristics:
Altitude: between 150 and 300 m;
Soil: prevalently acidic (pH < 6.5), dominated by sedimentary and metamorphic lithology, and with no fire records for the last 40 years, to avoid confounding effects of factors other than aridity and to ensure homogenization as much as possible; This homogenization resulted in 6242 sampling sites distributed along a climate gradient (AFN, 2010; Atlas Digital do Ambiente, 2011). Afterwards, a random selection of sites stratified by the aridity index was made, to ensure an even representation of different aridity levels. After that, a total of 17 sampling sites where randomly chosen which, in addition to the previously described characteristics, had also:
Moderate to low grazing intensity;
11 These latter conditions were verified in the field by inspecting evidence of grazing in vegetation, and the absence of recent soil tillage.
However, depending on the year of the analysis, and on the type of data collected, a different subset of these 17 sites, was studied, as shown in the coming sections.
2.2. Field biomass production
To study the effect of aridity in the herbaceous community productivity, in a total of 16 sites, distributed along the study region (Moura, Silves, São Brás de Alportel, Évora, Castro Verde, Almodôvar, Castro Verde, Martim Longo, Corvos, Casa Branca, Viana do Alentejo, Mértola and Barrancos), the aerial part of the herbaceous vegetation was collected. Previous to the start of this dissertation, the 2014 biomass had been already collected from 14 different sites, allowing the posterior extraction of data for analysis, while the 2015 extraction took place during the course of this dissertation, also in 14 different sites (12 sites are the same between years, and 4 sites were visited only in one year).
Biomass was collected using a quadrat with 30 x 30 cm (900 cm2 = 0,09 m2), in five replicates per site, and then oven dried at 60°C for 48 h, in order to calculate its dry biomass. Finally, a total weight value was obtained for each site, based on the average values of its replicates, using an analytical balance (KERN EW, 1mg precision).
A percentage of final vegetation cover was also registered using the point–intercept method.
12
2.3. Greenhouse biomass production and species richness
2.3.1. Year of 2013
During the Spring of 2013, five sites (Moura, Almodôvar, Montemor-o-Novo, Mértola and Barrancos) were randomly chosen, and 4 soil samples were collected (up to 10 cm of depth), in order to see what would posteriorly germinate in the greenhouse. On the fall of that same year, each soil sample was placed in 10 x 20 cm trays in the greenhouse, where they were watered abundantly and regularly, over approximately 8 months. The biomass produced was, in the end of the growing season, collected and oven dried at 60°C for 48 h, in order to calculate its dry biomass using two analytical balances (KERN EW, 1 mg precision and KERN ABS, 0.1 mg precision). Finally, a total weight value was obtained for each site, based on the average values of its four replicates.
2.3.2. Year of 2014
During the above mentioned trial of 2014 (section 2.2), soil samples were also collected per site, in order to study its seed banks compositions in greenhouse germination. This soil collection was done at two different depths: five samples of 0 to 5 cm and five samples of 5 to 10 cm, in a total of 10 replicates per site, so their productivity and species richness differences could be studied.
13 Then, 150 trays of 10 x 10 cm (140 soil samples and 10 controls) were placed in the greenhouse, in the beginning of this dissertation (January of 2015), where they were watered abundantly and regularly, over four months.
Similar to the 2013 greenhouse trial, the produced biomass was collected and oven dried at 60°C for 48 h, and a total weight value was obtained for each site, based on the average values of its five replicates, using two analytical balances (KERN EW, 1 mg precision and KERN ABS, 0.1 mg precision).
During this trial, a monitoring of phenology was also made, by registering the dates of the first flowering on eight of the most representative plant species of the study region:
Figure 4 - Soil sample collection at a 0-5 cm depth.
14 Agrostis pourretii, Brachypodium distachyon, Gaudinia fragilis, Lolium rigidum, Leontodon taraxacoides, Tolpis barbata and Vulpia geniculata.
In the end, a percentage of final vegetation cover in each tray was also registered by visual estimation.
2.4. Environmental factors data
2.4.1. Hydrological year precipitation
In order to study the relation between precipitation and the vegetation data, climatic data available in the Instituto Português do Mar e da Atmosfera (IPMA) for the monthly precipitation, referent to our sites in study, was used, for the years 2013, 2014 and 2015. Based on these data, a calculation was then made to achieve the value of the hydrological year, by summing the values of precipitation from October 1 of the previous year to September 30 of the year in study.
2.4.2. Aridity index
Referring to the AI, the factor of the United Nations was used, representing the ratio of mean annual precipitation to annual potential evapotranspiration to describe the aridity gradient. The AI data for the period 1950 – 2000 were retrieved from a global aridity database (http://www.cgiar-csi.org/data/global-aridity-and-pet-database), and ranged from 0.42 to 0.54.
2.4.3. Slope
Slope measured in the center of the sampling area at each site.
2.5. Data analysis
The relation between vegetation and the environmental variables was assessed by means of linear correlations (standard Pearson r), using the Statistica software version 13.2, in order to compute the standard Pearson product-moment correlation coefficients.
15 0 20 40 60 80 100 120 140 160 180 200 300 400 500 600 700 B io m ass p ro d u ction (g/m 2)
Precipitation of the current hydrological year (mm)
2014 2015
Chapter 3 – Results and Discussion
3.1. Field biomass production
3.1.1. Biomass production of 2014 and 2015 and precipitation
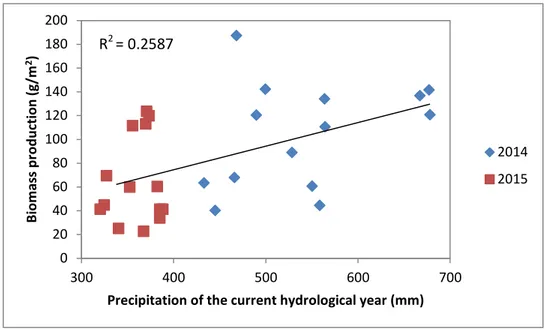
Figure 6 - Relation between average biomass production and currently hydrological year precipitation.
Precipitation changes are particularly important at mid-latitudes (e.g., around the Mediterranean Basin), where water availability is a key driver in ecosystem functioning, and where global circulation models agree that future precipitation will be lower than today (Sternberg et al., 2011).
In Interior Alentejo, the climate has two unfavourable seasons for biomass production, summer (hot to very hot and dry), and winter (humid and cold), where rainfalls have a great intra and inter annual variability. These characteristics determine the vegetation predominance in this region (de Brum Ferreira, 2001).
As shown in Figure 6, and based on the climatological annual reports issued by the IPMA (https://www.ipma.pt/en), 2014 was considered a very rainy year (anomaly of +216.1 mm), while 2015 was considered an extremely dry year, with precipitation values much lower than the usual (anomaly of -282.5 mm). Based on the Pearson product-moment correlation computed for both years altogether, were correlations are significant at p < 0.05, the average biomass production was positively correlated with the precipitation of the current hydrological year (r = 0.5087, p = 0.006).
16 These conclusions represent what several studies have been defending: a decrease in precipitation due to climate changes has been identified as the main cause of reduced surface water availability (Serpa et al., 2015), and consequently, a reduction in biomass production.
3.1.2. Biomass production of 2014 and 2015 and aridity index
Table 2 - Pearson’s correlation coefficients, at p < 0.05, between average biomass production of 2014 and 2015
and aridity index.
As Table 2 shows, there was no significant relation between the aridity index and the average biomass production for both years.
This allows us to conclude that this variable does not seem to explain, at least by itself, the effects of spacial and long-term temporal climate variations.
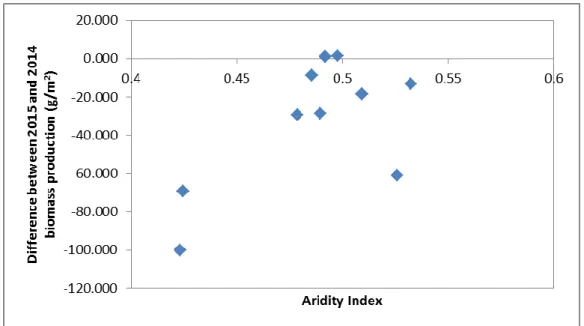
As, in fact, is showed in the graphic above (Figure 7), which represents the difference between the 2015 and the 2014 average biomass for each site, in relation to the aridity index and, according to Pearson’s correlation coefficients, does not show any significant relation between them (r = 0.3027, p = 0.339). Nevertheless, the graphic shows a tendency for a greater variability in biomass production between years in more arid locations where the water availability is more limiting for biomass production, there is a greater
Biomass production of 2014 and 2015 (g) Aridity index r= - 0.0462
p= 0.815
17 0.000 20.000 40.000 60.000 80.000 100.000 120.000 140.000 160.000 180.000 200.000 0.00 5.00 10.00 15.00 20.00 25.00 B io m ass p ro d u ction (g/m 2) Slope (°) 2014 2015
variability in biomass production, than in the less arid locations where the amount of precipitation is always larger and therefore less limiting for biomass production.
3.1.3. Biomass production of 2014 and 2015 and slope
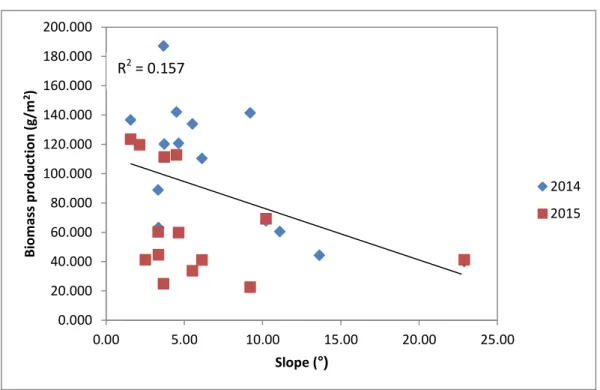
Within the regional characterization, slope plays a relevant role on the spatial distribution characteristics of the vegetation (Sternberg & Shoshany, 2001).
According to the results shown in Figure 8, and based on Pearson product-moment correlation coefficients between average biomass production of both years and the slope, a significant correlation was obtained (r = - 0.3960, p = 0.037). This means that the highest the slope, the lower the average biomass production.
This biomass reduction along the slope may be explained by the existent relationship between the slope angle and the density of buried seeds. In upper basins with many slopes, the loss of seeds by rolling off and draining off play greater role in forming the soil seed bank than seed inputs. Thus, slope angle have a negative effect on the seeds accumulation (Y. Wang, Jiang, Toshio, & Zhou, 2013).
Also, due to the water infiltration decrease with the increasing in the slope steepness (Huat, Ali, & Low, 2006), one of the reasons behind this results, may be the consequent increase in water runoff, resulting in a lower soil water availability, which promotes soil erosion, leading to its degradation (Sérgio Godinho et al., 2016).
Figure 8 - Relation between average biomass production and slope. R2 = 0.157
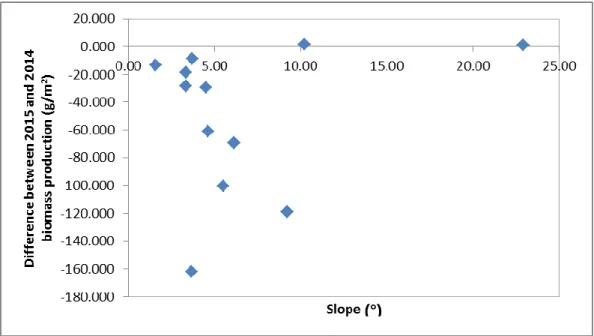
18 Despite the absence of correlation between the difference between 2015 and 2014 biomass production and the slope (r = 0.2219, p = 0.488), in Figure 9 we may observe a tendency for a more similar biomass production between years in sites with higher slope, which may be related with the above mentioned limitation, independently of the amount of precipitation. This means that, no matter the amount of precipitation, the biomass production will not vary greatly, while in sites with lower slope, a higher variation in production between years seems to occur.
3.2. Greenhouse biomass production
Soil seed banks play a critical role in the vegetation dynamics of many plant communities, as the ‘seed reserve’ is capable of stabilizing population dynamics in response to short-term environmental fluctuations and disturbances, and also, it can determine future successional trajectories. On the other hand, a depleted seed bank limits the potential for its community regeneration (del Cacho et al., 2012).
Seed banks are also characterized by high spatial and temporal variability, especially in arid and semi-arid ecosystems, where the seed bank is largely determined by the spatial pattern of vegetation (del Cacho et al., 2012).
Ecological memory is encoded in the pattern of vegetation across a landscape. The behaviour of ecosystems with little memory will only track changes in vegetation recovery and fire frequency. However, ecosystems with strong memory can respond to changes in
Figure 9 - Difference between 2015 and 2014 average biomass along the slope.
19 driving processes in much complex ways, given that strong memory should initially inhibit ecological response to change (Peterson, 2002).
3.2.1. Soil samples of 2013
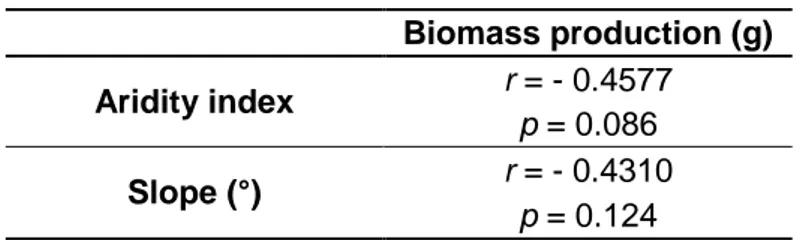
Table 3 - Pearson’s correlation coefficients, at p < 0.05, between average biomass production and site characteristics for 2013 seed bank trial.
Based on Table 3, referent to the 2013 seed bank trial, it is possible to see that there is no significant relation between the average biomass production and the aridity index. The same absence of relation is also verified in the case of slope.
3.2.2. Soil samples of 2014
3.2.2.1. Average biomass production and site characteristics
Table 4 - Pearson’s correlation coefficients, at p < 0.05, between average biomass production and site
characteristics for 2014 seed bank trial.
Regarding the 2014 seed bank trial, no significant correlations between the average biomass production (sum of the averages productions of the two studied soil depths) and both aridity index and slope were observed, as shown in Table 4.
3.2.2.2. Final vegetation cover and number of species with site
characteristics
Species richness is characterized as the number of biological species in a particular community (Kondoh, 2001), and biodiversity may be one of the major drivers of ecosystem changes in the 21st century, with the positive change in ecosystem multifunctionality observed with increases in species richness (Quero et al., 2013). Two of the most important aspects that structure grasslands like Montado, are slope-valley systems and trees, both of
Biomass production (g) Aridity index r = - 0.4577
p = 0.086
Slope (°) r = - 0.4310
p = 0.124
Average biomass production (g) Aridity index r= - 0.0368
p= 0.953
Slope (°) r= 0.5761
20 which influence water and nutrient availability and thus have a bearing on their floristic richness (Peco et al., 1998).
In 2014 seed bank trial, for the final vegetation cover, the results were expressed in terms of soil depth, given that some literature refers that soil physic-chemical properties differ at different depths and the existence of temporal and soil-depth relations is significant (Hirzel & Matus, 2013; Niemi et al., 2005; H. M. Wang et al., 2014).
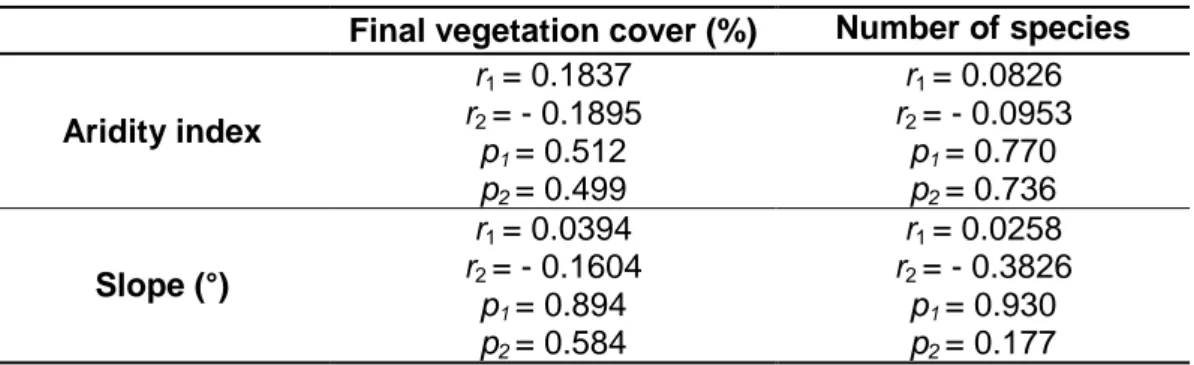
Table 5 - Pearson’s correlation coefficients, at p < 0.05, between final vegetation cover and number of species
with site characteristics for 2014 seed bank trial (1: surface; 2: depth).
Based on Table 5, it is possible to see that there is no significant correlation between the final vegetation cover and number of species of the seed bank trial with both aridity index and slope.
These last results (sections 3.2.1 and 3.2.2) indicate that the conditions of abundant and regular watering under which the soil samples were subjected in the greenhouse, despite their provenance from drier or wetter sites, largely determine seed bank performance. In fact, some studies have reported that the soil seed bank richness was higher in wetter years than in drier years (del Cacho et al., 2012). This means that, the seed bank potential is full. And if so, the greater the precipitation, the higher the seed germination, in whatever the location is. Thus, based on this study location, it is possible to assume that if it starts to rain abundantly in semi-arid Alentejo region (lower AI values), this will result in a behavior of biomass production similar to the one verified in other region that usually presents highest historical rainfall records. Given that aridity index is a long term climatic factor (calculated for 30 years), and considering the above conclusions, it seems that biomass production responds to the current water availability. And so, it is also possible to conclude that biomass production from the seed bank does not have a strong memory, referring to its climatic past history.
Final vegetation cover (%) Number of species Aridity index r1 = 0.1837 r2 = - 0.1895 r1 = 0.0826 r2 = - 0.0953 p1 = 0.512 p2 = 0.499 p1 = 0.770 p2 = 0.736 Slope (°) r1 = 0.0394 r2 = - 0.1604 r1 = 0.0258 r2 = - 0.3826 p1 = 0.894 p2 = 0.584 p1 = 0.930 p2 = 0.177
21
3.2.2.3. Average biomass production, final vegetation cover and
number of species at different depths
As Figure 10 shows, the surface soil samples present always a higher response result. This can be explained by the already mentioned assumption that surface layers have more available seeds than deepest layers where a higher amount of seed is buried. Also, these more ‘recent’ seeds on surface could have a higher viability than the buried ones (oldest), given that surface soil layers tend to have more organic matter, and nutrients available for plant growing.
A B
Figure 10 - Variations in average biomass production (A) vegetation cover (B) and number of species (C) in
seed bank samples, at different depths.
22
3.2.2.4. Flowering monitoring
Table 6 - Monitoring of first flowering date of Agrostis pourretii along the aridity index, at different depths.
AI Species (0-5 cm) F ebruar y Ma rch Ap ril May Species (5-10 cm) F ebruar y Ma rch Ap ril May 0.41 Agrostis pourretii Agrostis pourretii 0.42 0.45 0.46 0.48 X 0.51 0.52 X X 0.52 X 0.57 0.59 0.62 X 0.63 0.64 0.69 0.70 X
Table 7 - Monitoring of first flowering date of Brachypodium distachyon along the aridity index, at different depths.
AI Species (0-5 cm) F ebruar y Ma rch Ap ril May Species (5-10 cm) F ebruar y Ma rch Ap ril May 0.41 Brachypodium distachyon X Brachypodium distachyon X 0.42 X X 0.45 0.46 0.48 0.51 X 0.52 0.52 0.57 0.59 X 0.62 0.63 X X 0.64 0.69 X X 0.70
23 Table 8 - Monitoring of first flowering date of Gaudinia fragilis along the aridity index, at different depths.
AI Species (0-5 cm) F ebruar y Ma rch Ap ril May Species (5-10 cm) F ebruar y Ma rch Ap ril May 0.41 Gaudinia fragilis Gaudinia fragilis 0.42 0.45 0.46 0.48 0.51 0.52 0.52 0.57 0.59 X 0.62 0.63 0.64 X 0.69 0.70
Table 9 - Monitoring of first flowering date of Leontodon taraxacoides along the aridity index, at different depths.
AI Species (0-5 cm) F ebruar y Ma rch Ap ril May Species (5-10 cm) F ebruar y Ma rch Ap ril May 0.41 Leontodon taraxacoides X Leontodon taraxacoides X 0.42 X X 0.45 0.46 0.48 X 0.51 0.52 X 0.52 X 0.57 X 0.59 X X 0.62 0.63 0.64 X 0.69 X 0.70
24 Table 10 - Monitoring of first flowering date of Lolium rigidum along the aridity index, at different depths.
AI Species (0-5 cm) F ebruar y Ma rch Ap ril May Species (5-10 cm) F ebruar y Ma rch Ap ril May 0.41
Lolium rigidum Lolium rigidum
0.42 0.45 0.46 0.48 0.51 0.52 0.52 0.57 0.59 0.62 X 0.63 0.64 0.69 0.70
Table 11 - Monitoring of first flowering date of Tolpis barbata along the aridity index, at different depths.
AI Species (0-5 cm) F ebruar y Ma rch Ap ril May Species (5-10 cm) F ebruar y Ma rch Ap ril May 0.41
Tolpis barbata Tolpis barbata
0.42 X 0.45 X X 0.46 0.48 0.51 0.52 0.52 0.57 X X 0.59 0.62 0.63 0.64 0.69 X 0.70
25 Table 12 - Monitoring of first flowering date of Vulpia geniculata along the aridity index, at different depths.
AI Species (0-5 cm) F ebruar y Ma rch Ap ril May Species (5-10 cm) F ebruar y Ma rch Ap ril May 0.41 Vulpia geniculata Vulpia geniculata 0.42 0.45 X 0.46 X 0.48 0.51 0.52 X X 0.52 0.57 0.59 0.62 0.63 0.64 0.69 0.70
On the above tables (Table 6 to 12), the first flowering date of an individual in each one of the eight selected species is represented, along the aridity index, and at different depths (0-5 cm and 5-10 cm). From these results it is possible to see that for the same species, there are no significant differences in the flowering date of the individuals germinating from the seedbank from sites subjected to different aridity levels, both 0-5 cm and 5-10 cm soil depths. These results reinforce the previous conclusions on the absence of memory of the plant community germinating from the seedbank about the climatic history of the site where it comes from, in this turn regarding the phenology.
26
3.3. Greenhouse vegetation cover versus site vegetation
cover of 2014
Figure 11 represents the comparison between the final vegetation cover of the greenhouse and field trials, at different depths. It is observed that vegetation cover resulting from surface seedbanks remains higher, and also, that there is a positive correlation between the biomass cover in the field with the biomass cover in greenhouse, as shown in the table below (Table 13).
Table 13 - Pearson’s correlation coefficients, at p < 0.05, between final vegetation cover of both
greenhouse and field trial at different soil depths (1: surface; 2: depth).
Final vegetation cover in the greenhouse trial (%) Final vegetation cover in
the field trial (%)
r1 = 0.5995
r2 = 0.023
p1 = 0.5796
p2 = 0.030
Figure 11 - Greenhouse final vegetation cover versus field final vegetation cover at different depths.
(R1: surface determination coefficient; R2: depth determination coefficient).
R21 = 0.359 R22 = 0.336