MUTUAL FUND FLOW-PERFORMANCE RELATIONSHIP:
THE ROLE OF A FOREIGN PARENT
YUDA LI
Dissertation submitted as partial requirement for the conferral of Master in Finance
Supervisor:
Prof.
António Manuel Corte Real de Freitas Miguel
, ISCTE Business School, Department of Finance,I
Abstract:
In this paper we use a worldwide sample, including 31 countries, to test the influence of funds with a foreign parent on the flow-performance relationship. We study the reason behind the distinction in the way investors in different countries favor fund parents. We find that the flow-performance relationship is convex, consistent with previous studies using a worldwide sample. We also find that funds with foreign parents increase the convexity of fund flow to performance; in other words, investors buy more winners and sell less losers when funds have a foreign parent. The results also show that the enhanced convexity in funds with foreign parents is more pronounced in countries with less developed economies and financial markets, and where investors are less sophisticated.
Keywords: Mutual funds, Flow-performance relationship, Convexity, Fund with foreign parent, Investor sophistication
II
Resumo
Neste estudo, utilizamos uma amostra que inclui 31 países de diferentes regiões do mundo, para testar o impacto na relação fluxo-performance que decorre de um fundo de investimento ter um parente estrangeiro. Os nossos resultados confirmam que a relação fluxo-performance é convexa, consistente com estudos anteriores usando uma amostra semelhante. Também constatamos que os fundos com parentes estrangeiros apresentam uma maior convexidade; ou seja, os investidores investem mais em fundos com uma boa performance e vendem menos fundos com pior performance, sempre que existe um parente estrangeiro. Os resultados mostram ainda que a maior convexidade nos fundos com parentes estrangeiros é mais pronunciada em países com economias e mercados financeiros menos desenvolvidas e onde os investidores são menos sofisticados.
Palavras-chave: Fundos de investimento, Relação Fluxo-performance, Convexidade, Fundos com parentes estrangeiros, Sofisticação do investidor
III
Acknowledgements
I would like to thank ISCTE Business School for giving me a different academic experience from that of my home country. Moreover, I’m very grateful to my professor, António Freitas Miguel, for supervising my thesis, for his patient guidance and his academic and spiritual support. Finally, I want to thank my mother and father for always backing me up; I hope someday I will make them very proud.
IV Index of content Abstract: ... I Resumo ... II Acknowledgements ... III Index of content ... IV Index of figure and tables ... V
1. Introduction ... 1
2. Literature review... 4
3. Data and variables construction ... 16
3.1 Sample description ... 16
3.2 Construction of variables ... 20
3.2.1 Fund flow ... 20
3.2.2 Performance measurement ... 24
3.2.3 Additional mutual fund characteristic ... 26
4. Methodology ... 27
5. Empirical results ... 30
5.1 The impact of having a foreign parent on the flow-performance sensitivity ... 30
5.2 Foreign parent, flow-performance sensitivity and investor sophistication ... 38
6. Robustness ... 47
7. Conclusion ... 48
Appendix I: Variables definitions... 52
Appendix II: Robustness ... 54
V Index of figure and tables
Table 1. Number of funds and total net asset ... 18
Panel A. Number of funds and total net asset fund with foreign parent... 22
Table 2. Fund-level control variables ... 23
Panel A. Fund level variables averaged across fund quarter by country ... 23
Panel B. Pairwise correlation of fund-level variables ... 24
Table 3. The relationship of fund flow to performance across all countries, non-US, and US ... 35
Panel A. Measurement of flow-performance relationship using a linear approach .. 35
Panel B. Measurement of flow-performance relationship using two-piecewise approach... 36
Panel C. Measurement of flow-performance relationship using three-piecewise approach... 37
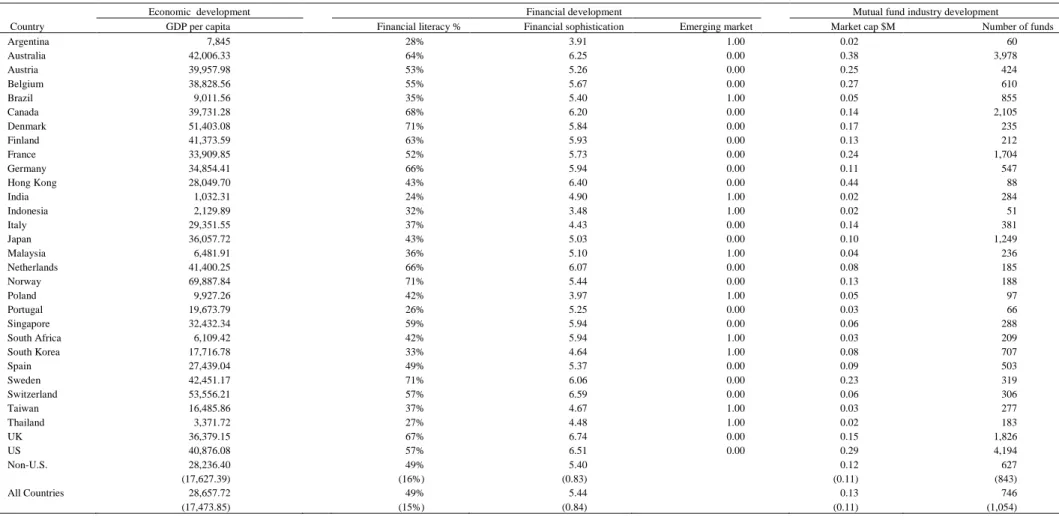
Table 4. Country level variables among all sample countries. ... 39
Table 5. The impact of the economic, financial market, and mutual fund industry development. ... 42
Panel A. Economic development measured by GDP per capita... 42
Panel B. Financial development measured by Financial literacy, Financial sophistication, and Emerging market. ... 43
Panel C. Mutual fund industry development measured by the mutual funds industry market capitalization and number of funds in mutual funds industry. ... 44
Table 6. The impact of the economic, financial market, and mutual fund industry development, using raw return as performance measure. ... 54
VI
Panel A. Economic development ... 54
Panel B. Financial development ... 55
Panel C. Mutual fund industry development. ... 56
Table7. The impact of the economic, financial market, and Mutual fund industry development, using one factor as a performance measure. ... 57
Panel A. Economic development ... 57
Panel B. Financial development ... 58
Panel C. Mutual fund industry development ... 59
Table 8. Using four factor alpha as performance measurement in different regression model to test flow-performance relationship ... 60
Panel A. linear regression model... 60
Panel B. Two-piecewise linear regression model ... 61
1
1. Introduction
In the last two decades, the role of mutual funds in the financial markets has increased considerably. The world's financial asset managed in the mutual fund industry has grown 400 percent from $6.1trillion in 1996 to $24.6 trillion in 2010 (European Fund and Asset Management Association (EFAMA) and the Investment Company Institute (ICI) 2010). The number of mutual funds also increased dramatically to 69,000 funds worldwide at the end of 2010 (27,754 equity funds). The US has the largest amount of financial assets invested in mutual funds around world. However, whereas the assets in the US doubled from 1996 to 2010, the growth in countries outside the US exceeded 400 percent which demonstrates the rapid rate of development of the mutual fund industry in other countries. Due to this rapid growth, the literature on mutual funds has increased significantly and many papers have addressed the subject of the mutual fund flow-performance relationship. Studies on the relationship between fund flow and performance go back nearly twenty years. The US market was the focus of most research in the early years not only due to rapid development of mutual funds there but also because of the large amount of assets invested in the mutual fund area. Chevalier and Ellison ,1997., Sirri and Tufano ,1998., and Huang, Wei, and Yan (2007) use US data to show a convex relationship between fund performance and flow which suggests investors tend to buy funds that perform well but fail to sell poorly performing funds. However, more recent research by Kim (2010), and Spiegel and Zhang (2013), for example, have shown a linear relationship between flows and performance. Ferreira, Keswani, Miguel, and Ramos (2012) use a worldwide sample to analyze the flow-performance relationship and find there is more convexity in less developed countries. In other words, investors in more developed countries tend to sell
2 more “loser” funds in terms of historical performance and buy fewer “winner” funds. Some papers dig deeper to study factors that can influence the sensitivity of flows to fund performance. For example, Sirri and Tufano (1998) and Huang, Wei, and Yan (2007) demonstrate the relationship between the fund participant fee and flow-performance sensitivity.
Our paper will follow previous studies by making a deeper analysis of the relationship between mutual fund flow and performance, using three different measurements of this relationship (linear, two-piecewise linear, and three-piecewise linear). Our main goal is to test whether the nationality of the fund parent influences how investors react to past performance, i.e., influence the flow-performance sensitivity. This study will fill a gap in the literature as, to our knowledge there are no studies addressing the role of fund parents on how investors react to past performance.
We will start by studying the effect of having a foreign parent on the flow-performance relationship and, our first hypothesis is that funds with a foreign parent are expected to have greater convexity on the flow-performance relationship.
Ferreira et al. (2012) have already demonstrated that, countries with less economic and financial development, and where the mutual fund industry is less developed, have greater mutual fund flow-performance convexity. In these countries, mutual fund investors are regarded as less sophisticated and buy more funds that perform well and react less to poor performers. We believe that in these countries, investors will regard mutual funds with a foreign parent as a stamp. An attribute that less sophisticated investors will value more. Having a foreign parent is, therefore expected to increase even more the convexity of the flow-performance relationship for these investors. This is our second hypothesis.
3 Like Ferreira et al. (2012), we use an international dataset, covering mutual funds from 31 countries around the world from the Lipper Hindsight database. Also consistent with Ferreira et al. (2012), we first find that the flow-performance relationship is convex. To test the hypothesis of the effect of foreign parents on the flow-performance relationship, we then interact fund’s past performance with a dummy variable that takes the value of one if the fund has a foreign parent and zero otherwise. The results show that having a foreign parent has an impact on how mutual fund investors react to past performance.
We then test the second hypothesis that investors from more developed countries invest less in fund with foreign parents, while those from less developed countries invest more. We follow Ferreira et al. (2012) using proxies for the financial, economic and mutual fund industry development to evaluate the reactions of investors from countries with different levels of development to funds with foreign parents. We find that the greater the level of economic, financial, and mutual fund industry development in a region, the less investor put their money in funds with foreign parents. We also show our results are robust by using a different performance measures including raw return, one factor alpha and four factors alpha and we obtain a similar results.
This paper makes different contributions to the mutual fund literature. First, we study the flow-performance relationship using a worldwide sample as not many studies use non-US data. Secondly, to the best of our knowledge we are the first to study the effect of fund parents on the flow-performance relationship. Our results suggest that funds with foreign parents enhance the convexity of fund flow to performance. Finally, we give more detailed country-level information to compare how investors from different countries, in which the
4 development of the economic, financial, and mutual fund industry varies, react to funds with a foreign parent.
The rest of the paper is structured as follows. The next section presents the literature review. Section 3 describes the dataset. Section 4 addresses methodology. Section 5 present empirical results. Section 6 shows robustness test. Section 7 concludes.
2. Literature review
There are many studies on the flow-performance relationship. Most research concludes that fund flow is highly dependent on the fund's performance; this suggests that good performers would attract more investors, and vice versa. More in-depth research has been conducted on the fund flow-performance relationship mainly from three aspects. Firstly, the specific shape of the fund flow and performance; for example, while some studies show that the flow-performance relationship is linear (e.g. Kim, 2010. Spiegel and Zhang, 2013),the vast majority, find that the flow-performance relationship is convex (e.g. Chevalier and Ellison ,1997),. Sirri and Tufano ,1998, and Huang, Wei, and Yan 2007). Secondly, research (e.g. Huang. Wei, and Yan. 2007 and Kempf and Ruenzi.2008) has examined certain fund characteristics, such as fund fee, family, size, family size, and age, that can influence the sensitivity of the fund flow to fund performance. Finally, the behavior of investors and fund managers has been tested by Ferreira et al. (2012), and Keswani, Miguel, and Ramos (2016), among others, to determine whether it will influence the sensitivity of fund flow to performance.
Our paper follows previous studies by investigating whether having a foreign parent impacts the fund flow to performance relationship, as there are very few papers in this area.
5 To glean a better understanding of previous studies and guide my research, the literature on mutual funds’ performance and the relationship between fund flow and performance is presented below. The selection of these two aspects is due firstly to the fact that few papers address the parent fund, but more focus on the fund family and the influence of the fund manager on the fund flow as this shed lights on how the mutual fund company runs its fund. Secondly, previous papers have also investigated fund performance persistence; for example, whether the funds continued performance is thanks to the fund manager's special skill to maintain it or whether it is just luck. When these topics are analyzed, Jensen's alpha is employed to measure fund performance and evaluate the fund manager's skill. We also use this in my research. Finally, the relationship of fund flow and performance can be influenced by factors such as fund size, fund family size, tax, etc. The above-mentioned factors are used as control variables in my regressions.
There is a large literature on mutual fund performance and on its determinants; including fund-level and country-level characteristics.
The paper by Chevalier and Ellison (1997) investigate the relationship between the equity funds’ flow and performance given the management fee. They used the semiparametric model to test the shape of the relationship of flow-performance with Morningstar data that include 3,306 fund-years observed from 1982 to 1992. They find there is no linear relationship between them but a convex shape. They also hypothesized that fund age can influence the sensitivity of fund flow to performance. They then show that the flow-performance relationship could act as an incentive for mutual fund managers or companies to change their risk-taking in portfolios. In particular, it is a stronger incentive to change risk-taking in young funds than in older funds. Finally, they show empirically the change in
6 the risk of the portfolio between September and December. They also test whether managers sell the bad performance funds before doing the year-end report to create a good performance fund portfolio as a possible reason for fund managers engaging in window dressing. However, no strong evidence finds to prove this.
Droms and Walker (2001) study whether the international mutual funds can perform well over a long period. They use the labels “winner”, “loser” and “gone” to define the higher or lower average relative performance of funds over a consecutive time period; they then run a z test and a chi-square test to determine significance. The data is collected from Morningstar database which includes 529 international mutual funds from 1977 to 1996. The results show that international mutual funds have performance persistence over a 1 year period and it is statistically significant; the persistence is then lost and they find no statistical significance to support continuous performance persistence over the years.
Guedj and Papastaikoudi (2003) investigate whether the performance of funds has an impact on the fund family. Firstly, they analyze the difference between the persistence of a fund's performance in the family and in the outside world and find that it will be more persistent in the family. On further analysis, they find that this is related to the unevenly allocated resources in the family; in other words, when a fund has a better performance than others in the family, they receive more support or resources from family and can therefore maintain a higher performance persistence in the family; the difference in the superior return between top ranking and bottom ranking funds can reach 58 basis points per month and 7.2% annually. This suggests that the fund family does not allocate its resources correctly but invest more in the better performing funds. However, this has a negative effect on investors who do not put their money in top ranking funds because their funds are not
7 given equal support; this will influence the funds' performance and ultimately result in the family suffering money outflow.
Massimo Massa (2003) explains that the competition between funds in the mutual funds industry not only depends on the funds’ performance, but also on the services provided by the families of the funds. He shows that as investors take some fees when buying or selling the funds that are in the different families, they will receive more fees if they trade their funds more frequently. However, if investors trade funds in the same family with a similar performance as other funds in the family, it will yield a lower transaction fee for investors. This will also attract more investors because an investor friendly fee policy makes the fund family more competitive. Finally, he shows that the performance of the mutual funds is negatively related to the degree of product differentiation of the category in which they are active; on the other hand, the degree of category proliferation is positively related to performance.
Research by Nanda, Wang and Zheng (2004) examine the mutual fund family's strategy. They first investigate whether some funds with a good rating in their family attract more money inflow than other funds in the same family. They find that there is more money inflow to families with star funds than those without a star. And money inflow is nearly three times more than in stand-alone star funds. They also show the return of funds is not related to the fund rating. They then address the strategy of the fund family. They analyze whether a fund family chooses to increase their fund stars to attract more money from investors; they use the portfolio to reveal that a fund family will adopt this strategy especially in bad performance families because they “find that factors that enhance the ex-ante odds of producing stars, in particular the cross-fund return standard deviation, are
8 associated with a significantly poorer family performance.” (Nanda,Wang and Zheng 2004, page 32). Finally, on comparing the investment ability of star families and non-star families, they find no evidence to show that a star family will have an abnormal performance.
Kempf and Ruenzi (2008) investigated the relationship between fund flow and the position in the fund family. They started by investigating whether the fund’s ranking in the fund family can affect their net-inflow. They find that a fund's ranking in the family will lead to a different net inflow; more specifically, if a fund has a top ranking in the family, it will receive approximately 7% more money inflow than lower ranking funds. They then show that when a fund changes from a low position to a top position in the fund family, it receives additional inflow. Finally, they demonstrate that the effect of this relationship is different in small and large families; the percentage of the fund’s net inflow is affected less in small families and the gap between the flow of large and small family is around 20%. Overall, the results show that fund managers not only face the problem of how to improve their funds’ performance, but also fierce competition to obtain a top ranking in the family; this suggests that the fund managers' risk-taking strategy will be influenced by the need for a good ranking in the family.
Busse, Goyal, Wahal. (2014) conduct research on the excessive return for both retail mutual funds and institutional products that invest in the global market. They first test the excessive return for retail funds by using the risk-adjusted return with a three and four factor model. After dividing the retail fund portfolio into equal-weighted and value-weighted portfolios, they find there is a positive alpha when testing with a three factor risk-adjusted return, but there is a negative alpha when using a four factor test; nevertheless,
9 none are statistically distinguishable from zero. They are therefore unable to find evidence for the excessive return produced by retail funds. Secondly, although they obtain a similar result when testing institutional products, the alphas in the equal-weighted funds are 0.25% per quarter higher than for the retail funds i.e. the alpha for the value-weighted institutional funds are more negative than for retail funds. They conduct a persistence test to explain the positive alpha and to find whether it is due to the fund manager's luck or to his/her ability to select securities. The result shows it is related to the fund manager's luck.
Reuter and Zitzewitz (2015) investigate the effect of the fund size on its performance. They hypothesized that the diseconomies of scale have an impact on the fund's future flow. They start by using regression discontinuity to test the diseconomies of scale in the mutual fund industry. They then use “the discrete changes in flows associated with discrete changes in Morningstar ratings to identify flows that should only impact fund returns through diseconomies of scale (Reuter and Zitzewitz 2015, page 27)”. They find that the exogenous flows are wider than cross-sectional by comparing the large and small funds, but this is because the fund manager managed large funds and not because of the manger's skill. They then use the diseconomies of scale to test the effect on the risk-adjusted return but find there is no statistical significance to show the relationship between the diseconomies of scale and fund performance.
The study by Hiraki, Liu and Wang (2015) examine whether concentrated mutual funds have a better performance than diversified funds. They used data from US based international mutual funds from 1993 to 2008. This was divided into country and industry level dimensions to compare the performance of concentrated funds and diversified funds at each level. They find that concentrated funds at both levels have a better performance than
10 diversified funds, with 0.16% and 0.30% each month respectively (Hiraki, Liu and Wang 2015). Furthermore, they also reveal that the difference of return of small sized concentrated funds at the industry level is more significant than of large funds. Finally, they find concentrated funds performed better than diversified funds mainly at the industry level; this suggests that the fund managers were able to gather more information about the industry funds, which fostered a superior performance.
Sirri and Tufano (1998) study the flow-performance relationship of equity mutual funds and the effects of costly studies, and marketing on fund flow. They use data on 690 US open-end equity funds from the Investment Company Data Institute (ICDI) from December 1971 to December 1990. They find that the shape of the relationship between fund flow and performance is convex; this means that investors will invest more when equity mutual funds have a high performance but. Faced with the opposite situation, they fail to withdraw their money. For the relationship between the total fee paid by investors and flow, they show that investors favor funds with lower fees and less risk. They find a 2.9 per cent increase in fund flow when fees decline 100 basis points. They also find that the investor's search cost will affect the mutual fund flow. Funds with a high search fee conduct more research on marketing than their competitors, and also have a stronger performance-flow relationship. These authors also study how advertising affects fund flow, but find no clear evidence to explain this.
Van Campenhout (1998) study whether aggregate fund flow will impact the stock market, or vice versa. They start by testing determinants of the aggregate equity fund, such as the long-term interest rate, fund performance and market return. They find that a negative relationship between long-term interest rate and aggregate fund flow. However, the fund
11 performance and market return measured by sharp ratio has a positive effect on the aggregate flows. But this is limited to the European market as they do not obtain the same result for the American market. They then investigate whether certain information from aggregated flows can predict the market return by using Granger causality tests. However, they find no evidence to support this, which means the market return cannot be predicted by aggregate equity fund flows.
Greene and Hodges (2002) investigate the dilution impact on the actively international fund flows in the short-term. Firstly, they use daily close-to-close data over 4 years for US-based international funds to replicate the return of the S&P500 to test the reason for the dilution of the funds. They find dilution is explained by the fact that the traders use a market timing strategy; that is, they use the time difference of the close of market between US and other regions to take advantage of sale prices to generate expected annualized returns of approximately 30%. They find a -0.48% impact of dilution, which is statistically significant. This means that traders using a market timing strategy have a bad effect on the passive fund shareholder; in other words, the passive fund shareholder will transfer their part of the return (nearly $420 million in 26 months) to the active traders who understand the best time to invest. They also show whether the policies of mutual funds companies, e.g. changing the trading time from daily to monthly, could lessen the diluted impact. However, these polices may just reduce the chance of the trader making a well-timed trade, and not decrease the impact of the dilution.
Berk and Green (2004) investigate the managers’ skill in the persistence of mutual funds. They develop a model which set a passive benchmark to test whether or not the manager of active open-end mutual funds have skills that lead to higher returns; it is assumed that
12 investors and mangers are equally informed and investors place their money according to the historical performance of the fund. They find that the manager cannot beat the benchmark. Furthermore, when investors put their money in good performance funds, they cannot predict whether or not the funds will earn the expected return and they are therefore also unable to predict the performance of the funds in the future; hence, the historical performance of the funds cannot reflect the ability of fund manager to obtain a high return. Finally, the authors conclude that investors invest in funds with a good empirical record, which is irrational.
Huang, Wei and Yan (2007) study the effect of participant costs on the flow-performance relationship of actively managed mutual funds. They develop a model to determine the different response to the mutual fund's flow-performance caused by the participant fee. They divide participant costs into the information cost, i.e. the cost of analyzing and gathering information of the target funds, and the transaction cost i.e. when investors want to buy or remediate fund shares. For the information cost, they find that the lower the information barrier for the mutual funds, i.e. with a lower participant cost, the more investors will invest in them even if they only have a moderate performance. They explain that, a lower participant cost will increase the fund inflow. However, at the high performance level, the participant cost has the reverse effect on the relationship between fund flow and performance.
Zhao (2008) study the flow of international retail equity funds. He showed some determents for international fund flow by comparing regionally diversified funds and regionally focused funds. He used the CRSP Survivor-Bias Free US Mutual Fund Database, setting quarterly data from 1992 to 2001 including 1,603 open-end international equity funds.
13 Firstly, he finds that investors choose international funds based on the diversification benefit. When comparing with regionally focused funds, larger regionally diversified funds have a better raw return and risk-adjusted return, and a lower risk. Secondly, he shows that funds that are less related with the US market have higher flows from investors; this is also linked to the diversification benefit. Findings show that investors tend to put their money in fund portfolios from different regions around the world. Finally, his conclusion for the relationship between flows and performance in international funds is the same for domestic funds; they are both convex-shaped for the raw return and risk-adjusted return. Buying the risk-adjusted return has a greater influence on international fund flow.
Ferreira, Keswani, Miguel, and Ramos (2012) study the relationship between fund flow and performance worldwide in open-end actively managed equity mutual funds. They use the Lipper Hindsight database in which “the sample consists of more than 16,000 open-ended and actively managed equity funds in 28 countries over 2001–2007”( Ferreira et al. 2012 page 2) to test whether there is a difference in the shape of flow-performance in these countries. They find that the shape of flow-performance of mutual funds in more developed counties is less convex; in other words, unlike America, investors tend to sell badly performing funds more and purchase funds with good performance less. They used the participant fee and investor sophistication to explain the difference. They show that investors in developed countries are able to obtain less asymmetric information and a lower transaction cost. As a result, the investor can make a more rational investment decision and is less influenced by fund companies’ advertising, which means they are not blindly chasing winners or and hesitantly selling losers. The authors also show that the flow-performance relationship has an impact on the fund managers' risk taking; they take more
14 risk in countries with less convexity or in less developed countries because they can gain more profit when funds have a good performance and lose less when the funds do not perform very well.
Bergstresser and Poterba (2012) study the effect of the after-tax return on the flow of mutual funds. They show that investors will receive less cash inflow when they pay more tax than those who pay less tax and when the pretax return is controlled. This suggests that the investor should focus more on the after tax return than the pretax. They then test for some cross-sectional variations (such as, turnover, manager style, etc.) in the tax effect on the fund flow, and find that the manager will impose more capital gains tax liabilities on their investors by realizing accrued capital gains. They also reveal the relationship between the tax burden and gross inflow; there is a statistically significant and negative relation between tax and net inflow.
Gelos (2013) study the behavior of investors in international mutual funds and the relationship between fund flow and market transparency, and he explains the reason for contagion. Firstly, he shows there has been a significant increase in international funds especially in some emerging markets which rose to US$289 million from 1997 to 2009. He then studies investor behavior and finds it is complex and cannot be regarded as a simple characteristic. For the relationship between capital flow and market transparency, he finds evidence to confirm that the more transparent and protected a mutual fund company is, the more flow it obtains and the less asymmetric information international investors receive. Crisis contagion is explained by the mechanism of portfolio rebalancing, namely “the investors transmit idiosyncratic shocks from one market to others by rebalancing their
15 portfolios’ exposures to common macroeconomic risks”,(Kodres and Pritsker,2002, page 7) . Gelos also shows the importance of overlooking big investors’ risk exposure.
Kumar, Niessen-Ruenzi and Spalt (2015) investigate whether fund flow can be influenced by the name of the fund manager using American data. They find that the annual flow of funds that have a manager with a foreign name is nearly 10 per cent lower than in funds whose manager has a native name, even when the fund's performance is the same. They also show that managers with a foreign name will suffer more penalties when their funds perform badly, and gain less when their funds perform well. They make a further analysis of the effect of the region of origin of the fund manager's name and show a greater outflow of funds when the manager's name is associated to areas of terrorist attacks, namely the Middle-East and South-Asia. They conclude there is social discrimination in the mutual funds industry in America, when investors select their mutual funds manager.
Keswani et al. (2016) examine how the culture in different countries impacts the sensitivity of flow-performance and flow-fee in their countries’ mutual funds. While some studies have examined the difference in the sensitivity of countries, as opposed to analyzing distinctions caused by the development of the country and the quality of the institution, these authors are the first to use culture to determine the difference by applying Hofstede's five cultural dimensions: uncertainty avoidance, individualism, power distance, masculinity and long-term orientation as the measurement. They reveal that the culture in different countries has a positive and significant relationship on the fund manager's risk-taking, and it can help them obtain a good performance from their funds. They also find that culture increases the flow to fee sensitivity, which means fund managers will charge lower fees in order to prevent outflow from their funds.
16
3. Data and variables construction
3.1 Sample description
We use open-ended actively managed equity mutual funds for the period 1998 to 2010 as the mutual fund data. Data is from the Lipper Hindsight database which collects data directly from fund management companies. The database includes active and defunct funds and, therefore, it is regarded as survivorship bias free. Following Ferreira et al (2012), multiple share classes are excluded to avoid counting funds twice; even when listed as speared funds in Lipper, they have hold same fund, the same manager, and the same return before expense and loads. The initial sample includes 47,961 equity funds investing both domestically and internationally.
To confirm that the Lipper Hindsight dataset covers enough mutual fund data, the Investment Company Institution (ICI) is used to identify the difference in aggregate statistics from 46 countries with the Lipper Hindsight dataset. The results obtained are the similar to those in Keswani et al (2016); the Lipper Hindsight database reports 26,861 equity funds, while the ICI records 27,754 funds, of which the Lipper database account for 97%. For the total net asset (TNA) of equity funds in US dollars, the Lipper Hindsight database presents 88% of total net assets for the ICI recording. The TNA are $9 trillion and $10.2 trillion respectively.
Some additional restrictions are added for the final sample. Firstly, close-ended funds, indexing-tracking funds, offshore funds, exchange trade funds, and funds-of-funds are excluded, because the paper focuses mainly on open-ended actively managed equity mutual funds. Secondly, the fund size is calculated using quarterly data, and the return is calculated using monthly data. At least 24 monthly observations of fund returns are necessary to
17 obtain enough observations to compute the adjust return, which represents the risk-adjusted fund performance. Third, the number of funds per quarter in each country is also restricted because the accuracy of the result will increase as the number of funds added to the sample increases and, hence, a minimum of 10 funds is required. Fourth, the funds observed should have data on size, family size, age, total expense ratio, and loads (front-end and back-(front-end loads), and the origin of the fund family so as to determine the parent fund's nationality. Finally, the number of the final sample is 16,120 open-ended actively managed equity funds from 1998 to 2010. This period includes the rise in the stock market observed across countries in 2003 and 2009 and the global financial crisis 2008, and thus represents the stock market in the both bull and bear periods. In my view, the data can be used to analyze the equity mutual fund flow and performance relationship and the influence of funds with foreign parents to the sensitivity of the fund flow-performance relationship and the effect on both fund-level and country-level characteristics.
Table1 shows the number of funds and TNA (Total Net Assets) for domestic and international funds at the end of 2010. Columns two and three present the total number of funds and TNA in each country.
18
Table 1. Number of funds and total net asset
Panel A. Number of funds and total net asset for all sample($M: Millions of dollars)
All Funds Domestic funds International funds
Country Number TNA ($M) Number Number (% of All) TNA ($M) TNA (% of All) Number TNA ($M)
Argentina 46 304 17 37% 156 51% 29 148 Australia 683 103,838 372 54% 51,902 50% 311 51,936 Austria 153 14,244 12 8% 1,428 10% 141 12,816 Belgium 422 24,547 14 3% 1,406 6% 408 23,141 Brazil 430 35,407 387 90% 28,073 79% 43 7,334 Canada 998 317,255 392 39% 188,174 59% 606 129,081 Denmark 193 29,637 21 11% 3,115 11% 172 26,523 Finland 167 26,824 29 17% 5,342 20% 138 21,481 France 944 187,927 198 21% 41,651 22% 746 146,275 Germany 286 118,676 46 16% 34,568 29% 240 84,109 Hong Kong 59 13,689 6 10% 1,893 14% 53 11,796 India 212 35,735 212 100% 35,735 100% Indonesia 40 4,332 40 100% 4,332 100% Italy 141 32,799 31 22% 4,510 14% 110 28,289 Japan 658 70,901 391 59% 33,451 47% 267 37,449 Malaysia 176 9,985 117 66% 7,062 71% 59 2,923 Netherlands 94 31,318 22 23% 6,035 19% 72 25,283 Norway 139 38,471 51 37% 13,234 34% 88 25,237 Poland 55 6,692 37 67% 5,736 86% 18 957 Portugal 63 2,337 18 29% 506 22% 45 1,831 Singapore 121 12,702 9 7% 1,522 12% 112 11,180 South Africa 130 22,789 111 85% 21,155 93% 19 1,635 South Korea 449 35,814 313 70% 19,979 56% 136 15,835 Spain 268 13,188 71 26% 2,447 19% 197 10,741 Sweden 251 111,707 103 41% 63,077 56% 148 48,631 Switzerland 172 28,131 53 31% 13,439 48% 119 14,693 Taiwan 228 17,189 155 68% 10,615 62% 73 6,574 Thailand 160 6,070 141 88% 5,760 95% 19 310 UK 874 427,504 365 42% 201,651 47% 509 225,854 US 1,826 3,100,104 1,388 76% 2,186,530 71% 438 913,574 Non-U.S. 8,612 1,780,014 3,734 43% 807,954 45% 4,878 972,061 All countries 10,438 4,880,118 5,122 49% 2,994,484 61% 5,316 1,885,635
The Table 1, Panel A shows that the US has the largest number of mutual funds and TNA in our sample, more specifically, 1826 funds and $3,100,104 total net assets respectively; it is followed by France and the UK. In contrast, Indonesia has the fewest mutual funds (40) and Argentina has the lowest TNA $304. We then divided the whole sample of funds into Domestic funds and International funds in line with the funds' geographic investment styles. Lipper Hindsight dataset has already classified the funds' geographic investment styles to
19 domestic, foreign country, regional and globe funds. However, I reduce these to two categories: domestic funds that invest in the local country, and international funds that invested in a different country or region. Table 1 shows that the more developed countries have more international funds; for example, France, Canada, and UK have 746, 606, and 509 funds respectively and this accounts for half of the funds in their country. Meanwhile, some less developed countries are more focused on the local market; for example, India and Indonesia have no international funds. On the other hand, domestic funds in the US account for 76% of all US funds. The US also has the most domestic funds, which account for 27% of domestic funds in all countries. As for TNA, the US also dominates the TNA of domestic and international funds, accounting for 76% and 48% respectively.
Table 1, Panel B is similar to table 1 Panel A but for funds with foreign parent. More specifically, we present the total number of funds with foreign parent and then domestic and international funds with foreign parents.
As we see in the second column, the UK has the largest number of funds with foreign parents accounting for 11.8% in our sample, and Canada, France and Japan also have a large number of funds with foreign parents, namely 11.1%, 9%, and 7.9% respectively. Italy has the smallest number; just 6 funds have foreign parents. The funds with foreign parents that invest in the domestic market in Brazil account for 91% of the total with foreign parents; Brazil also has the most funds with foreign parents in the whole sample (11.9%). In South Korea, 73% of funds invest in their country. India and Indonesia have the smallest number of funds investing in the international market; they also have the lowest TNA as they have no international fund. France represents 13% of the total number of
20 international funds with foreign parents, while South Africa accounts for just 0.12%. As for the TNA, even the US has only 5% funds with a foreign parent in the all countries sample However, it has the second biggest TNA and represents 24.5% of the total TNA. The UK accounts for 28.7% of .TNA, dominating our sample: In contrast, Portugal has the lowest TNA, representing just 0.03% of the total TNA. The TNA of domestic and international funds with foreign parents have a similar ranking in our country list. UK and US held the majority of TNA from our sample. Both can reach up to 60% per cent of the TNA of all domestic funds and 45% of international funds. Meanwhile, UK funds tend to invest in other countries, while the US funds tend to invest locally. Canada is in the third position, representing 11.7% and 11.3% respectively. The lowest TNA of domestic funds and international funds is in Argentina, which accounts for 0.021% and 0.023% of all TNA, respectively.
3.2 Construction of variables
We start by describing and constructing all the variables included in our regressions. This includes fund flow, in section 3.2.1, fund performance measures, in section3.2.2, and control variables in section 3.2.3.
3.2.1 Fund flow
Fund flow is the dependent variable in my regression; it reflects the inflow or outflow of money from investors to the fund. Following the paper by Sirri and Tufano (1998), fund flow can be calculated by getting the difference in total assets under management at the end of each quarter; a rise or fall in assets is accepted by the external injection of money except
21 for dividends and capital gains. In order to prevent extreme values influencing our result, we winsorize fund flows by country at the bottom and top 1% level of the distribution. Fund flow for fund i in country c at quarter t is calculated as:
Flowi,c,t =TNAi,c,t−TNATNAi,c,t−1(1+Ri,c,t)
i,c,t−1 (1)
TNAi,c,t is the total net asset value in the local currency of fund i in country c at the end of
quarter t. Ri,c,t is fund i’s net raw return from country c in quarter t.
Table 2, Panel A, presents fund-level characteristics averaged across fund quarter by country, and averaged across non-US and all funds in our sample. Standard deviations are presented in parenthesis.1 Table 2, Panel B, shows the pairwise correlation matrix between fund-level variables.
We can see from Table 2, Panel A, that Poland and Indonesia have the highest average quarterly fund flow, while South Korea and Japan have the lowest.
1
22
Panel B. Number of funds and total net asset fund with foreign parent
All funds with foreign parent Domestic funds with foreign parents International funds with foreign parents
Country Number Number (% of all ) TNA($M) TNA (% of all) Number TNA ($M) Number TNA($M)
Argentina 22 48% 165 54% 5 83 17 82 Australia 219 32% 30,398 29% 109 15,475 110 14,923 Austria 57 37% 4,468 31% 5 685 52 3,783 Belgium 115 27% 4,593 19% 5 563 110 4,030 Brazil 162 38% 13,143 37% 148 12,166 14 977 Canada 312 31% 86,288 27% 117 46,124 195 40,164 Denmark 34 18% 6,650 22% 7 1,094 27 5,557 Finland 86 51% 20,228 75% 16 4,128 70 16,100 France 268 28% 48,459 26% 56 11,745 212 36,715 Germany 44 15% 5,662 5% 10 2,610 34 3,053 Hong Kong 43 73% 11,883 87% 3 1,531 40 10,352 India 59 28% 12,884 36% 59 12,884 Indonesia 14 35% 3,523 81% 14 3,523 Italy 6 4% 871 3% 2 183 4 688 Japan 223 34% 26,467 37% 110 9,490 113 16,976 Malaysia 21 12% 338 3% 13 181 8 158 Netherlands 30 32% 10,522 34% 7 2,004 23 8,518 Norway 35 25% 5,194 14% 21 4,439 14 755 Poland 36 65% 4,286 64% 26 3,797 10 490 Portugal 13 21% 285 12% 5 178 8 107 Singapore 77 64% 9,965 78% 7 1,357 70 8,608 South Africa 13 10% 3,875 17% 11 2,840 2 1,035 South Korea 134 30% 6,016 17% 98 3,350 36 2,666 Spain 45 17% 2,145 16% 20 599 25 1,546 Sweden 57 23% 18,223 16% 22 8,358 35 9,865 Switzerland 16 9% 906 3% 4 431 12 475 Taiwan 118 52% 10,935 64% 69 5,327 49 5,608 Thailand 58 36% 866 14% 47 661 11 205 UK 331 38% 214,542 50% 125 99,992 206 114,550 US 155 8% 183,111 6% 99 136,227 56 46,884 Non-US 2,648 31% 563,781 32% 1,141 255,797 1,507 307,984 All countries 2,803 27% 746,892 15% 1,240 392,024 1,563 354,868
23
Table 2. Fund-level control variables
Panel A. Fund level variables averaged across fund quarter by country
Country Number Raw return(%) One-factor alpha(%) Four-factor alpha(%) TNA ($M) TNA family ($M) Flows (%) Age (year) Fees(%) SMB(%) HML(%) Countries fund sold
Argentina 583 4.93 -0.76 -0.58 7.95 53.03 1.27 7.85 3.56 -0.24 -0.03 1.00 Australia 12,268 0.48 0.69 0.99 148.40 5,833.95 -0.39 8.53 1.89 -0.11 -0.07 1.13 Austria 4,745 1.22 -0.47 -0.37 87.93 1,498.26 0.06 9.74 2.37 0.10 -0.05 2.52 Belgium 10,142 1.10 -0.62 -0.53 72.35 13,365.59 -2.68 7.37 1.82 -0.02 -0.06 3.07 Brazil 4,506 3.65 2.38 2.41 85.07 3,890.62 0.22 7.83 2.13 0.13 -0.17 1.00 Canada 27,091 1.20 0.19 0.15 268.92 10,964.54 1.48 11.08 2.93 0.15 0.04 1.00 Denmark 5,305 2.13 0.08 0.66 119.31 1,799.91 1.47 10.56 1.91 0.00 -0.14 1.93 Finland 4,162 2.24 0.27 0.75 119.22 2,437.78 3.04 7.61 1.93 0.10 -0.03 1.57 France 36,364 0.63 -0.71 -0.68 171.85 6,037.43 0.49 11.63 2.08 0.12 -0.03 1.35 Germany 12,922 0.46 -0.95 -0.56 324.39 12,493.50 -2.15 13.41 2.07 0.02 -0.08 1.89 Hong Kong 1,375 2.50 0.86 1.54 168.17 3,331.07 1.15 15.09 2.43 0.09 -0.15 3.24 India 4,080 7.35 2.30 2.07 110.17 1,503.85 0.77 7.50 1.44 -0.42 0.36 1.45 Indonesia 536 7.21 1.86 1.13 82.63 196.42 6.70 8.10 2.21 -0.20 0.10 1.05 Italy 10,171 -0.08 -0.96 -0.31 275.11 4,657.63 -2.12 9.52 2.47 -0.06 -0.11 1.01 Japan 21,286 1.17 -0.72 -0.88 79.09 7,936.49 -4.03 8.65 1.93 0.10 0.00 1.00 Malaysia 3,621 2.76 0.85 -0.39 42.55 709.03 -2.14 10.64 2.52 0.01 0.50 1.09 Netherlands 3,898 1.07 -0.76 -0.16 286.75 3,049.66 -0.46 12.13 1.39 0.01 -0.12 1.26 Norway 4,685 2.69 0.80 0.86 142.68 2,051.46 0.89 10.00 1.99 0.17 0.01 1.56 Poland 946 2.27 -0.73 -1.02 137.67 425.90 7.78 6.93 4.11 -0.54 0.00 1.00 Portugal 1,751 0.79 -0.65 -0.45 51.81 378.81 -0.20 9.38 2.22 0.15 -0.13 1.09 Singapore 4,266 2.17 0.31 0.84 47.03 740.69 -0.74 9.05 2.64 0.05 -0.10 1.25 South Africa 1,846 3.53 1.10 1.23 136.78 1,339.14 1.19 9.13 1.89 -0.35 -0.11 1.00 South Korea 8,032 4.58 -1.26 0.20 54.28 2,258.38 -10.66 5.64 1.63 0.16 -0.53 1.00 Spain 10,019 0.85 -1.01 -0.72 64.97 1,511.93 -0.27 8.71 2.19 -0.15 -0.03 1.02 Sweden 8,400 1.97 0.25 1.71 313.22 10,617.85 1.30 12.10 1.53 -0.06 -0.22 1.42 Switzerland 5,649 1.12 -0.14 -0.20 190.29 7,929.00 -1.11 14.70 2.22 0.05 -0.02 1.47 Taiwan 6,019 2.83 -1.11 -0.71 56.43 738.65 -1.15 9.15 3.12 0.27 0.01 1.01 Thailand 3,197 5.25 1.96 0.82 17.93 279.50 -2.29 8.28 1.57 -0.27 0.22 1.00 UK 30,277 1.59 -0.16 -0.17 397.19 8,558.14 0.41 15.70 2.13 0.22 -0.04 2.01 US 90,626 1.73 -0.01 0.23 1,465.32 60,623.41 0.71 13.68 1.77 0.06 -0.06 1.05 Non-U.S. 248,142 2.40 0.10 0.26 140.01 4,020.28 -0.08 9.86 2.22 -0.02 -0.03 1.43 (1.91) (1.06) (0.95) (101.47) (4,030.68) (3.20) (2.51) (0.61) (0.20) (0.18) (0.61) All Countries 338,768 2.38 0.10 0.26 184.18 5,907.05 -0.05 9.99 2.20 -0.01 -0.03 1.41 (1.88) (1.04) (0.93) (261.70) (11,067.22) (3.15) (2.57) (0.60) (0.19) (0.17) (0.61)
24
Panel B. Pairwise correlation of fund-level variables
1 2 3 4 5 6 7 8 9 10 11 Raw return 1 One-factor alpha 0.44 1 Four-factor alpha 0.35 0.81 1 TNA 0.03 0.04 0.04 1 TNA family 0.01 0.02 0.02 0.55 1 Flows 0.07 0.07 0.05 0.10 0.02 1 Age -0.01 0.01 -0.01 0.37 0.20 -0.03 1 Fee -0.01 -0.01 -0.01 -0.14 -0.10 0.01 -0.04 1 SMB -0.01 0.03 -0.01 -0.01 -0.03 0.01 0.00 0.07 1 HML 0.02 0.01 -0.16 0.01 -0.02 0.02 0.05 0.02 0.00 1
Countries funds sold 0.01 0.01 0.01 0.11 0.09 0.02 0.07 0.03 -0.01 -0.01 1
3.2.2 Performance measurement
Following Ferreira et al. (2012), fund performance is measured using raw returns and adjusted returns. Raw returns are gross of taxes and net of total expense. The risk-adjusted returns are computed by Jensen’s alpha and four-factor alpha model (Carhart 1997). Jensen’s alpha is the value that evaluates whether the fund manager can realize the abnormal return or not, and is given by:
∂j= Rit− [Rft + βitM∗ (RMt− Rf)] (2)
Where alpha j is the difference between the realized return and the return with predict return measured by estimated Beta. Rit is the realized returns of fund i in time t and t-1.
The Rft is the return of the risk free rate in time t, which is computed by using average
interbank rates for each country. For the US, we use the US T-bill rate from the Federal Reserve. Rmt is the excess return for each country or region’s market.
There are two different ways of computing the Jensen alpha for domestic and international funds: for domestic funds, we regress the previous 36 months of funds’ excess return per quarter in their domestic market. The Jensen’s alpha is obtained by
25 comparing this with the realized return in the same quarter. The Jensen alpha is calculated in the same way for international funds in the region market where the fund invests in, as defined by Lipper geographic focus field. Similar to Following Ferreira et al. (2012), we divide the geographic focus into four regions (Europe, Asia–Pacific, North America, Emerging Markets). We proceed similarly for global funds, i.e., funds investing all over the world, for which we use a global market factor.
Calculating the four factor alpha is the same as for Jensen’s alpha for domestic and international funds. It adds factors of size, value, and momentum to the regression, given by:
Rit = ∂j+ β0iRMt+ β1SMBt+ β2HMLt+ β3MOMt+ ϵ1t (3)
where alpha J and RMt have the same meaning as in the equation of Jensen’s alpha;
SMBt is the average return on three small portfolios minus the average return on three
large portfolios; HMLt is the average return on two value portfolios minus the average
return on two growth portfolios; MOMt is the return of portfolio with the past 12-month
winner minus the return of the portfolio with the past 12-month loser (Ferreira et al. 2012).
Fund performance measures are including in Table 2, Panel A. India, Indonesia, Thailand have the highest average raw return, namely 7.5%, 7.21% and 5.25%, while Italy has the lowest raw return -0.08%. As for risk-adjusted performance, Brazil is the country with highest one-factor alpha 2.38% followed India and Taiwan with 2.30%, 1.96% respectively. However Italy also has the lowest raw return -0.95%. As for the four-factor alpha to measure the return, we can see the Brazil dominate the highest return which is 2.41 percent, while the Poland has lowest return is -1.02%.
26
3.2.3 Additional mutual fund characteristic
According to past academic research, there are some additional fund characteristics that can determinate the flow-performance relationship. These are regarded as control variables. Fund size is measured by using total net asset, and it will affect fund flow, see, i.e., Chevalier and Ellison (1997), Sirri and Tufano (1998), Brennan and Hughes (1991), and Jonathan and Zitzewitz (2015). The size of the fund family, measured by the total net assets of the fund family, also impacts fund performance; a large family benefits from being able to obtain information and having more experience to create a new fund with low cost, so they can earn more money inflow from their investors (Chen, Hong, Huang and Kubik, 2004, and Khorana and Servaes, 1999). Ferreira et al. (2012) find that there is a negative relationship between fund age and in non-US countries; it is therefore also added to my regression. It is sometimes argued that fund fee influences fund flow. Whereas Chen et al. (2004) find that fees do not affect fund flow, Huang et al (2007), Sirri and Tufano (1998) find that fees have a negative impact on fund flow. We also include a dummy variable that is equal to one if the fund is foreign and zero otherwise, primarily to control for the fact that investors may direct their money more or less to a fund depending on whether it invests primarily in domestic or foreign markets. The number of countries where the fund is sold might also impact the flow as stated by Ferreira et al. (2012). Finally, the style of the fund also influences the fund flow, and is measured by the loadings on SMB and HML (see, i.e., Ferreira et al., 2012, and Keswani, et al, 2016).
Table 2 Panel A shows the different countries’ fund-level control variables. The fund size in the US is larger than in other countries, reaching 1,465.32 million dollars, followed by the UK, German, and Sweden with 397.19, 324.38, and 313.22 million dollars respectively. They also have a large family size; although Belgium does not have
27 a large fund size, but has the second largest family size in the sample. As can be seen in the table, more developed countries, such as the UK, US, Japan, France, and Netherlands, have older funds and lower fees. In countries like Argentina, Poland, and Malaysia mutual funds charge higher fees. As for the funds’ nationality, Austria and Belgium have more international funds, while the US and Brazil is the countries with more domestic funds.
Table 2 Panel B, shows the pairwise correlation matrix between fund-level variables. From the table we can see that the variables are not strongly correlated with each other meaning that that these control variables can be included together in the flow-performance regressions.
4. Methodology
We start by using a linear approach in order to test the flow-performance relationship. In each country-quarter fund performance is ranked using last year fund performance. Fund performance is measured using raw-returns and one and four-factor alphas. We then regress fund flows on past performance rank together with the control variables presented in Section 3. Because the US is by far the country with the highest number of funds and TNA, we compute the flow-performance relationship for all countries in our sample, for non-US countries, and for the US just by itself.
Equation 4, below represents the linear regression in which we regress flows on fund past performance rank:
Flowi,c,t=a+bi,c*performance ranki,c,t-1+ci,c*dummy foreign parenti,c,t-1+
28 Where i is the fund, c is the fund’s responding country, while t is the time period. All regressions include time and country fixed effects and p-values are heteroskedasticity-robust and clustered by country. To test how having a foreign parent impacts on the level of flows, we also include the dummy variable foreign parent. Finally, because our main goal is to test whether the nationality of the fund parent influences how investors react to past performance, i.e., influence the flow-performance sensitivity, we add to equation 5 the interaction between past performance rank and the dummy variable foreign parent.
Flowi,c,t=a+bi,c*performance ranki,c,t-1+ci,c*dummy foreign parenti,c,t-1+
di,c*perforamcee ranki,c,t-1*dummy foreign parenti,c,t-1 +
ei,c*control variablesi,c,t-1+ε2,t (5)
Following Keswani et al. (2016), prior year’s performance rank is measured using raw returns, one-factor alpha, and four-factor alpha. We therefore rerun each of the three previous equations (3, 4, and 5) for the three performance measures
Because the literature has shown flow-performance sensitivity to be no linear, we also rerun the same regressions using a two-piecewise linear, and three-piecewise linear aproach. The goal is to test the impact of the flow-performance sensitivity at different levels of performance (Chevalier and Ellison, 1997; Sirri and Tufano, 1998 and Ferreira, et al. 2012)
For the two-piecewise linear approach, we start by dividing the performance into the lowest quintile (low) and the top quintile (high) by ranking the return of the funds from the past year ranging from zero (lowest performance) to one (top performance) for each quarter and in each country. The rank is assigned to the funds based on the past year's
29 performance (Ferreira et al. 2012). The slopes are first estimated separately using a two-piecewise specification for the bottom half (Low), and the top half (High), we rerun equations 4 and 5 in which we replace performance with the bottom half (Low), and the top half (High):
Flowi,c,t=a+bi,c*performance ranki,c,t-1+ci,c*dummy foreign parenti,c,t-1+
di,c*control variabli,c,t-1+ε2,t (6)
By interacting past performance with the foreign parent dummy:
Flowi,c,t=a+bi,c*performance ranki,c,t-1+ci,c*dummy foreign parenti,c,t-1+ dI,c*perforamcee rankI,c,t-1*dummy foreign parentI,c,t-1+
ei,c*control variablesi,c,t-1+ε2,t (7)
Finally, we proceed likewise for the three-piecewise approach. The only difference is that we also add the middle part to the third quintiles to rank the performance of the fund, using the same method as before; different slopes are computed for different quintiles. We now have the bottom quintile (LOW), middle quintile (MID) and top quintile (HIGH):
Flowi,c,t=a+bi,c*performance ranki,c,t-1+ci,c*dummy foreign parenti,c,t-1 + di,c*control variablesi,c,t-1+ε2,t (8)
We test the impact of the foreign parent on the flow-performance sensitivity by interacting past performance with the foreign parent dummy:
30 Flowi,c,t=a+bi,c*performance ranki,c,t-1+ci,c*dummy foreign parenti,c,t-1+
di,c*perforamcee ranki,c,t-1*dummy foreign parenti,c,t-1+
ei,c*control variablesi,c,t-1+ε2,t (9)
After running equation (6) to equation (9) and we also run a Wald test in which we test the shape of the flow-performance relationship, namely we test for convexity by examining whether the difference in the slopes between the low and high part of the regression function is statistically significant (see, i.e., Ferreira et al, 2012).
The empirical results of running the regressions presented in this Section are presented in Section 5.
5. Empirical results
In this section we present the result that we showed from Table 3 Panel A to Panel C. In section 5.1, we start by to explain the foreign parents’ effects on fund flow-performance sensitivity. Section 5.2 presents the results when we include country level variables and analyze whether investor sophistication explain differences in the flow-performance sensitivity to funds with foreign parents.
5.1 The impact of having a foreign parent on the flow-performance sensitivity
In this section, we present the results of all the regressions presented in section 5. Table 3, Panels A, B, and C, present the results using the linear, the two-piecewise and the three-piecewise approaches, respectively. As mentioned in the previous section, fund and the three-piecewise approaches, respectively. As mentioned in the previous section, fund performance is measured by 3 different ways, we will shows the regression result
31 when use raw return and one factor alpha to measure performance in the Table 3 Panel A to Panel C. The way of four factor alpha, we will shows in the Appendix III Table 8 Panel A to Panel C.
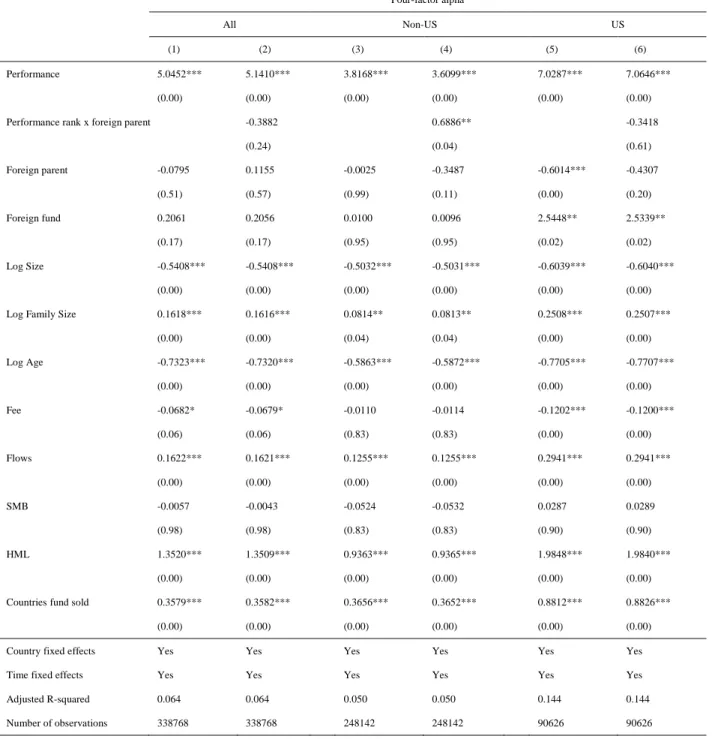
Table 3 Panel A, shows the first regression testing for the flow-performance relationship using a linear approach. Across different specifications and samples, and whatever performance measure we use, we find that fund performance rank is positively related with flows, suggesting that investors will put more money into better performing funds, and vice versa. The foreign parent dummy is only statistically significant for the US (columns 5 and 11), where funds with a foreign parent get significantly less flows. Outside the US (columns (3 and 9)) having a foreign parent has no statistically significant impact in the level of flows on how investors invest their money. The same happens when we run the regressions including all countries in our sample.
We run the regression in equation (5) where we interact fund performance rank with the foreign parent dummy. The results are presented in even columns and show that in non-US countries mutual fund investors react more to past performance when mutual funds have a foreign parent. The results are particularly strong when performance measure is measured using one and four factors alpha. For US funds, the interaction of fund performance rank with the foreign parent dummy is never statically significant.
As for other explanatory variables for the fund-flow relationship, most are in line with previous research. The coefficient of the fund nationality has a positive impact on the fund flow and is only significant for the US, consistent with the results of Dorm and Walker (2001). As in Ferreira et al. (2012), fund size is positively related to flows outside the US and negatively related in the US. Fund family size is positively correlated with fund flow and the data is not significant for the Non-US area. As in Ferreira et al. (2012) for the natural log of fund age, all coefficients are negative,
32 indicating that a young fund will attract more money inflow from investors, and they are statistically significant. Our results are consistent with previous studies in relation to the fund fee, which has a negative relationship with fund-flow (Sirri and Tufano, 1998 and Huang, Wei and Yan. 2007). Finally, the number of countries in which the fund is sold has a positive effect on fund flow and is statistically significant. This means that the higher the number of countries in which the fund is sold, the more money it will attract. Table 3 Panel B, presents the results using the two-piecewise linear approach. Performance is ranked for the bottom fifty and top fifty rank performers, according to equation (6 and 7) Table 3, Panel B, presents the results using the two-piecewise linear approach.
The results in columns (1, 3, and 7) are in line with previous studies showing that fund performance and flow do not have a linear relationship (Chevalier and Ellison,1995, Gruber ,1996, and Sirri and Tufano,1998). If there was a linear relationship, funds would have the same sensitivity to fund performance across the performance rank; in other words, whether the performance of the fund is good or bad, investors would buy or sell the fund with the same intensity. However, the results in all columns show that fund flow reacts differently when the fund performance is different. This is the case when using any of the three performance measures included in our study. When we compare the coefficient of low and high performance funds, the coefficient of the low performance fund is always lower than the high performance fund, regardless of the region or method of measuring the fund return, and both are statistically and economically significant. This suggests that investors pursue more funds with a good historical performance, and sell less funds that perform poorly. The results of running the Wald test confirm that the differences on low and high performance coefficients are statistically significant. This is consistent the convex flow-performance relationship
33 documented in different studies, including Sirri and Tufano (1998) and Ferreira et al. (2012).
When we analyze the effect of a foreign parent on the convexity of the flow-performance relationship, focusing primarily on the differences between non-US countries and the US, the results show that, outside the US, having a foreign parent increases the sensitivity to past performance.
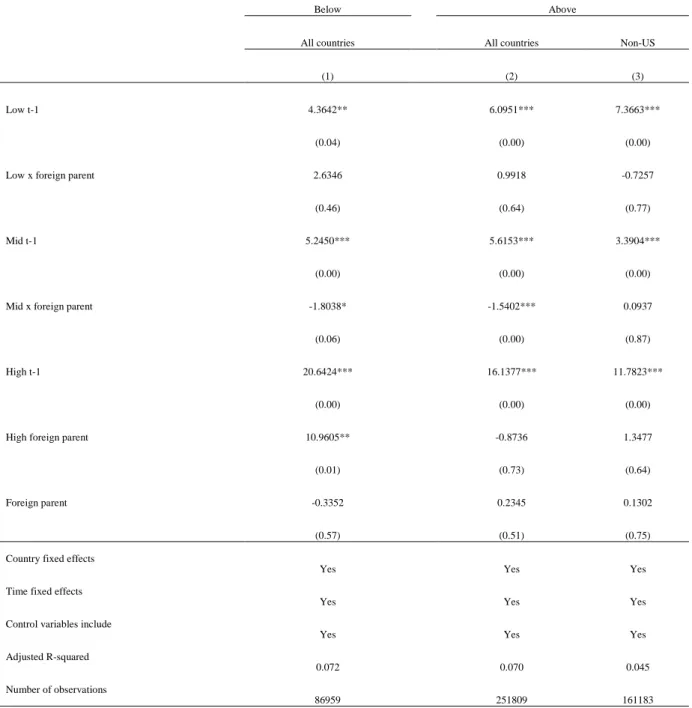
Table 3 Panel C, presents the results using the three-piecewise linear approach. For the three-piece linear regression analysis, the mid quartile is added and this provides more detailed information to see the investor' reaction to the fund’ past performance. We therefore rank performance for the bottom twenty, middle sixty and top twenty percentiles of the performance rank (see equation 8 and 9)
We start by documenting the convexity of the flow-performance relationship as in Sirri and Tufano (1998) and Ferreira et al. (2012). Similarly to our previous results using a two-piece linear regression, all Columns show that investors buy winners with a much higher intensity that they sell losers.
The results show that, when we pool all countries in our sample, in columns (2), (8), and (12) the impact of having a foreign parent is not statically significant. Our results also show, in columns (4), and (10) , that, outside the US, having a foreign parent influence the relationship between fund flow and performance. More particularly, we can see that, in non-US countries, funds with a foreign parent increase the level of convexity in the flow-performance relationship. This either because investors tend to buy more winners, when performance is measured using raw returns, or because investors sell poor performers with less intensity, in the case when performance is measured using one-factor alpha. For four one-factor alpha to measure fund performance shows in the appendix III Table 8 Panel C the results are not statistically significant, indicating that for the