School of Economics and Management
TECHNICAL UNIVERSITY OF USBON
QUALITY OF BUYER-SELLER RELATIONSHIPS FROM A VALUE
CREATION PERSPECTIVE
Rados/av Skapa
Masaryk University, Czech Republic
Eva Kubatova
Masaryk University, Czech Republic
Abstract
The economic performance of a company does not depend on the company itself, but on its relationships to other subjects and the ability to create value from such relationships. A paradigm shift in management towards a network perspective goes hand in hand with a new understanding of value and the value"creation process. In our article we try to identify direct and indirect ways of how value is created in relationships. We also analyse two different kinds of relationships to prove that relationships which stimulate the further development of companies create value more indirectly than relationships which just support the economic stability of companies.
Keywords: Buyer-Seller Relationships, Desk Research, Value and Value Creation.
1. INTRODUCTION
No company owns all the resources necessary for production and for pleasing the needs of customers. Companies are dependent on resources, which are bought from suppliers. Therefore companies need to enter business relationships with other organizations. Examples of typical resources, which are the objects of relationships, are the following (Ford eta/., 2003):
Correspondence Address:Radoslav Skapa- Masaryk University, Brno 602 00, Czech Republic. E-mail: [email protected]
PORTUGUESE JOURNAL OF MANAGEMENT STUDIES, VOL. XIV, NO. 2, 2009
• Operation resources like production, logistic background, which are complementary to own resources;
• Technology or know-how in design;
• Relationships of partner companies to other organisations owning valuable resources.
Business co-operations (i.e., relationships) create value for both parties- for the buyer as well as the seller. The terms of value and utility, which brings the value, are basic keywords in economics. A general definition considers value to be a part of a trade-off between 'get' and 'give' components (Zeithaml, 1988). Intuitive understanding of such a general definition is flawless; however, problems occur when we try to apply such a definition to real business relationships among companies and try to identify the forms of value. Surprisingly, we learn that value can be created by almost any aspect of co-operation. Economic theory started to elaborate the concept of value rather late, in the 90s. The new theories and concepts like Michael Porter's Value Chain, Supply Chain Management or Social Network Theory (Granovetter, 1985) were the incentive for progress in the understanding of value. These management tendencies placed more emphasis on inter-organizational co-operation than on just a single company. As such, economic performance does not depend on a focal company only, but on the relationships to other subjects and on bought resources too. The paradigm shift towards the network perspective goes hand in hand with this new understanding of value and the value-creation process (Kubatova, 2005). Several approaches can be found in the literature. The functionalistic branch is represented by the works of Ford and McDowell (1999) or Mi:iller and Ti:irrenen (2003).
Both teams elaborated value from the supplier's perspective. The model that we utilize in our research was suggested by Walter eta/. (2001) and it belongs to the same category of functionalistic approaches. The authors distinguish between direct and indirect functions of customer relationships. They argue that direct functions have an immediate effect on the partner firms while indirect functions are supposed to have an oblique effect on the partners, because their relationship is directly or indirectly connected to other relationships (Walter eta/., 2001). The direct functions of customer relationships include the activities and resources of the supplier firm and customer firm that may create value to the supplier without being dependent upon other (associated) relationships (Walter et at., 2001). The indirect functions are related to the evolvement of the supplier to a broader network of relationships. In other words, the existence of particular buyer-seller relationship affects other relationships that the seller takes part in, and therefore it creates (a different kind of) value as well. Indirect functions are difficult to identify in terms of their cost and benefits. Indirect functions are expressed in different parts of the relationship network, which the seller takes part in and which the seller builds
around him. Direct functions consist of profit, volume and safeguard (sub-) functions (Walter eta/., 2001 ):
• Profit function: Concerns the ability of customer relationships to generate profit to seller. However, not all the customers can or should bring profit; • Volume function: The benefit of customer relationship need not to be in
profit generation, but in achieving economy of scale for the seller. A company can accept an order to utilize its capacity better or to get a volume discount price of raw material for instance;
• Safeguard function: In an economic depression or high market volatility, a company can accept orders which might not be profitable. However they can lower overall losses and therefore safeguard the cost-efficiency of the supplier.
Indirect functions can by divided as follows:
• Innovation function: Customer relationship can lead to a product or process innovation. Such co"operation can "improve the value of the supplier's offerings to this customer in the future as well as to other customers" (Walter eta/., 2001);
• Market function: A supplier can utilize existing customer relationships as a reference. In particular, references of well-know companies can "open the door" to new customers or even to new markets;
• Scout function: The customer, as the one of market players, might have better and more up-to-date knowledge about market tendencies than a supplier. The supplier can learn useful marketing information by means of the existing co-operation;
• Access function: To enter a new market and operate business there, companies have to come into contact with official authorities, chambers, banks or trade associations. "Customers' experience in dealing with such actors can be of considerable help for a supplier to reduce time- and money-consuming licensing procedures, business negotiations. As such customer relationships can also fulfill an access function" (Walter eta/., 2001).
PORTUGUESE JOURNAL OF MANAGEMENT STUDIES, VOL. XIV, NO. 2, 2009
of a supplier in his own innovation activities. A supplier can mediate contact to partners in his business network. This is a way the customer can approach actors who were unknown or unavailable for him". Based on a literatur!'! review about value creation, Klapalova (2007) concludes that the model of Walter eta/. (2001) "as well as the conclusions drawn upon this model has been a unique attempt to elaborate the value of business relationships so far. The authors limited their research to examples of the defined functions because their intention was just to show the way for further exploration. That's why they did not take into the account the influence of dysfunctions in relationships on value creation". It is the absence of further research in the field of value creation that has inspired us in our study.
2. RESEARCH AIMS
We decided to test the Walter model (Walter eta/., 2001) using data about 152 relationships from companies located in South Moravia in the Czech Republic. Formally, the first aim of our research is defined as follows: To verify the existence of direct and indirect functions of customer relationships as defined by Walter et a/. (2001), by means of data from the Czech environment. Walter eta/. (2001) also developed a framework to classify buyer-seller relationships that depends on the different kinds of value the relationship provides. They grouped relationships according to dimensions, direct value-creating functions and indirect value-creating functions, as depicted in Figure 1.
FIGURE 1
Classifying Value Creation through Customer Relationships
d.> High
~ 1)0 ~
~ :§ .Q +-> row t:l
u ... c
~ u .2 Low
0
selling relationships
low-performing relationships
Low
high-performing relationships
networking relationships
High
Indirect value-creating functions
Source: Walter, Ritter and Gemunden (2001)
but provides impulses and resources for company growth. We suppose that relationships described by companies as "supporting stability" will mainly fulfill direct functions. By contrast, relationships stimulating further development will focus more on indirect functions because they bring value in the longer term. This idea is illustrated in Figure 2.
FIGURE 2
Classifying Value Creation through Customer Relationships
d.> High
~ b.O ~
~ :§ .Q t> ~ al
u
0 § Low0
'+-Source: authors
relationships
\
supporting the
relationships stability
stimulating development
Low High
Indirect va I ue-creati ng functions
Thus, the second aim of our research is to compare the functions that are fulfilled by relationships supporting stability and relationships stimulating development. A working hypothesis is that relationships that stimulate further development of a company will create value in the field of innovations, mediation of information and contacts (i.e., in indirect functions). This hypothesis can be deemed substantiated on the basis of the following propositions:
• Relationships are dynamic in nature, changing in time (Holmlund, 2004), thus dimensions of potential value creation differ in accordance with the life cycle stage;
• A study by Eggert
et at.
(2006) confirms that relationship life cycle is a mode-rating variable concerning value creation within a relationship. This means that the relationship value changes in keeping with the relationship duration; • The relationship typology we use - relationships supporting stability andrelationships stimulating development- can differ not only with regard to the nature of the relationship, but also with regard to the life cycle stage, although this is not primarily intended.
PORTUGUESE JOURNAL OF MANAGEMENT STUDIES, VOL. XIV, NO. 2, 2009
we should bear in mind that the relationships stimulating development tend to represent the initiative phase of the relationship life cycle, and relationships supporting stability tend to represent further consequential phases of the life cycle. If we accept the connection of relationship typology and relationship life cycle, the proposed hypotheses can be considered well founded.
3. RESEARCH METHODOLOGY
Our desk research analyzes data collected for the purpose of a research project called "The Potentials of Industry Clustering in the Region of South Moravia", funded by the Czech Science Foundation. This research project was based on survey data of about 152 long-term company relationships in terms of aims, history and results of each particular relationship (Halek, 2007). Even though the questionnaire for collecting data was built for a different purpose and not for the verification of the Walter model, it is possible to use the data in this way. The questionnaire consisted of more than one hundred variables describing the contents of customer relationships precisely. Two or more variables can be matched to each function of Walter's model, except the scout function. Hence our analysis tests six out of seven proposed functions of a relationship. The fact that our research is based on secondary data causes other limitations to our findings. (We shall return to this point later.) As we explained above, we have not used the same variables (that is questions for respondents) as Walter eta/. (2001). However, we believe our variables are valid for measuring the six functions of Walter's model. Their list and assignment to functions is presented in Table 1. All variables were measured on a scale of 1 to 5 (from strongly disagree to strongly agree). Respondents of the survey were the top managers of companies and therefore their answers present subjective estimations. The variables of "Return on Assets" and "Return on Equity" were hard data calculated from the data in the annual reports of the companies.
The value of the relationship itself was traced by a question (x5) asking about the importance of a long-term co-operation with another company. The answer was measured on a scale of 1 to 4. This variable expresses a company representative's subjective opinion about the value that the relationship has created. We attempted to validate suitability of utilization of this subjective variable as the relationship value indicator. Our questionnaire also contained a question on the financial value of long-term co-operation, i.e. on the volume of co-operation in CZK (x4). If the relation between the subjective variable "importance of long-term co-operation" and the variable "relative financial value of co-operation" is direct and strong enough, then we consider the variable x5 to be suitable for further analysis. Relative financial value of co-operation is expressed as a quotient of two variables. The numerator is the volume of co-operation in CZK per year (x4). The denominators used individually
x? x220 x222 x?O x75 x73 x87 x67 x76 x78 x83 x86 x72 x82 x88 x80 x84 x85
TABLE 1
Variables Used in the Model
Profit function
The effect of relationship on profit of your company
ROA- Return on Assets ROE- Return on Equity
Volume function
The relationship led to higher turnover of your company
The relationship led to better utilization of production ca pactty
Safeguard function
The relationship led to retention of employee in key posttions
The relationship improved position of your company among competitors
Innovation function
The relationship led to higher specialisation of our company
The relationship led to modernisation of your products
The relationship led to new production practice and technology
The relationship led to exchange of knowledge and expertise with the partner company The relationship led to improvement in customer service
Market function
The relationship led to increase of your market share
The relationship led to extension of your customers
The relationship helped to penetrate to new markets
Access function
The relationship improved the access to financial resources
The relationship led to exchange of knowledge and expertise with universities
The relationship improved position of your company towards government and municipaltties.
for calculation are EBIT, operations revenues, gross profit on operations and total assets. The results of correlation analysis proved a strong relation between listed variables (in the case of operations revenue as denominator, the Spearman's rho
PORTUGUESE JOURNAL OF MANAGEMENT STUDIES, VOL. XIV, NO. 2, 2009
with respect to its complex pattern, especially in comparison with the relative financial indicator. The authors of the original model tested the linkages by means of structural modeling and each of the functions was computed in factor analysis. The character of our data does not allow us to apply the same techniques. The main burden is that some functions are measured by two variables only. We rely on a less sophisticated way of analysis; we use Spearman's rank correlations between variables describing functions and the variable measuring value of relationship (i.e.,
x5). Calculated correlations are seen as reliable if the statistical significance of the estimated correlations is at 95% (p-value is lower than 0.05). Let us point out that we have chosen a rather strict criterion, because sometimes even 10% of estimated error is accepted in soft data analysis. The existence of correlation between value of relationship (variable x5 - importance of long-term relationship) and at least one variable measuring the function is the proof of existence of particular function. Each function is defined by Walter et at. (2001) quite generally and covers a broad variety of possibilities. That is why we accept a correlation with any of the variables measuring the function to be sufficient proof of the existence of the function.
4. RESULTS
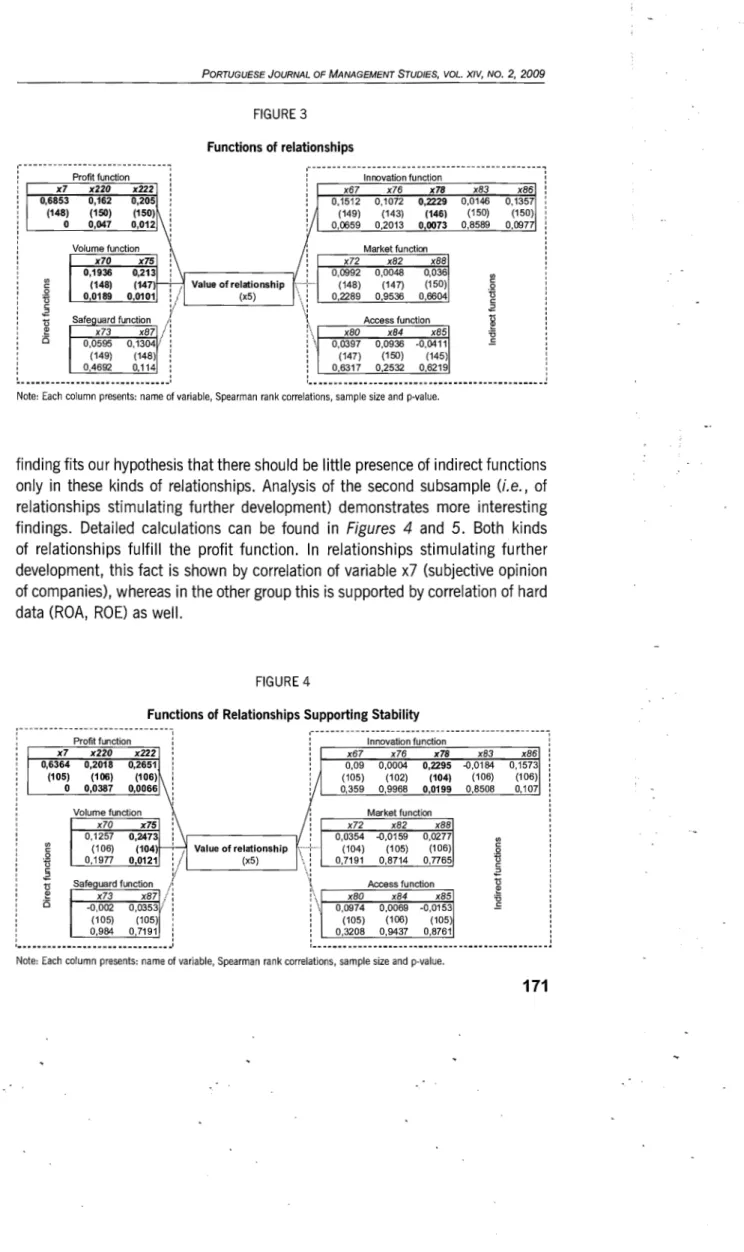
Results referring to the first aim are presented in Figure 3. Our calculations show that there is a link between value of relationships and direct functions, namely a link to profit function and volume function. With regard to indirect functions we identified a link to the innovation function only; to its component "new production procedures and technology". If we accept a lower statistical reliability (0,066% error), we can also add correlation of value and innovation leading to "higher specialization of our company" (x67). To our surprise the data did not prove a link to x83 - "the relationship led to exchange of knowledge and expertise with the partner company". We can only speculate if this is caused by the formulation of the question, which asked about mutual exchange and not about "give" and "get" separately. We are forced to conclude that our data did not prove the existence of all six functions as defined by Klapalova (2007). However, there is no reason to believe that every relationship has to fulfill all its functions. Therefore we decided to repeat the analysis, but this time on two separate subsamples, to fulfill second aim. Our variable x8 identified the character of each particular relationship: whether the relationship was seen as a support of stability for a company or stimuli for its further development. The majority of the relationships were classified as "supporting stability of the company", namely 75%.
The results calculated for relationships supporting the stability of companies are very similar to our first calculations. This is of no surprise because- as stated above- 75% of the overall sample consists of relationships of this category. This
FIGURE 3
Functions of relationships
Profit function ' Innovation function
x7 x220 x222 : x67 x76 x78
0,6853 0,162 0,205 : 0,1512 0,1072 0,2229
(148) (150) (150) :
0 O,M,
0,0,~
(149) (143) (146)
U>
<::
0
n <::
0,0659 0,2013 0,0073
Volume function , Market function
x70 x75
!
x72 x82 xBB0,1936 0,213 : 0,0992 0,0048 0,036
(148) (147) ; / Value of relationship f< .. T ... (148) (147) (150)
0,2289 0,9536 0,6604
0,0189 0,0101 , , (x5) , ,
r./ \I
sf a eguar d f x73 0,0595 (149) 0,4692 unction x87 0,1304/ (148) 0,114 •'
l
• •. r---=-c-.:...:Ac;::::c:::ces;::::s7fu:::no:;:cl::::io::..:n--:-.;, xBO x84 x85! · ..
1-o::-,:::o3::;,9::,.7 --:o:--,. o="'9C:::36::----::_o-::. 04c:-1~1: (147) (150) (145)
' 0,6317 0,2532 0,6219
'
x83 x86
0,0146 0,1357
(150) (150)
0,8589 0,0977
U> <:: 0 ii <:: "
--
..--
....---
...--
..--
...-
...-·
·-
...---
..--
....--
---
...--
....-
...-
...----
..-
...-Note: Each column presents: name of variable, Spearman rank correlations, sample size and p-value.
finding fits our hypothesis that there should be little presence of indirect functions only in these kinds of relationships. Analysis of the second subsample (i.e., of relationships stimulating further development) demonstrates more interesting findings. Detailed calculations can be found in Figures 4 and 5. Both kinds of relationships fulfill the profit function. In relationships stimulating further development, this fact is shown by correlation of variable x7 (subjective opinion of companies), whereas in the other group this is supported by correlation of hard data (ROA, ROE) as well.
FIGURE 4
Functions of Relationships Supporting Stability
Profit function Innovation function
x7 x220 x222 :
: x67 x76 x78
0,6364 0,2018 0,2651 0,09 0,0004 0,2295
''"l
S!:! •.
~~:1 ~
J
(105)(102) (104)
0,359 0,9968 0,0199
' I
Volume function Market function
x70 x75 : x72 x82 xBB
0,1257 0,2473 : 0,0354 -0,0159 0,0277
U>
(1 06) (104) ; / Value of relationship \··r (104) (105) (106)
<::
0
0,7191 0,8714 0,7765
t5 0,1977 0,0121 , _, (x5) ; ,
<:: •/ \•
s a eguar df ~
x73 -0,002 (105) 0,984 unct1on x87 0,0353/ ,.'r ' I ' (105)
0,7191 ' '
'
...
--
...-
..-
...-
...-
...-
.... -·.. ',J
:.. .---::-::--'-A::::cc:..::e.=ss7f.=unc..::cc:::tio:.cn'--= ; \ 1--::-::':x':':;B~O --:;;-;f;x;:;,B4i:---;;-;f.;x8~5
: \ 0,0974 0,0069 -0,0153
: (105) (106) (105)
0,3208 0,9437 0,8761
Note: Each column presents: name of variable, Spearman rank correlations, sample size and p-value.
x83 x86
-0,0184 0,1573
(106) (106)
0,8508 0,107
PORTUGUESE JOURNAL OF MANAGEMENT STUDIES, VOL. XIV, NO. 2, 2009
FIGURE 5
Functions of Relationships Supporting Further Development
---1
Profit function I Innovation function
x7 x220 x222 ' x67 x76 x78
0,785 0,0686 0,0778 ' I 0,3587 0,3239 0,1912
(33) (34) (34) I (34) (32) (32)
0 0,6936 0.6547 0,0393 0,0713 0,287
Volume function Market function
x70 x75 x72 x82 x88
0,551 0,308 0,4142 0,1926 0,1656
<I)
(33) (33) Value of relationship (34) (34) (34)
<::: 0
0,0018 0,0814 (x5) 0,0173 0,2685 0,3416
t5
<:::
.2
u Safeguard function Access function
~ x73 x87 I xBO x84 x85
0 0,4063 0,1958
I 0,0493 0,3996 -0,3169
(34) (34) (32) (34) (30)
0,0196 0,2606 I 0,7837 0,0217 0,0879
x83 0.1805 (34) 0,2998 <I) <::: 0 t5 <::: .2 u ~ '0 .!: x86 0,1812 (34) 0,298 ' I ~- ...
---
... .-
...-
....----
...-
....--
..---
..-
..-
...---
....-
..-
....-
..----
..Note: Each column presents: name of variable, Spearman rank correlations, sample size and p-value.
Again, volume function was observed in both groups; however, there were differences in the way the volume function was fulfilled. Relationships supporting stability led to better utilization of production capacities (to cost savings de facto). Conversely, the value of relationships stimulating further development can be seen in the growth of turnover (the expansion). The safeguard function is fulfilled by relationships stimulating further development in the way that such a relationship helps to retain the employees in key positions. The innovation function is fulfilled by both kinds of relationships, albeit in different ways. While the relationships supporting the stability of companies are connected to the implementation of new production practices and technologies, the relationships stimulating further development increase companies' specialization. If we accept a lower certainty (probability of error 7.1 %), we can add that such a relationship also leads to product innovations. The market function was identified in relationships stimulating further development only (correlation of variable x72 -increase of market share); however, we have to point out that this statement is quite weak due to the fact that variable x72 only gives evidence about market function indirectly. The second contradictory fact is that there is no correlation of variables x82 (increase in number of customers) as well as x88 (entering new markets), which should logically be in accord with x72. The last function was the access function, which was identified in relationships stimulating further development only. There is quite a strong relationship between value and exchange of knowledge and expertise with universities (x84). The result for variable x85 triggers several questions about the relationships of companies and government in the Czech Republic. Despite lower reliability, this negative correlation suggests that narrower co-operations between
companies are not perceived positively by government and municipalities; on the contrary; narrower co-operations can cause trouble for companies.
In light of these results we conclude that we have achieved both aims and our findings support our working hypothesis. Both kinds of relationships (supporting the stability of companies and stimulating further development) fulfill different functions as previously illustrated.
5. LIMITATIONS AND CONCLUSIONS
Before we discuss the final conclusion it is necessary to account for limitations caused by the data and the statistical instruments. First, the value and effects (i.e., functions) of relationships are described by one representative of each company. Despite this single subjective opinion, the data are not distorted. Nevertheless, we are dealing with relationships. For this reason to get more reliable data we would need to know the opinion of a partner company about the relationship. Next, the secondary data did not contain enough information so that we could measure all the proposed functions with sufficient accuracy. Thus, we had to set aside completely analysis of the scout function because there was no variable describing this function. The findings concerning the market function are similarly limited. Finally, due to the data, we were unable to apply a more sophisticated statistical approach in our analysis. Despite these weaker sides to our research, we succeeded in describing value derived from inter-company co-operations. We identified three partial functions, which were fulfilled by co-operations (relationships) described in our data. In fact we can characterize the relationships of companies in our sample as focusing more on direct (profit and volume) functions than on indirect functions. This finding complements our second analysis. In terms of quality, there were two general types of co-operation: relationships supporting stability in companies and relationships stimulating their further development. The first one was predominant in our sample; therefore, conclusions about this group are similar to findings about the whole sample. But relationships stimulating further development differed statistically. In accordance with our hypothesis, such relationships fulfill more indirect functions. The analysis based on Walter's model allowed us to make distinction between two kinds of relationships from the value and value creation perspective. In other words, we have learned more about managers' notions of what a relationship of a higher level (i.e., relationship) which leads to further development of companies- not only to better stability- is. This indicates the kinds of value they expect from relationships leading to progress.
PORTUGUESE JOURNAL OF MANAGEMENT STUDIES, VOL. XIV, NO. 2, 2009
relationships fulfill more than one function at the same time and some functions are interdependent. Our distinction (relationships supporting stability for companies versus relationships stimulating further development) is rather rough. The original Walter model of four kinds of relationships suffers from the same problem. Thus, a more elaborate model could start with the precise definition of direct and indirect functions so that the contents of each function would be clearer. In the next step, the model should be extended to include the customer's perspective, and the functions would be classified within three groups: functions specific to the supplier, functions specific to the customer, and functions exploitable by both sides. In our opinion, this is one way to make the terms of value and value creation, which have only been used vaguely so far, more precise. There is a potential for further research inspired by the study of Eggert eta/. (2006). We intend to investigate the representation of individual dimensions of relationship value based on Walter's model (i.e. from the supplier perspective) especially in relation to the relationship life cycle.
References
Eggert, A., Ulaga, W. and Schultz, F. (2006). Value Creation in the Relationship Life Cycle: A Quasi-Longitudinal Analysis. Industrial Marketing Management; Vol. 35 (1), 20-27.
Ford, D., Gadde, L. E., Hfkansson, H. and Snehota, I. (2003). Managing Business Relationships. John Wiley & Sons: Chichester.
Ford, F. and Mcdowell, R. (1999). Managing Business Relationships by Analyzing the Effects and Value of Different Actions. Industrial Marketing Management, Vol. 28.
Granovetter, M. (1985). Economic Action and Social Structure: The Problem of Embededness. American Journal of Sociology, 91, 481-510.
Halek, 1., Smutny, P., Skapa, R., Kubatova E. and Zak, J. (2007). Potencialy Klastrovatelnosti Odvetvi v Uzemi Jiznf Moravy Ill. Vyvojove Tendence Podniku Iff, Vol. II, 468-546.
Holmlund, M. (2004). Analyzing Business Relationships and Distinguishing Different Interaction Levels. Industrial Marketing Management, Vol. 33, 279-287.
Klapalova, A. (2007). Vliv e-Business na Tvorbu Hodnoty v Retezcfch a Sftfch. PhD Dissertation, Masarykova Univerzita, Brno.
Kubatova, E. (2005). Analyza Dodavatelskych Vztahu v Kontextu lnovacf. Working Paper 1, CVKSCE MU, Brno, 1-30.
Moiler, K. and Torrenen, P. (2003). Business Suppliers' Value Creation Potential: A Capability-Based Analysis. Industrial Marketing Management; Vol. 32, 109-118.
Walter, A., Ritter, T. and GemOnden, H. G. (2001). Value-Creation in Buyer-Seller Relationships: Theoretical Considerations and Empirical Results form Supplier's Perspective. Industrial Marketing Management, Vol. 30, 365-377.
Zeithaml, V.A. (1998). Consumer Perception of Price, Quality and Value: A Means-End Model and Synthesis of Evidence. Journal of Marketing, Vol. 52, 2-22.
Resumo
0 desempenho econ6mico de uma empresa nao depende da empresa em si, mas das diferentes relac;6es que ela estabelece e da sua capacidade de criar valor a partir de tais relac;6es. Uma mudanc;a de paradigma na gestao, orientada para a uma rede de relac;6es globalizada, anda de maos dadas com uma nova compreensao do conceito de valor e do processo de criac;ao de valor. Neste artigo, vamos tentar identificar as formas directas e indirectas de criar valor nos relacionamentos entre agentes. Vamos tam-bern analisar do is tipos diferentes de relacionamento, com o intuito de provar que os relacionamentos que estimulam o desenvolvimento criam, indirectamente, mais valor do que os relacionamentos que apenas se apoiam na estabilidade econ6mica das empresas.