NORMS FOR THE DIAGNOSIS AND RECOMMENDATION
INTEGRATED SYSTEM FOR SIGNAL GRASS
Cristiane Prezotto Silveira1; Gilmar Ribeiro Nachtigall1,2; Francisco Antonio Monteiro3*
1
USP/ESALQ - Programa de Pós-Graduação em Solos e Nutrição de Plantas.XC V
2
Embrapa Uva e Vinho, C.P. 130 - 95700-000 - Bento Gonçalves, RS - Brasil.
3
USP/ESALQ - Depto. de Solos e Nutrição de Plantas, C.P. 9 - 13418-900 - Piracicaba, SP - Brasil. *Corresponding author <[email protected]>
ABSTRACT: The Diagnosis and Recommendation Integrated System (DRIS) has been proved efficient as a method for nutritional diagnosis in several crops. However there is a lack of information on the use of DRIS for tropical forage grass. The aim of this paper was to establish norms for interpretation of results of analysis from recently expanded leaf laminae of Brachiaria decumbens Stapf. (Signal grass), through the DRIS method. To establish DRIS norms, concentrations of N, P, K, Ca, Mg, S, Cu, Fe, Mn, and Zn and the relative production obtained in six experiments conducted in greenhouse using nutrient solution and silica as substrate were considered. DRIS indices were calculated using two criteria in order to choose the ratio order of nutrients: F value - ratio of variance for the relationships among nutrients between the reference group and the low productivity group; and R value - correlation coefficients between the productivity values and the relationship among the pairs of nutrients, and three forms of calculation for the functions of nutrients (methods of Beaufils, of Jones, and of Elwali & Gascho). The two criteria to choose the ratio order of nutrients selected different ratios between pairs of nutrients; the nutrient concentrations were positively and significantly correlated with the respective DRIS indices, except for N; and DRIS norms are useful for the nutritional diagnosis of the ten studied nutrients in leaf laminae of Signal grass.
Key words: Brachiaria decumbens, DRIS norms, foliar diagnosis
NORMAS PARA O SISTEMA INTEGRADO DE DIAGNOSE E
RECOMENDAÇÃO PARA O CAPIM-BRAQUIÁRIA
RESUMO: O Sistema Integrado de Diagnose e Recomendação (DRIS) tem se mostrado eficiente como método para diagnóstico nutricional em diversas culturas, mas para gramíneas forrageiras tropicais há nítida falta de informações. Este trabalho objetivou interpretar os resultados de análises de lâminas de folhas recém-expandidas para Brachiaria decumbens Stapf. (capim-Braquiária), através do método DRIS. Para o estabelecimento das normas DRIS utilizaram-se resultados de concentrações dos nutrientes N, P, K, Ca, Mg, S, Cu, Fe, Mn e Zn e de produção relativa obtidos em seis experimentos conduzidos em casa-de-vegetação com solução nutritiva, tendo sílica como substrato. Os índices DRIS foram calculados utilizando-se dois critérios para a escolha da ordem da razão dos nutrientes: valor F - razão de variância das relações entre nutrientes entre o grupo de referência e de baixa produtividade; e valor R - coeficientes de correlação entre os valores de produtividade e a relação entre os pares de nutrientes, e três formas de cálculo das funções dos nutrientes (métodos de Beaufils, de Jones e de Elwali & Gascho). Os dois critérios para a escolha da ordem da razão dos nutrientes selecionaram razões diferentes entre pares de nutrientes; as concentrações dos nutrientes correlacionaram-se positiva e significativamente com os respectivos índices DRIS, com exceção do N; e as normas DRIS são aplicáveis para o diagnóstico nutricional dos dez nutrientes estudados nas lâminas foliares do capim-Braquiária. Palavras-chave: Brachiaria decumbens, normas DRIS, diagnose foliar
INTRODUCTION
The common interpretation criteria for chemical analysis in leaves of forage grasses, Signal grass included, imply the comparison of nutrient concentrations with val-ues of reference of critical concentrations or sufficiency ranges. The Diagnosis and Recommendation Integrated System (DRIS) uses relationships among the concentra-tions of nutrients and not the absolute nutrient concen-tration. The comparison of each relationship with the
av-erage relationship of a reference population (Beaufils, 1971) has been efficient for interpreting foliar analysis results.
the supply of nutrients and its concentrations in the plant, so that increases and decreases in the fluxes and concen-trations of nutrients provide variation in the production.
The relationship between a pair of nutrients in the DRIS norms can be either direct or inverse, but only one relationship type is used for each pair of nutrients. The or-der of relationships can interfere in the results of nutrient index calculation, especially if the functions are obtained using the method of calculation of Jones (1981), as dem-onstrated by Bataglia & Santos (1990) in Citrus sp.
Two criteria for the selection of the relationships among nutrients have been used. The criterion of the F value (Letzsch, 1985; Walworth & Sumner, 1987) and the R value (Nick, 1998). To calculate the ratio functions of nutrients, three methods have been tested: Beaufils (1973), Jones (1981), and Elwali & Gascho (1984).
The objective of this paper was to establish DRIS norms adapted to Signal grass because there is still no information available to allow the use of DRIS method for the nutritional diagnosis of this forage crop.
MATERIAL AND METHODS
To create the database, results of nutrient concen-trations in the laminae of the two youngest, totally ex-panded leaves with visible ligula were used. These lami-nae have recently been reported as diagnostic leaves in sev-eral tropical forage grasses (Monteiro, 2004). Data were recorded from six experiments with the grass Brachiaria decumbens, grown in silica with nutrient solution, in green-house environment at Piracicaba, State of São Paulo, Bra-zil. These experiments were related to nitrogen rates (one experiment), phosphorous rates (one experiment), magne-sium rates (one experiment), sulfur rates (two experiments), and combinations between rates of nitrogen and of sulfur (one experiment), a total of 342 samples.
Plants were submitted to two harvests. Plant tops were separated in: a) emergent leaves (EL); b) laminae of the two youngest, recently and totally expanded leaves, with visible ligula (LR); c) laminae of the other mature leaves totally expanded (LM), and d) culms + sheaths (CS). All plant material sampled in the two growth pe-riods were dried to constant weight in stove with forced air circulation at 65ºC, and then weighed in precision scale to determine the production of dry mass. Diagnos-tic foliar laminae (LR) were grounded for determination of nitrogen, phosphorus, potassium, calcium, magnesium, sulfur, iron, manganese, copper, and zinc, according to methodology described by Sarruge & Haag (1974).
The reference population of the study was formed by results of chemical analysis in LR of Signal grass, which showed relative productions of dry mass of the plant tops over 50% of the maximum in those experi-ments. This population was then defined after examining the distribution of frequency of the relative productivity.
The average, the standard deviation, and the co-efficient of variation of relationship values for nutrient concentrations, two to two, were obtained from the re-sults of nutrient concentrations in the plant tissue col-lected in the two harvests of Signal grass, for populations of low and high productivity. To choose the nutrient ra-tio order, two criteria were appraised. The first criterion, proposed by Nick (1998), denominated R value, is the calculation of the correlation coefficients (r) among the productivity values, and the relationship among the pairs of nutrients, either in the direct or in the inverse order. In this criterion the relationship order which presents the higher absolute value for the correlation coefficient (r) should be selected, considering:
If : |r
A/B| > |r B/A| then: relation in the norm = A/B
If : |r A/B| < |r B/A| then: relation in the norm = B/A
where: |r A/B| = Absolute value of the correlation coeffi-cient between productivity and ratio between nutrient concentrations A and B in the population; |r
B/A| = Abso-lute value of the correlation coefficient between produc-tivity and ratio between nutrient concentrations B and A in the population.
According to the criterion described by Letzsch (1985) and Walworth & Sumner (1987), the F value uses the calculation of variance ratio of the relationships among nutrients between the reference group (r) and the low productivity group (b), either in the direct order or in the inverse order. Through this criterion, the relation-ship of order that presents the larger variance ratio be-tween the group of high and the one of low productivity, was selected considering:
If: [s2 (A/B)
b / s 2
(A/B) r] > [ s
2 (B/A)
b / s 2
(B/A)
r] t h e n : relation in the norm = A/B
If: [s2 (A/B)b / s2 (A/B)r] < [ s2 (B/A)b / s2 (B/A)r] t h e n : relation in the norm = B/A
where: s2 (A/B)r = Ratio variance between nutrient con-centrations A and B of the reference population; s2
(A/ B)b = Ratio variance between nutrient concentrations A and B of the low productivity population; s2 (B/A)r = Ra-tio variance between nutrient concentraRa-tions B and A of the reference population; s2 (B/A)b = Ratio variance be-tween nutrient concentrations B and A of the low produc-tivity population.
The DRIS indices for the nutrients were calcu-lated using procedures proposed by Beaufils (1973), Jones (1981) and Elwali & Gascho (1984), on the soft-ware Microsoft ExcelTM
nutri-ent concnutri-entrations, the DRIS indices for each nutrinutri-ent were related to the concentration of the respective nutri-ent and the significance correlation was estimated using the “General Linear Model” procedure (GLM) of the sta-tistical package SAS (SAS Institute, 2000).
RESULTS AND DISCUSSION
Through the distribution of frequency of the dry mass production (Figure 1), it was observed that 29% of samples presented relative productions lower than 50%, either in the first or in the second growth of Signal grass. Thus, for the establishment of DRIS norms for Signal grass, samples of high productivity (reference population) were defined as those that presented relative dry matter yield higher than 50%. The relative dry matter produc-tion was expressed as percentage of the maximum (100%) production reached by the plants in each experimental unit.
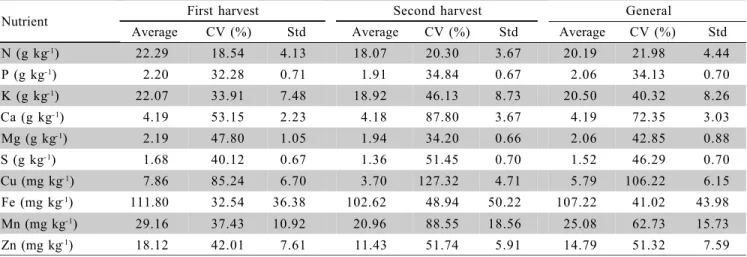
Table 1 presents the average values, variation coefficient, and standard deviation for the concentrations of nutrients in laminae of recently expanded leaves of Signal grass, for the reference population (relative pro-duction over 50%) in the first and in the second growth period, as well as for the average of the growths. Tis-sue samples of the first harvest presented higher con-centrations of nutrients than tissue samples of the sec-ond harvest, especially for nutrients N, K, Cu, Mn, and Zn. The higher concentration of nutrients in the first growth probably resulted from higher demands of nu-trients by plants in their establishment (formation of the plant top and the root system). In the second growth, plants already presented their root system formed, the productivity of the plant top was generally higher, lead-ing to dilution effect in the concentration of the nutri-ents in the plant tissues.
Preliminar tests showed that the use of average values of both harvests to generate DRIS norms presented
Figure 1 - Frequency distribution and relative productivity of Brachiaria decumbens, concerning the first (a) and the second (b) growth, in six experiments.
Table 1 - Averages, coefficients of variation (CV), and standard deviations (Std) for the concentrations of nutrients in the laminae of recently expanded leaves of Brachiaria decumbens, as related to the first and second harvests and the average of the two harvests for the reference population (relative productivity higher than 50%).
Nutrient First harvest Second harvest General
Average CV (%) Std Average CV (%) Std Average CV (%) Std
N (g kg-1) 22.29 18.54 4.13 18.07 20.30 3.67 20.19 21.98 4.44
P (g kg-1) 2.20 32.28 0.71 1.91 34.84 0.67 2.06 34.13 0.70
K (g kg-1) 22.07 33.91 7.48 18.92 46.13 8.73 20.50 40.32 8.26
Ca (g kg-1) 4.19 53.15 2.23 4.18 87.80 3.67 4.19 72.35 3.03
Mg (g kg-1) 2.19 47.80 1.05 1.94 34.20 0.66 2.06 42.85 0.88
S (g kg-1) 1.68 40.12 0.67 1.36 51.45 0.70 1.52 46.29 0.70
Cu (mg kg- 1) 7.86 85.24 6.70 3.70 127.32 4.71 5.79 106.22 6.15
Fe (mg kg-1) 111.80 32.54 36.38 102.62 48.94 50.22 107.22 41.02 43.98
Mn (mg kg-1) 29.16 37.43 10.92 20.96 88.55 18.56 25.08 62.73 15.73
Zn (mg kg-1) 18.12 42.01 7.61 11.43 51.74 5.91 14.79 51.32 7.59
similar efficiency to the use of the individual values of harvests. Thus, in the establishment of DRIS norms the results of average concentrations of nutrients were used in the material of both harvests (Table 2). The values
ob-tained for DRIS norms for Signal grass were lower than the one used by Bailey et al. (1997) for perennial ryegrass, mainly when Ca, Mg, and S participated in the relation-ships, indicating that the concentrations of these nutrients
Table 2 - DRIS norms (averages, coefficients of variation and standard deviations) and variance for the relationships among nutrients two to two, correlation coefficient between the ratio of each pair of nutrients and the relative dry mater production of Signal grass (R value) and ratio among variances of the populations with high and low productivity, considering the reference population (F value).
*The values in boldface correspond to the selected relationships among nutrients.
Ratio Avg C V Std Var R F Ratio Avg C V Std Var R F
N/P 10.25 40.98 4.20 14.73 -0.39 40.03 S/N 0.08 48.74 0.04 0.00 -0.03 1.42 N/K 1.10 36.54 0.40 0.11 0.03 60.26 S/P 0.85 58.88 0.50 0.18 -0.33 12.66
N/Ca 6.33 48.87 3.09 6.29 0.01 10.21 S/K 0.09 54.85 0.05 0.00 -0.09 29.60 N/Mg 11.20 48.60 5.44 27.49 -0.03 4.73 S/Ca 0.51 59.89 0.31 0.06 0.04 2.53 N/S 14.02 49.26 6.91 29.55 0.01 3.53 S/Mg 0.90 60.82 0.55 0.23 -0.01 3.27 N/Cu 6.10 77.99 4.76 21.93 0.22 0.28 S/Cu 0.45 77.32 0.35 0.11 0.17 0.59 N/Fe 0.20 47.82 0.09 0.00 -0.17 5.54 S/Fe 0.02 54.61 0.01 0.00 -0.15 5.46 N/Mn 0.93 41.16 0.38 0.10 0.27 1.78 S/Mn 0.08 61.04 0.05 0.00 0.26 0.78 N/Zn 1.56 44.94 0.70 0.36 0.41 0.74 S/Zn 0.12 54.57 0.07 0.00 0.40 0.88 P/N 0.11 29.39 0.03 0.00 -0.30 27.04 Cu/N 0.25 55.26 0.14 0.02 -0.12 5.53 P/K 0.11 43.76 0.05 0.00 -0.13 28.76 Cu/P 2.55 63.19 1.61 2.30 -0.37 26.56 P/Ca 0.66 50.56 0.33 0.07 -0.14 53.55 Cu/K 0.26 62.90 0.17 0.02 -0.12 70.93
P/Mg 1.18 51.68 0.61 0.31 -0.20 9.84 Cu/Ca 1.50 70.87 1.06 0.99 -0.08 24.86 P/S 1.44 55.39 0.80 0.42 -0.13 17.83 Cu/Mg 2.78 69.10 1.92 3.42 -0.08 4.96 P/Cu 0.65 85.09 0.55 0.30 0.07 1.07 Cu/S 3.33 68.33 2.27 4.31 -0.10 15.80 P/Fe 0.02 51.07 0.01 0.00 -0.21 17.28 Cu/Fe 0.05 57.25 0.03 0.00 -0.20 17.49 P/Mn 0.10 45.95 0.04 0.00 0.23 3.53 Cu/Mn 0.22 56.30 0.13 0.01 0.02 6.10 P/Zn 0.17 51.49 0.09 0.01 0.14 3.44 Cu/Zn 0.36 58.56 0.21 0.04 0.16 1.55 K/N 1.00 37.96 0.38 0.11 -0.27 4.02 Fe/N 5.54 45.20 2.51 2.63 -0.03 7.48
K/P 9.97 49.32 4.92 18.45 -0.41 13.91 Fe/P 57.80 56.67 32.75 701.62 -0.25 76.73 K/Ca 5.93 47.74 2.83 4.08 -0.13 17.54 Fe/K 5.78 51.32 2.97 4.28 -0.05 34.86 K/Mg 10.60 69.95 7.42 51.96 -0.16 16.09 Fe/Ca 32.82 55.50 18.21 178.38 0.06 6.19 K/S 13.72 58.37 8.01 45.16 -0.13 3.93 Fe /Mg 62.86 71.01 44.64 1718.68 -0.02 3.70 K/Cu 6.10 78.44 4.79 21.77 0.08 0.63 Fe/S 75.32 55.11 41.51 892.74 0.03 4.42 K/Fe 0.19 50.06 0.10 0.00 -0.37 5.15 Fe/Cu 26.53 66.04 17.52 245.07 0.24 0.89 K/Mn 0.90 49.46 0.45 0.14 0.18 1.32 Fe/Mn 4.96 53.06 2.63 3.81 0.37 3.19 K/Zn 1.53 49.26 0.76 0.38 0.27 1.11 Fe/Zn 8.00 50.12 4.01 6.65 0.45 2.06 Ca/N 0.19 52.09 0.10 0.01 -0.13 5.75 M n/N 1.21 43.17 0.52 0.20 -0.37 29.15 Ca/P 1.92 73.82 1.42 1.82 -0.40 14.79 M n/P 12.05 50.23 6.05 26.85 -0.51 14.00
Ca/K 0.19 49.75 0.09 0.01 -0.12 62.03 M n/K 1.28 45.75 0.59 0.22 -0.28 43.33 Ca/Mg 1.95 63.76 1.24 1.27 -0.10 8.04 M n/Ca 6.79 50.50 3.43 6.28 -0.22 33.81 Ca/S 2.47 61.07 1.51 1.55 -0.07 5.69 M n/Mg 13.14 57.45 7.55 47.52 -0.30 9.69 Ca/Cu 1.07 73.75 0.79 0.56 0.11 0.82 M n/S 16.59 61.33 10.18 77.03 -0.28 14.36 Ca/Fe 0.04 58.36 0.02 0.00 -0.27 3.60 M n/Cu 6.22 72.26 4.50 18.39 -0.18 4.55 Ca/Mn 0.17 50.21 0.08 0.00 0.16 2.04 M n/Fe 0.24 54.00 0.13 0.01 -0.47 11.61 Ca/Zn 0.27 55.10 0.15 0.01 0.24 0.87 M n/Zn 1.78 53.45 0.95 0.63 -0.04 4.54 Mg/N 0.10 40.28 0.04 0.00 -0.18 2.56 Zn/N 0.74 44.93 0.33 0.08 -0.57 2.82 Mg/P 1.06 69.17 0.74 0.51 -0.41 22.17 Zn/P 7.39 70.82 5.23 24.88 -0.49 34.42 Mg/K 0.11 36.41 0.04 0.00 -0.18 119.57 Zn/K 0.77 53.21 0.41 0.12 -0.28 152.71
in the population studied by those authors were higher than those of Signal grass.
Both criteria to choose the ratio order of nutrients: R value proposed by Nick (1998) and F value described by Letzsch (1985) and Walworth & Sumner (1987), se-lected different ratios, the selection of same ratio only happened in 18 of the 90 studied ratios, mainly when nu-trients N, P, K, and S were involved (Table 2). The crite-rion R value highlights the fact that in most of the rela-tionships among nutrients low relation value between the ratio of each pair of nutrients and the relative production was observed. Coefficients of correlation equal to or higher than 0.40 were only obtained for the relations N/ Zn, K/P, Ca/P, Mg/P, S/Zn, Fe/Zn, Mn/P, Mn/Fe, Zn/N, Zn/P, and Zn/Fe. To choose the relationship, correlation coefficients with very low values were used in several cases.
After defining DRIS norms, the standard proce-dure was established in order to calculate DRIS indices using the two criteria to choose the ratio order of nutri-ents: R value proposed by Nick (1998) and F value de-scribed by Letzsch (1985) and Walworth & Sumner (1987), and the three methods more commonly used for DRIS and proposed by Beaufils (1973), Jones (1981) and Elwali & Gascho (1984).
The correlation coefficients among DRIS in-dexes obtained through the methods Beaufils (1973), Jones (1981) and Elwali & Gascho (1984) for combi-nations of criteria to choose ratios of nutrients (R and F values) and the concentrations of nutrients in lami-nae of recently expanded leaves of Signal grass for the entire population of the database are presented in the Table 3. Positive correlations (P < 0.01) were observed between the concentrations of the nutrients and the
re-spective DRIS indices obtained through the methods of Beaufils (1973), Jones (1981) and Elwali & Gascho (1984), except for nitrogen. The low relationship among the DRIS indices for nitrogen and the concentration of N has also been registered for other perennial crops, such as cherry and hazelnut (Righetti et al., 1988), cit-rus (Salvo, 2001) and coffee (Reis Jr. et al., 2002). These results indicate that for nitrogen, DRIS indices are strongly dependent on the concentration of the other nutrients in the sampled plant tissue, while for the other nutrients DRIS indices are dependent on their own con-centrations. Also, nitrogen concentration is strongly in-fluenced by dry matter accumulation, which is the sum of the concentration of C, H and O, variables usually not included in DRIS indices (Mourão Filho, 2004). The criteria of values R and F, to choose the ratio order of nutrients, presented similar fittings among DRIS indi-ces and the concentrations of the nutrients for the three DRIS methods used.
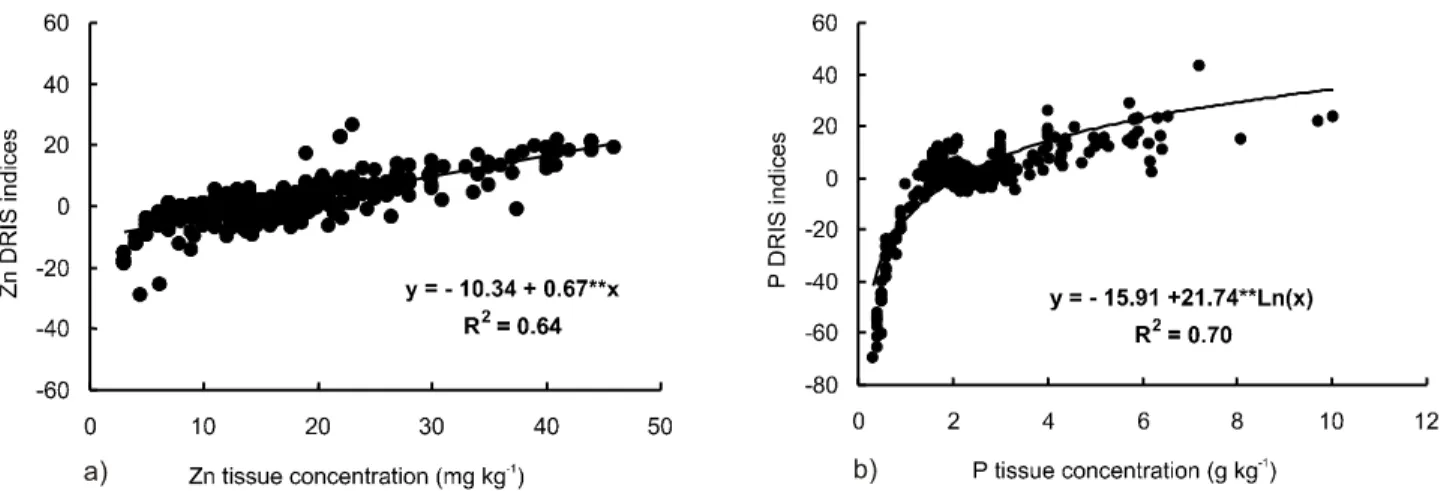
The relationships among DRIS indices and the concentrations of nutrients allowed two types of fittings: linear and logarithmic. For situations where the adjust-ment followed a linear model, as exemplified in the case of Zn (Figure 2a), results indicate that DRIS indices de-pend on each nutrient concentrations. When the adjust-ment was of the logarithmic type, it was observed that, as exemplified in the case of P (Figure 2b), above the con-centration of 1.0 g kg-1
the adjustment follows the linear model, while for concentrations lower than 1.0 g kg-1 there is a big drop in the DRIS indices, which suggests condition of severe deficiency.
Considering that the plants present nutritional balance for a given nutrient when the values of indices defined by DRIS method are closer to zero (Walworth &
Variable Beaufils Jones Elwali & Gascho
Independent Dependent R F R F R F
N IN 0.10 NS(1) 0.08NS(1) 0.14NS(1) 0.13NS(1) 0.08NS(1) 0.07NS(1)
P IP 0.70**(2) 0.70**(2) 0.62**(2) 0.68**(2) 0.69**(2) 0.69**(2)
K IK 0.53**(2) 0.54**(2) 0.52**(2) 0.43**(2) 0.49**(2) 0.51**(2)
Ca ICa 0.54**(2) 0.60**(2) 0.68**(2) 0.46**(2) 0.42**(2) 0.53**(2)
Mg IMg 0.56**(2) 0.55**(2) 0.55**(2) 0.59**(2) 0.50**(2) 0.48**(2)
S IS 0.64**(2) 0.65**(2) 0.63**(2) 0.58**(2) 0.59**(2) 0.61**(2)
Cu ICu 0.68**(2) 0.77**(2) 0.76**(2) 0.90**(1) 0.84**(1) 0.76**(1)
Fe IFe 0.48**(2) 0.47**(2) 0.40**(1) 0.40**(1) 0.38**(2) 0.36**(2)
Mn IMn 0.72**(2) 0.71**(2) 0.78**(1) 0.78**(1) 0.70**(1) 0.70**(1)
Zn IZn 0.64 **(1) 0.64**(1) 0.65**(1) 0.65**(1) 0.57**(1) 0.56**(1)
Table 3 - Coefficients of correlation among the concentrations of nutrients in laminae of recently expanded leaves of Brachiaria decumbens and the respective DRIS indices for combinations of methods for ratios among nutrients (R and F values) for the methods Beaufils, Jones and Elwali & Gascho, as related to the first and second harvests.
** = Significant at the level of 1% probability for the F test; NS = not significant.
Sumner, 1987), an attempt was made to graphically es-tablish the concentration of the nutrient in the leaf which is equivalent to this point of nutritional balance, by us-ing the equation of adjustment of the results (Table 4). The methods Beaufils (1973), Jones (1981) and Elwali & Gascho (1984) presented similar results concerning the concentrations of the nutrients considered adequate to the nutritional balance.
For Signal grass, when laminae of recently ex-panded leaves are used for diagnosis purposes, there is still no standard nutritional patterns well established for all the nutrients approached in this paper. However, Monteiro et al. (1995), Mattos (1997), Santos (1997), and Monteiro (2004) reported results for some nutrients in the recently expanded leaf laminae establishing the pattern of nutrient concentrations in Signal grass. These results are shown in Table 4. For nutrients in which such infor-mation is not available, concentrations of nutrients in the
new leaf laminae were considered, as reported by Gallo et al. (1974) and Werner et al. (1996).
Since it was observed that the nutritional balance defined by DRIS method is coincident with the concen-tration considered adequate by the criterion of sufficiency range, results can be considered absolutely coherent. The exceptions were Mn and Zn, for which DRIS methods in-dicated concentrations to the nutritional balance lower than the concentrations considered adequate to this grass (Table 4). According to Monteiro (2004), lower Mn and Zn concentrations in the recently expanded leaf laminae than in mature leaves have been found in Brachiaria
samples.
ACKNOWLEDGEMENTS
The authors gratefully acknowledge Anacleto Ranulfo dos Santos for supplying part of the necessary Figure 2 - Relationship among the concentration of zinc (a) and phosphorous (b) in the laminae of recently expanded leaves of Brachiaria
decumbens and the respective DRIS indices, as related to the first and second harvests.
Table 4 - Critical levels for the criterion of sufficiency range1 and those obtained for combinations of methods of choice for
the ratio order among nutrients (R and F values) and DRIS indices (methods of Beaufils, Jones and Elwali & Gascho) for the analysed population.
Nutrient Sufficiency range
1 Beaufils Jones Elwali & Gascho
Deficient Adequate Excessive R F R F R F
N (g kg-1) < 15 15 to 20 > 35.5 19.51 20.27 21.18 20.07 18.90 18.99
P (g kg-1) < 1.0 1.0 to 1.5 > 2.3 1.95 2.08 2.36 2.15 2.12 2.16
K (g kg-1) < 15 15 to 25 > 35 19.00 17.71 18.95 21.20 18.80 18.55
Ca (g kg-1) < 2.5 3.0 to 6.0 > 9.0 3.80 3.25 3.40 3.85 3.53 3.38
Mg (g kg-1) < 2.0 2.0 to 5.0 > 6.0 2.16 1.91 1.83 1.95 2.05 2.02
S (g kg-1) < 0.8 0.8 to 1.6 > 3.2 1.65 1.56 1.61 1.67 1.63 1.62
Cu (mg kg- 1) < 2.0 2.0 to 8.0 > 10 3.55 5.04 4.01 4.73 5.58 6.13
Fe (mg kg-1) < 25 30 to 150 > 250 107.92 116.33 132.01 124.48 118.98 116.50
Mn (mg kg-1) < 25 30 to 50 > 100 22.55 22.13 20.68 20.69 21.82 21.64
Zn (mg kg-1) < 13 20 to 30 > 40 15.45 15.45 13.81 13.68 14.04 13.98 1Values obtained from Monteiro et al. (1995); Santos (1997); Mattos (1997) and Monteiro (2004) for the laminae of recently expanded
leaves, and from Gallo et al. (1974) and Werner et al. (1996) for the young leaves of Signal grass.
data for this work, Plínio Marcos Frare, Renata Aparecida Martim and Waldssimiler Teixeira de Mattos for their help in conducting some trials, and CNPq for the scholarships.
REFERENCES
BAILEY, J.S.; BEATTIE, J.A.M.; KILPATRICK, D.J. The diagnosis and recommendation integrated system (DRIS) for diagnosing the nutrient status of grassland swards: I. Model establishment. Plant and Soil, v.197, p.127-135, 1997.
BATAGLIA, O.C.; SANTOS, W.R. Efeito do procedimento de cálculo e da população de referência nos índices do sistema integrado de diagnose e recomendação (DRIS). Revista Brasileira de Ciência do Solo, v.14, p.339-344, 1990.
BEAUFILS, E.R. Physiological diagnosis - a guide for improving maize production based on principles developed for rubber trees. Fertilizer Society of South African Journal, v.1, p.1-30, 1971.
BEAUFILS, E.R. Diagnosis and recommendation integrated system (DRIS). A general scheme for experimentation and calibration based on principles developed from research in plant nutrition. Pietermararitzburg, South Africa: University of Natal, 1973. 132p. (Soil Science Bulletin, 1).
COSTA, A.N. Sistema integrado de diagnose e recomendação (DRIS). Boletim Informativo da Sociedade Brasileira de Ciência do Solo, v.24, p.13-15, 1999.
ELWALI, A.M.O.; GASCHO, G.J. Soil testing, foliar analysis, and DRIS as guide for sugarcane fertilization. Agronomy Journal, v.76, p.466-470, 1984.
GALLO, J.R.; HIROCE, R.; BATAGLIA, O.C.; FURLANI, P.R.; FURLANI, A.M.C.; MATTOS, H.B.; SARTINI, H.J.; FONSECA, M.P. Composição inorgânica de forrageiras do Estado de São Paulo. Boletim de Indústria Animal, v.31, p.115-137, 1974.
JONES, C.A. Proposed modifications of the diagnosis and recommendation integrated system (DRIS) for interpreting plant analysis. Communications in Soil Science and Plant Analysis, v.12, p.785-794, 1981.
LETZSCH, W.S. Computer program for selection of norms for use in the diagnosis and recommendation integrated system (DRIS). Communications in Soil Science and Plant Analysis, v.16, p.339-347, 1985.
MATTOS, W.T. Diagnose nutricional de potássio em duas espécies de Braquiária. Piracicaba: USP/ESALQ, 1997. 74p. (Dissertação -Mestrado).
MONTEIRO, F.A. Concentração e distribuição de nutrientes em gramíneas e leguminosas forrageiras. In: SIMPÓSIO SOBRE MANEJO ESTRATÉGICO DA PASTAGEM, 2., Viçosa , 2004. Anais. Viçosa: UFV/DZO, 2004. p.71-107.
MONTEIRO, F.A.; MATTOS, W.T.; MARTIM, R.A. Partes da planta e diagnose nutricional de fósforo em Brachiaria decumbens. In: CONGRESSO BRASILEIRO DE CIÊNCIA DO SOLO, 25., Viçosa, 1995. Anais. Viçosa: SBCS, 1995. v.2, p.556-557.
MOURÃO FILHO, F.A.A. DRIS: Concepts and applications on nutritional diagnosis in fruit crops. Scientia Agricola, v.61, p.550-560, 2004. NICK, J.A. DRIS para cafeeiros podados. Piracicaba: USP/ESALQ, 1998.
86p. (Dissertação - Mestrado).
REIS JR., R.A.; CORRÊA, J.B.; CARVALHO, J.G.; GUIMARÃES, P.T.G. Estabelecimento de normas DRIS para o cafeeiro no Sul de Minas Gerais. 1ª aproximação. Ciência Agrotécnica, v.26, p.269-282, 2002. RIGHETTI, T.L.; ALKOSHAB, O.; WILDER, K. Verifying critical values
from DRIS norms in sweet cherry and hazelnut. Communications in Soil Science and Plant Analysis, v.19, p.1449-1466, 1988.
SALVO, J.G. Uso do DRIS na avaliação do estado nutricional de plantas cítricas afetadas pela clorose variegada dos citros. Piracicaba: USP/ ESALQ, 2001. 108p. (Dissertação - Mestrado).
SANTOS, A.R. Diagnose nutricional e resposta do capim braquiária submetido a rates de nitrogênio e enxofre. Piracicaba: USP/ESALQ, 1997. 115p. (Tese - Doutorado).
SARRUGE, J.R.; HAAG, H.P. Análises químicas em plantas. Piracicaba: ESALQ, 1974. 54p.
SAS Institute Inc. SAS/STAT. User’s guide, version 8.0. Cary, 2000. WALWORTH, J.L.; SUMNER, M.E. The diagnosis and recommendation
integrated system (DRIS). Advances in Soil Sciences, v.6, p.149-188, 1987.
WERNER, J.C.; PAULINO, V.T.; CANTARELLA, H.; QUAGGIO, J.A. Forrageiras. In: RAIJ, B. van; CANTARELLA, H.; QUAGGIO, J.A.; FURLANI, A.M.C. (Ed.) Recomendações de adubação e calagem para o Estado de São Paulo. Campinas: Instituto Agronômico, 1996. 285p. (Boletim Técnico, 100).