DRIS NORMS FOR EVALUATING THE NUTRITIONAL
STATE OF APPLE TREE
Gilmar Ribeiro Nachtigall1*; Antonio Roque Dechen2
1
Embrapa Uva e Vinho, C.P. 130 - 95700-000 - Bento Gonçalves, RS - Brasil. 2
USP/ESALQ - Depto. de Ciência do Solo, C.P. 9 - 13418-900 - Piracicaba, SP - Brasil. *Corresponding author <[email protected]>
ABSTRACT: For Brazilian conditions there are still no studies on the use of the diagnosis and recommendation of the integrated system (DRIS) for nutritional diagnosis of the apple tree. The nutritional diagnosis of the apple tree is made using the criterion of sufficiency range. The aim of this report is to establish DRIS norms to interpret the results of apple tree leaf analysis in South Brazil. The study covered the apple producing areas of the states of Rio Grande do Sul and Santa Catarina, in 70 orchards selected for their high productivity and employment of excellent management techniques. The concentrations of nitrogen, phosphorus, potassium, calcium, magnesium, boron, copper, iron, manganese, and zinc were determined in leaf samples. DRIS indices were calculated using two criteria for the choice of the ratio order of nutrients (F value - ratio of the variance of the relationships among nutrients between the reference group and the low productivity group, and R value - correlation coefficients between the productivity values and the relationship between pairs of nutrients) and three forms to calculate the nutrient functions (methods of Beaufils, Jones and Elwali & Gascho). The two criteria for the choice of the ratio order of the nutrients selected different ratios. The concentrations of nutrients presented positive correlations (P < 0.01) with the respective indices DRIS, except for N. The defined DRIS norms are applicable for the nutritional diagnosis of apple trees.
Key words: Malus Domestica, DRIS norms, foliar diagnosis
NORMAS DRIS PARA AVALIAÇÃO DO ESTADO
NUTRICIONAL DA MACIEIRA
RESUMO: Para as condições brasileiras, ainda não existem estudos sobre a utilização do sistema integrado de diagnose e recomendação (DRIS) para a diagnose nutricional da macieira, cujo diagnóstico nutricional das plantas é feito utilizando o critério de faixa de suficiência. Este trabalho teve por objetivo estabelecer normas DRIS, visando à interpretação dos resultados de análises de folhas de plantas de macieira no Sul do Brasil. O estudo foi realizado nas regiões produtoras de maçã do Rio Grande do Sul e de Santa Catarina, em 70 pomares selecionados quanto à produtividade e técnicas de manejo do pomar. Foram determinadas as concentrações de nitrogênio, fósforo, potássio, cálcio, magnésio, boro, cobre, ferro, manganês e zinco nas amostras de folhas. Os índices DRIS foram calculados utilizando-se dois critérios para a escolha da ordem da razão dos nutrientes (valor “F” - razão de variância das relações entre nutrientes entre o grupo de referência e de baixa produtividade e valor “R” - coeficientes de correlação entre os valores de produtividade e a relação entre os pares de nutrientes) e três formas de cálculo das funções dos nutrientes (métodos de Beaufils, Jones e Elwali & Gascho). Os dois critérios para a escolha da ordem da razão dos nutrientes selecionaram razões diferentes. As concentrações dos nutrientes apresentaram correlações positivas (P < 0,01) com os respectivos índices DRIS, com exceção do N. As normas DRIS definidas são aplicáveis para o diagnóstico nutricional da macieira.
Palavras-chave: Malus Domestica, normas DRIS, diagnose foliar
INTRODUCTION
The method DRIS uses binary relations among nutrients, incorporating the concept of primary inces, different from the traditional methods of foliar di-agnosis like the critical level and sufficiency range (Costa, 1999). The calculation of DRIS indices
Once the reference population is defined, the norms are obtained. These are constituted of the rela-tions between all pairs of nutrients and their respective standard deviations and coefficients of variation (Beaufils, 1973). In the calculations of the DRIS method only one type of relationship is used for each pair of nutrients. Several criteria to select the most appropriate relation have been proposed. Bataglia & Santos (1990) evaluated the relations among nutrients in the direct or-der and in the inverse oror-der and they concluded that the order of the relation could interfere in the results of cal-culation for the citrus indices of nutrients, especially if the functions are obtained by method of Jones (1981).
One of the most commonly used criteria to se-lect the relationship among nutrients is the criterion of the highest relation of variances between the popula-tions of low productivity and the populapopula-tions of high productivity - “F value” (Letzsch, 1985; Walworth & Summer, 1987). Nick (1998) proposed the criterion called “R Value” to choose the ratio order of nutrients in the application DRIS for trimmed coffee plants. The ratio order is chosen according to the result in the high-est absolute value of the correlation coefficient (r) among the values of the response variable of the plant and the ratio between pairs of nutrients, either in the direct order or in the inverse order.
The objective of this work was to establish ap-propriate norms for the apple tree crop in South Bra-zil, seeking to use the DRIS method for its nutritional diagnosis.
MATERIAL AND METHODS
The study was carried out in the apple produc-ing area of Campos de Cima da Serra (28o30’S and 50o56’W), in Rio Grande do Sul, and Alto Vale do Rio do Peixe (27o01’S and 50o55’W) and Planalto Serrano (28o17’S and 49o56’W), in Santa Catarina, Brazil. The predominant soils in these areas are Humic Xanthic Hapludox and Tipic Hapumbrept.
The data collection was accomplished in prop-erties (large, medium, and small size) with the follow-ing characteristics: a) located in the main apple produc-ing areas of Rio Grande do Sul and Santa Catarina; b) having records of superior productivity in their regional average; c) being managed by a specialist in agronomy; d) presenting a detailed survey of productivity; e) pre-senting cultivar diversity, rootstock and spacings; f) hav-ing been planted between 1991 and 1998, and g) pre-senting records of crop management practices.
Based on these characteristics, 70 apple tree orchards were selected to collect information on the reports of the areas during the harvests of 2002 and 2003. The monitored variables were: production,
cul-tivar, rootstock, spacing, year of planting, cultural prac-tices, pest management, fertilizer management and cor-rective measures, made through a questionnaire filled out by the responsible technician of the orchard.
In each orchard 20 plants were selected for their uniformity, in order to sample leaves. The col-lection of leaves was accomplished during January 15 to February 15, this period begin considered the stan-dard time for the foliar diagnosis in apple orchards (Magnani et al., 1997). The leaf contents of N, P, K, Ca, Mg, Cu, Fe, Mn, and Zn were determined as de-scribed by Freire (1998).
Averages, standard deviations and the coeffi-cient of variations of the values of the relationships of pairs of the nutrient concentrations were calculated for the harvests of 2002 and 2003 of the discharge popu-lations and of low productivity. For both popupopu-lations results were excluded regarding the concentrations of iron, manganese and zinc, whose values were above the concentration considered normal for the crop (Basso et al., 1986).
To choose the ratio order of nutrients two cri-teria were used. The first, proposed by Nick (1998), called “R value”, consists of the calculation of the cor-relation coefficients (r) among the productivity values and the relationship between pairs of nutrients, either in the direct order or in the inverse order. The order of the relationship that presents the larger absolute value of the correlation coefficient (r) is selected:
if: | r A/B | > | r B/A | then: relationship in the norm = A/B
if: | r A/B | < | r B/A | then: relationship in the norm = B/A
where: | r A/B | = absolute value of the correlation co-efficient between the productivity and the ratio among the concentrations of the nutrients A and B of the population; | r B/A | = same as above for nutrients B and A.
The second criterion, described by Letzsch (1985) and Walworth & Summer (1987), called “F value”, consists of the calculation of the ratio of the variance of the relationships among nutrients between the reference group (r) and the one of low productiv-ity (b), either in the direct order or in the inverse or-der. It is selected the order of relationship that presents the larger variance ratio between the high and the low productivity groups:
if: [s2
(A/B)b / s2
(A/B)r]> [s2
(B/A)b / s2
(B/A)r] then: relationship in the norm = A/B
if: [s2 (A/B)b / s2 (A/B)r] <[s2 (B/A)b / s2 (B/A)r] then: relationship in the norm = B/A
con-centrations of the nutrients A and B of the reference population (r); s2 (A/B)b = same for nutrients A and B of the population of low productivity (b); s2 (B/A)r = same for nutrients B and A of r; s2 (B/A)b = same for nutrients B and A of b.
The Indices DRIS for the nutrients were cal-culated as proposed by Beaufils (1973), Elwali & Gascho (1984) and Jones (1981), using the software Microsoft ExcelTM
. To evaluate the efficiency of the three methods, considering the two criteria of choice of the ratio order of nutrients, the Indices DRIS for each nutrient were related with the concentrations of the respective nutrients and their significance of the correlation were verified, using the Lineal “General Linear Models” (GLM) of the SAS statistical package (SAS Institute, 1985).
To calculate the concentrations of the nutrients in the leaves equivalent to the nutritional balance ob-tained by the DRIS methods, relationships were estab-lished, (linear model) between the concentrations of the nutrients and their respective DRIS indices. It was con-sidered that plants present nutritional balance for a given nutrient when the values of the indices, defined for the DRIS methods, are close to zero (Walworth & Summer, 1987).
RESULTS AND DISCUSSION
The productivity of fruits varied from 11.4 to 104.0 t ha-1 (Figure 1) and considering that the mean productivity of the the apple trees, in the last three har-vests, in Rio Grande do Sul, Santa Catarina, and Paraná correspondend to 26.9 t ha-1
(ABPM, 2004), it becomes evident that the average of production of the orchards used in this work (47.3 t ha-1) was much superior to the overall average of the area. This indicates that the sampling proposed for the definition of the DRIS norms was adequate, since it includes orchards of high productivity.
For the frequency distribution, only 20% of the orchards presented productivity below 30 t ha-1
, value considered low for this crop, although similar to the average of the south of Brazil. In 60% of the sampled orchards the productivity varied from 30 to 55 t ha-1
, a production range considered of economical return, while 20% of the orchards presented productivities above 55 t ha-1, values considered high, altained only under with high technology.
For the establishment of the DRIS norms for the apple tree crop, orchards of high productivity (ref-erence population) were defined as those that presented productivities above 40 t ha-1 for normal harvests and above 30 t ha-1 for harvests with alternation, using the mean results of the two harvests to generate the DRIS norms. The results of the concentrations of Fe, Mn and Zn in the leaves larger than the concentration consid-ered normal for the crop (Basso et al., 1986), were not included in the definition of the norms. Samples from established orchards were eliminated when the conduc-tion system was of low density.
The mean values, the coefficients of variation and the standard deviation for the concentrations of
Figure 1 - Frequency distribution of the productivity of apple trees (t ha-1) in fruits, for the harvests of 2002 and
2003 of 70 orchards in Rio Grande do Sul and Santa Catarina, Brazil.
0 5 10 15 20 25 30
Fr
e
q
ue
n
c
y
15 23 3 1 3 8 46 54 62 69 77 85 92 100
Pr od u ctiv ity - t h a-1
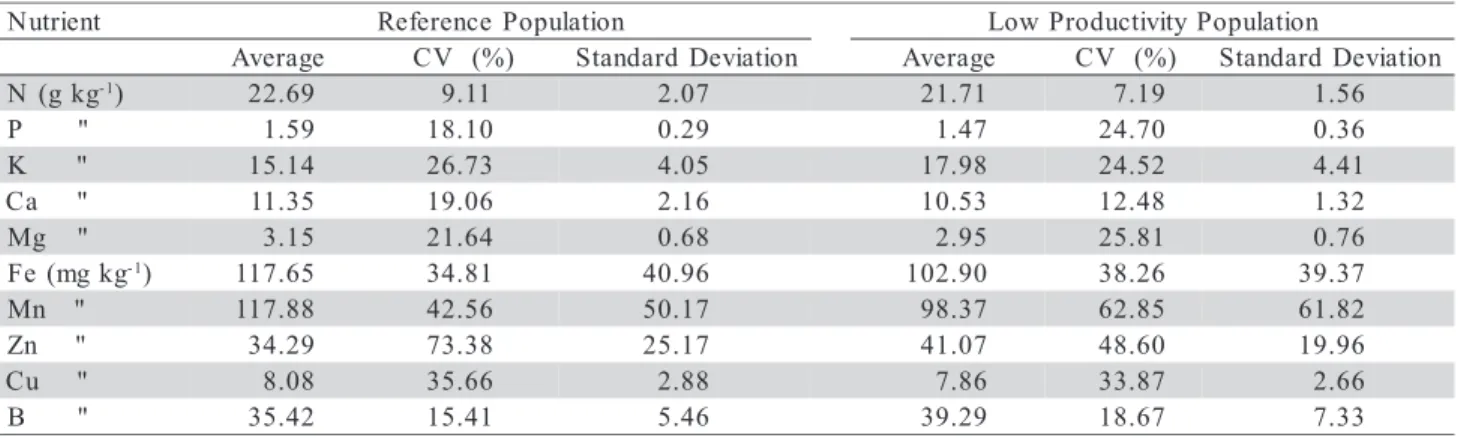
Table 1 - Average, coefficient of variation (CV) and standard deviation for the concentrations of nutrients in apple tree leaves, for the reference population and for the population of low productivity (average of harvests).
t n e i r t u
N ReferencePopulation LowProductivityPopulation e
g a r e v
A CV (%) StandardDeviation Average CV (%) StandardDeviation g
k g (
N -1) 22.69 9.11 2.07 21.71 7.19 1.56
P " 1.59 18.10 0.29 1.47 24.70 0.36
"
K 15.14 26.73 4.05 17.98 24.52 4.41
" a
C 11.35 19.06 2.16 10.53 12.48 1.32
g
M " 3.15 21.64 0.68 2.95 25.81 0.76
g k g m ( e
F -1) 117.65 34.81 40.96 102.90 38.26 39.37
" n
M 117.88 42.56 50.17 98.37 62.85 61.82
" n
Z 34.29 73.38 25.17 41.07 48.60 19.96
" u
C 8.08 35.66 2.88 7.86 33.87 2.66
nutrients in the leaves, for the reference population and for the population of low productivity (Table 1) indi-cate that the concentrations of nutrients were larger for the reference population in relation to the population of low production, except for K, Zn and B. Consider-ing that the samplConsider-ing of leaves is made when fruits are
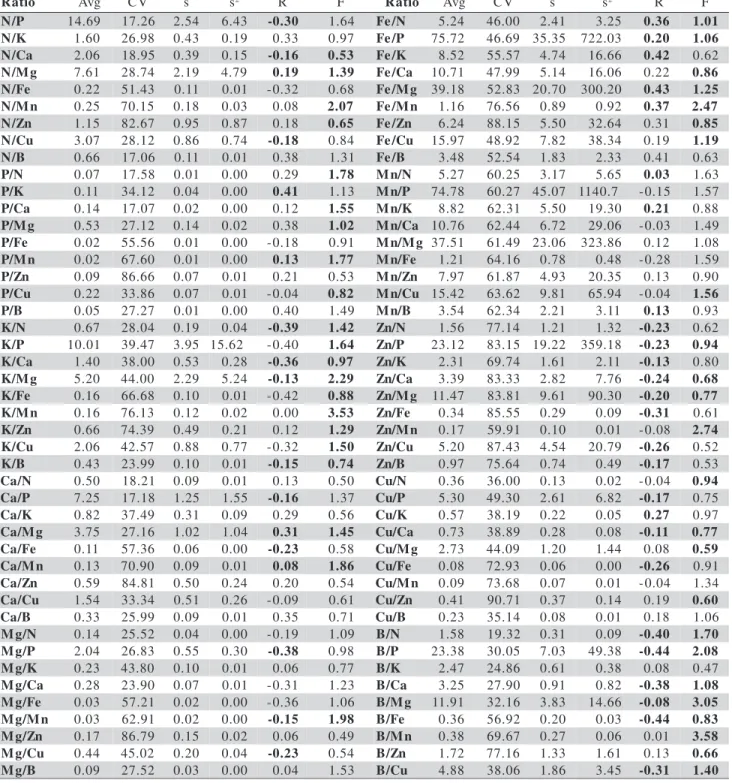
Table 2 - DRIS Norms (average, coefficient of variation and standard deviation) and variance for the relationships between pairs of nutrients, correlation coefficient between the ratio of each pair of nutrients and the productivity of apple trees (R) and ratio between variances of populations of high and low productivity (F), considering the reference population.
*The values in bold correspond to the relationships among nutrients selected.
o i t a
R Avg CV s s2 R F Ratio Avg CV s s2 R F
P /
N 14.69 17.26 2.54 6.43 -0.30 1.64 Fe/N 5.24 46.00 2.41 3.25 0.36 1.01
K /
N 1.60 26.98 0.43 0.19 0.33 0.97 Fe/P 75.72 46.69 35.35 722.03 0.20 1.06
a C /
N 2.06 18.95 0.39 0.15 -0.16 0.53 Fe/K 8.52 55.57 4.74 16.66 0.42 0.62
g M /
N 7.61 28.74 2.19 4.79 0.19 1.39 Fe/Ca 10.71 47.99 5.14 16.06 0.22 0.86
e F /
N 0.22 51.43 0.11 0.01 -0.32 0.68 Fe/Mg 39.18 52.83 20.70 300.20 0.43 1.25
n M /
N 0.25 70.15 0.18 0.03 0.08 2.07 Fe/Mn 1.16 76.56 0.89 0.92 0.37 2.47
n Z /
N 1.15 82.67 0.95 0.87 0.18 0.65 Fe/Zn 6.24 88.15 5.50 32.64 0.31 0.85
u C /
N 3.07 28.12 0.86 0.74 -0.18 0.84 Fe/Cu 15.97 48.92 7.82 38.34 0.19 1.19
B /
N 0.66 17.06 0.11 0.01 0.38 1.31 Fe/B 3.48 52.54 1.83 2.33 0.41 0.63
N /
P 0.07 17.58 0.01 0.00 0.29 1.78 Mn/N 5.27 60.25 3.17 5.65 0.03 1.63
K /
P 0.11 34.12 0.04 0.00 0.41 1.13 Mn/P 74.78 60.27 45.07 1140.7 -0.15 1.57
a C /
P 0.14 17.07 0.02 0.00 0.12 1.55 Mn/K 8.82 62.31 5.50 19.30 0.21 0.88
g M /
P 0.53 27.12 0.14 0.02 0.38 1.02 Mn/Ca 10.76 62.44 6.72 29.06 -0.03 1.49
e F /
P 0.02 55.56 0.01 0.00 -0.18 0.91 Mn/Mg 37.51 61.49 23.06 323.86 0.12 1.08
n M /
P 0.02 67.60 0.01 0.00 0.13 1.77 Mn/Fe 1.21 64.16 0.78 0.48 -0.28 1.59
n Z /
P 0.09 86.66 0.07 0.01 0.21 0.53 Mn/Zn 7.97 61.87 4.93 20.35 0.13 0.90
u C /
P 0.22 33.86 0.07 0.01 -0.04 0.82 Mn/Cu 15.42 63.62 9.81 65.94 -0.04 1.56
B /
P 0.05 27.27 0.01 0.00 0.40 1.49 Mn/B 3.54 62.34 2.21 3.11 0.13 0.93
N /
K 0.67 28.04 0.19 0.04 -0.39 1.42 Zn/N 1.56 77.14 1.21 1.32 -0.23 0.62
P /
K 10.01 39.47 3.95 15.62 -0.40 1.64 Zn/P 23.12 83.15 19.22 359.18 -0.23 0.94
a C /
K 1.40 38.00 0.53 0.28 -0.36 0.97 Zn/K 2.31 69.74 1.61 2.11 -0.13 0.80
g M /
K 5.20 44.00 2.29 5.24 -0.13 2.29 Zn/Ca 3.39 83.33 2.82 7.76 -0.24 0.68
e F /
K 0.16 66.68 0.10 0.01 -0.42 0.88 Zn/Mg 11.47 83.81 9.61 90.30 -0.20 0.77
n M /
K 0.16 76.13 0.12 0.02 0.00 3.53 Zn/Fe 0.34 85.55 0.29 0.09 -0.31 0.61
n Z /
K 0.66 74.39 0.49 0.21 0.12 1.29 Zn/Mn 0.17 59.91 0.10 0.01 -0.08 2.74
u C /
K 2.06 42.57 0.88 0.77 -0.32 1.50 Zn/Cu 5.20 87.43 4.54 20.79 -0.26 0.52
B /
K 0.43 23.99 0.10 0.01 -0.15 0.74 Zn/B 0.97 75.64 0.74 0.49 -0.17 0.53
N / a
C 0.50 18.21 0.09 0.01 0.13 0.50 Cu/N 0.36 36.00 0.13 0.02 -0.04 0.94
P / a
C 7.25 17.18 1.25 1.55 -0.16 1.37 Cu/P 5.30 49.30 2.61 6.82 -0.17 0.75
K / a
C 0.82 37.49 0.31 0.09 0.29 0.56 Cu/K 0.57 38.19 0.22 0.05 0.27 0.97
g M / a
C 3.75 27.16 1.02 1.04 0.31 1.45 Cu/Ca 0.73 38.89 0.28 0.08 -0.11 0.77
e F / a
C 0.11 57.36 0.06 0.00 -0.23 0.58 Cu/Mg 2.73 44.09 1.20 1.44 0.08 0.59
n M / a
C 0.13 70.90 0.09 0.01 0.08 1.86 Cu/Fe 0.08 72.93 0.06 0.00 -0.26 0.91
n Z / a
C 0.59 84.81 0.50 0.24 0.20 0.54 Cu/Mn 0.09 73.68 0.07 0.01 -0.04 1.34
u C / a
C 1.54 33.34 0.51 0.26 -0.09 0.61 Cu/Zn 0.41 90.71 0.37 0.14 0.19 0.60
B / a
C 0.33 25.99 0.09 0.01 0.35 0.71 Cu/B 0.23 35.14 0.08 0.01 0.18 1.06
N / g
M 0.14 25.52 0.04 0.00 -0.19 1.09 B/N 1.58 19.32 0.31 0.09 -0.40 1.70
P / g
M 2.04 26.83 0.55 0.30 -0.38 0.98 B/P 23.38 30.05 7.03 49.38 -0.44 2.08
K / g
M 0.23 43.80 0.10 0.01 0.06 0.77 B/K 2.47 24.86 0.61 0.38 0.08 0.47
a C / g
M 0.28 23.90 0.07 0.01 -0.31 1.23 B/Ca 3.25 27.90 0.91 0.82 -0.38 1.08
e F / g
M 0.03 57.21 0.02 0.00 -0.36 1.06 B/Mg 11.91 32.16 3.83 14.66 -0.08 3.05
n M / g
M 0.03 62.91 0.02 0.00 -0.15 1.98 B/Fe 0.36 56.92 0.20 0.03 -0.44 0.83
n Z / g
M 0.17 86.79 0.15 0.02 0.06 0.49 B/Mn 0.38 69.67 0.27 0.06 0.01 3.58
u C / g
M 0.44 45.02 0.20 0.04 -0.23 0.54 B/Zn 1.72 77.16 1.33 1.61 0.13 0.66
B / g
M 0.09 27.52 0.03 0.00 0.04 1.53 B/Cu 4.88 38.06 1.86 3.45 -0.31 1.40
The mean concentrations of the nutrients used to generate the DRIS norms for the conditions of South of Brazil (Table 1) were inferior to those used by Singh et al. (2000), in India, for Mn, Zn and, mainly for Ca and Fe. For the other nutrients the concentrations were similar. For the conditions of New Zealand (Goh & Malakouti, 1992) and Hungary (Szücs et al., 1990; Szücs & Kállay, 1990), the concentrations of Ca were also superior to the ones obtained here.
The two criteria used for the choice of ratio order of nutrients: “R value” and “F value” selected different ratios, mainly when the nutrients P, K and Fe were involved (Table 2). For the “R value”, it is im-portant to mention that for most of the relationships among nutrients, lower relationships between the ra-tio of each pair of nutrients and the productivity of fruits were observed. Only for the relationships P/K, Fe/K, Fe/Mg, B/N, B/P and B/Fe correlation coeffi-cients were obtained greater than 0.40. In many of the cases, the choice of the relationship was accomplish-ment using very low correlation coefficients.
Having the DRIS norms defined, the standard procedure was established for the calculation of the DRIS indices, using the two criteria for the choice and the three methods most commonly used for DRIS stud-ies: proposed by Beaufils (1973), proposed by Jones (1981) and proposed by Elwali & Gascho (1984).
The correlation coefficient among the DRIS indices obtained (Table 3) indicates that positive and significant correlations are verified (P < 0.01) between the concentrations of nutrients and the respective DRIS indices, except for N. Lower relationships among the DRIS indexes for N and the concentration of N have also been observed for other perennial crops like cherry and hazelnut (Righetti et al., 1988), citrus (Salvo,
2001) and coffee plant (Reis Jr. et al., 2002). For N, the DRIS index is strongly dependent on the concen-tration of the other nutrients in the leaves, while for the other nutrients the DRIS indices are dependent on their own concentrations.
The “R-value” presented better adjustments among the DRIS indices and the concentrations of the nutrients for the methods Beaufils (1973) and Elwali & Gascho (1984), while the “F value” presented bet-ter adjustment among the DRIS indices and the con-centrations of the nutrients for the method Jones (1981).
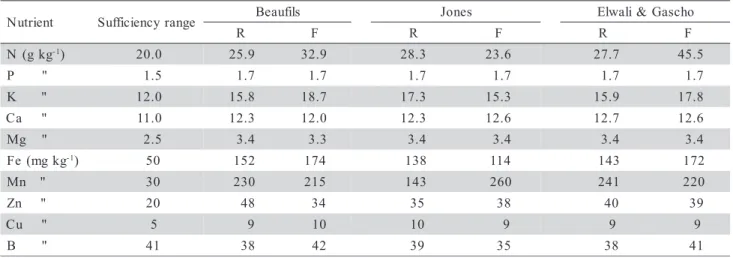
Considering that the plant presents nutritional balance for a given nutrient when the values of the in-dices, defined by the DRIS method, are closer to zero (Walworth & Summer, 1987), the nutrient concentra-tion was graphically established for the equivalent leaf (at nutritional balance), using the data adjustment. The point of nutritional balance, so defined, presents coin-cidence with the concentration considered normal for the criterion of sufficiency range (Basso et al., 1986), except for N, K and Mn, when the DRIS method indi-cated equivalent concentrations to greater than the con-centrations considered normal for the crop (Table 4). Conversely, the point of nutritional balance obtained by the DRIS methods for each nutrient was superior at the critical level (concentration that defines the in-ferior limit of the normal range (Basso et al., 1986)).
CONCLUSIONS
The two criteria (“R value” and “F value”) for the choice of the ratio order of nutrients selected dif-ferent ratios. The concentrations of the nutrients pre-sented positive and significant correlations (P < 0.01)
Table 3 - Coefficient of correlation among the concentration of nutrients in apple tree leaves and the respective DRIS indices for combinations of methods of choice of the ratios among nutrients (R and F values) for the methods Beaufils, Jones and Elwali & Gascho.
* *Significant at level of 1% for the test t; *Significant at level of 5% for the test t; NSnon-significant.
e l b a i r a
V Beaufils Jones Elwali&Gascho
t n e d n e p e d n
I Dependent R F R F R F
N IN 0.08* 0.02NS 0.06* 0.28** 0.06* 0.03NS
P IP 0.60** 0.59** 0.52** 0.57** 0.54** 0.50**
K IK 0.70** 0.54** 0.56** 0.89** 0.62** 0.30**
a
C ICa 0.45** 0.45** 0.48** 0.41** 0.30** 0.32**
g
M IMg 0.69** 0.70** 0.64** 0.62** 0.64** 0.65**
B IB 0.50** 0.34** 0.48** 0.84** 0.41** 0.19**
u
C ICu 0.72** 0.59** 0.66** 0.77** 0.69** 0.53**
e
F IFe 0.81** 0.70** 0.78** 0.89** 0.84** 0.69**
n
M IMn 0.41** 0.47** 0.81** 0.30** 0.40** 0.46**
n
with the respective DRIS indices, except for N. The defined DRIS norms are applicable for the nutritional diagnosis of the apple tree.
REFERENCES
BASSO, C.; WILMS, F.W.W.; SUZUKI, A. Fertilidade do solo e nutrição de plantas. In: EMPRESA CATARINENSE DE PESQUISA AGROPECUÁRIA. Manual da cultura da macieira. Florianópolis: EMPASC-DID, 1986. p.236-265.
BATAGLIA, O.C.; SANTOS, W.R. Efeito do procedimento de cálculo e da população de referência nos índices do sistema integrado de diagnose e recomendação (DRIS). Revista Brasileira de Ciência do Solo, v.14, p.339-344, 1990.
BEAUFILS, E.R. Diagnosis and recommendation integrated system (DRIS). A general scheme for experimentation and calibration based on principles developed from research in plant nutrition. Pietermararitzburg: University of Natal, 1973. 132p. (Soil Science Bulletin, 1).
COSTA, A.N. Sistema integrado de diagnose e recomendação (DRIS).
Boletim Informativo da Sociedade Brasileira de Ciência do Solo,
v.24, p.13-15, 1999.
ELWALI, A.M.O.; GASCHO, G.J. Soil testing, foliar analysis, and DRIS as guide for sugarcane fertilization. Agronomy Journal, v.76, p.466-470, 1984.
FREIRE, C.J.S. Manual de métodos de análise de tecido vegetal, solo e calcário. Pelotas: EMBRAPA, CPACT, 1998. 208p.
GOH, K.M.; MALAKOUTI, M.J. Preliminary nitrogen, phosphorus, potassium, calcium and magnesium DRIS norms and indices for apple orchards in Canterbury, New Zealand. Communications in Soil Science and Plant Analysis, v.23, p.1371-1385, 1992.
JONES, C.A. Proposed modifications of the diagnosis and recommendation integrated system (DRIS) for interpreting plant analysis. Communications in Soil Science and Plant Analysis, v.12, p.785-794, 1981.
LETZSCH, W.S. Computer program for selection of norms for use in the diagnosis and recommendation integrated system (DRIS).
Communications in Soil Science and Plant Analysis, v.16, p.339-347, 1985.
t n e i r t u
N Sufficiencyrange Beaufils Jones Elwali&Gascho
R F R F R F
g k g (
N -1) 20.0 25.9 32.9 28.3 23.6 27.7 45.5
P " 1.5 1.7 1.7 1.7 1.7 1.7 1.7
"
K 12.0 15.8 18.7 17.3 15.3 15.9 17.8
" a
C 11.0 12.3 12.0 12.3 12.6 12.7 12.6
g
M " 2.5 3.4 3.3 3.4 3.4 3.4 3.4
g k g m ( e
F -1) 50 152 174 138 114 143 172
" n
M 30 230 215 143 260 241 220
" n
Z 20 48 34 35 38 40 39
" u
C 5 9 10 10 9 9 9
B " 41 38 42 39 35 38 41
Table 4 - Critical level considering the criterion of sufficiency range (Basso et al., 1986) and obtained for combinations of methods of choice for the ratio order among nutrients (R and F values) and DRIS indices (methods Beaufils, Jones and Elwali & Gascho).
MAGNANI, M.; FREIRE, C.J.S.; CHOER, E. Manual para análise foliar: macieira. 3.ed. Pelotas: EMBRAPA, CPACT, 1997. 7p. (Documentos, 34).
NICK, J.A. DRIS para cafeeiros podados. Piracicaba:USP/ESALQ, 1998. 86p. (Dissertação - Mestrado).
REIS JR., R.A.; CORRÊA, J.B.; CARVALHO, J.G.; GUIMARÃES, P.T.G. Estabelecimento de normas DRIS para o cafeeiro no Sul de Minas Gerais. 1ª aproximação. Ciência Agrotécnica, v.26, p.269-282, 2002.
RIGHETTI, T.L.; ALKOSHAB, O.; WILDER, K. Verifying critical values from DRIS norms in sweet cherry and hazelnut.
Communications in Soil Science and Plant Analysis, v.19, p.1449-1466, 1988.
SALVO, J.G. Uso do DRIS na avaliação do estado nutricional de plantas cítricas afetadas pela clorose variegada dos citros. Piracicaba: USP/ ESALQ, 2001. 108p. (Dissertação - Mestrado).
SAS INSTITUTE. SAS User’s guide: statistics. 5.ed. Cary, N.C., 1985. 956p.
SINGH, N.P.; AWASTHI, R.P.; SUD, A. Diagnosis and recommendation integrated system (DRIS) norms for apple (Malus x Domestica Borkh. L. CV. Starking Delicious) in Himachal Pradesh. Indian Journal of Horticulture, v.57, p.196-204, 2000.
SZÜCS, E.; KÁLLAY, T. Determination of fruiting capacity of apple trees (Malus domestica) by DRIS. In: INTERNATIONAL PLANT NUTRITION COLLOQUIUM, 11., Wageningen, 1989. Annals.
Dordrecht: Kluwer Academic Publishers, 1990. p.717-721. SZÜCS, E.; KÁLLAY, T.; SZENCI, G. Determination of DRIS indices
for apple (Malus domestica Borkh). Acta Horticulturae, n.274, p.443-453, 1990.
WALWORTH, J.L.; SUMMER, M.E. The diagnosis and recommendation integrated system (DRIS). Advances in Soil Sciences, v.6, p.149-188, 1987.