Comparative Analysis of Measurements Power
Harmonics
Tiago S. S. Lino, Renato Deslandes, Fernando N. Belchior, IEEE Member, Paulo F. Ribeiro, IEEE Fellow Member Federal University of Itajubá, Itajubá – MG, Brazil
Abstract This paper aims to evaluate the performance of commercial power quality (PQ) instruments. By using a high precision programmable voltage and current source, two meters from different manufacturers are analyzed and compared. The analyses contemplate the injection of voltage and current signals applied under different conditions, with and without harmonic, in order to obtain the measurements of electrical powers and power factors. In order to facilitate the conclusions on these measurements, the data obtained were compared with a program developed in LabVIEW. One of the tests showed that the active power is not based on the theory presented. This work is relevant considering that Brazil is deploying standardization in terms of power quality measurements aiming towards regulatory procedures and index limits.
Index Terms Performance Analysis, Commercial Power Quality Instruments, Electrical Power, power factor.
I.INTRODUCTION
Power Quality (PQ) is an important subject for electric utilities by several reasons; among them the need to develop rules that provide means to measure, in an appropriate way, the PQ indices. Power Quality is related to a set of parameters about disturbances in voltage and current with goals of monitoring, mitigating, regulating, making possible the distribution of electricity to end users according to accepted requirements for normal operation of the electrical distribution system and characteristics of voltage (magnitude, frequency, symmetry, waveform etc.). Poor PQ indices affect functioning of utilities, different industrial units, productions, customer services and other system performance and operating costs [1].
The increased requirements on supervision, control, and performance in modern power systems make power quality monitoring a required practice for utilities. Some electronic devices, such as microprocessors, micro-controllers, sensitive computerized equipment and telecommunications equipment, etc., use ground as the reference for all their internal operations and connect throughout the plant. This makes them susceptible to ground differences and to power quality problems. Power disturbances compromise product quality, increase downtime, and reduce customer satisfaction. By knowing the amount of harmonics, transient impulses and noise distortion in the system, it is possible to take appropriate actions to reduce the harmful effects [1], [2]. Consequently, there is an ever increasing need for power quality monitoring systems. This performance analysis is of particular interest because it has been found that different PQ
instruments fully meeting characteri1stics prescribed in the standards may still disagree significantly in some specific actual measurements [3], [4], [5], [6]. It is important to mention that most references listed in this paper about PQ monitoring are consistent with the IEC framework [6], [7]. In Brazil there is not yet a standardization of measurement protocols for PQ instruments and different values of the same phenomenon may be presented by instruments of different manufacturers [3].
Paper [4] moves into a direction of definition of a test protocol to perform a full metrological characterization of measurement instrument for power quality monitoring. These testing protocols aim to reproduce the PQ situations associated with voltage and current signals.
Papers [5], [8] describe voltage harmonic distortion measurements in a laboratory-based comparison of power quality class A analyzers. The tested measuring instruments were designed in accordance to the requirements of the IEC 61000-4-30 standard. [6]. Four tests have indicated the variation of ±5%, based on the measured value.
Paper [9] presents an implementation of a test system for advanced calibration and performance verification of flickermeter. This is justified because it can be shown that different digital flickermeter implementations that fully meet performance tests defined in IEC 61000-4-15 [10] can still disagree significantly in some actual measurements.
With the focus on energy meters, paper [11] proposes a methodology to guide the verification of single-phase energy meters under sinusoidal and nonsinusoidal conditions. A design of an experiment that allows the testing meters under a combination of disturbances showing positive and negative correlations are described. A hardware and software system to perform verification procedures in complex situations is also presented.
It is also important to consider the calibration on the instruments. In this context, paper [12] proposes an innovative procedure, based on the Monte Carlo method. Starting from the determination of the probability density function of the uncertainty contribution of every device from the signal input stage to the analog-to-digital conversion stage, this procedure estimates the probability density function of the measurement results and the measurement standard uncertainty as the standard deviation associated with this function. The result of the experimental work done on a prototype of a power quality measuring instrument is reported.
1
Considering PQ monitoring by virtual instrumentation, it is common the use of the LabVIEW platform. References [13], [14], [15], [16], [17] and [18] give the development of a power quality monitoring system that is suitable for utilities and end-users. With virtual instrumentation, engineers and researchers can reduce development time, design higher quality products, lower their design costs, and keep close watch on waveforms. This helps in the efficient use of electric power, and systems reliability.
In this direction, using software developed at the LabVIEW platform, this paper aims to show a comparative analysis of PQ instruments considering angular displacement and/or harmonics injection. Voltage and current disturbances are injected, using a OMICRON voltage and current programmable source, and the different electric powers are compared with. The analysis involves active, reactive and apparent powers and displacement and true power factor.
II.DEFINITIONS TO POWER MEASUREMENTS
To determine the electrical power of the tests performed on the influence of harmonic distortion, a program in LabVIEW was developed considering the formulation of [2], and the results have been used as reference.
A. Active Power (P)
𝑃 = ∑ℎ=𝑚á𝑥ℎ=1 𝑉ℎ∗ 𝐼ℎ∗ 𝑐𝑜𝑠𝜃ℎ
[W] (1) Where:
h: Harmonic order;
Vh: Voltage rms value of hth order harmonic; Ih: Current rms value of hth order harmonic; θh: Displacement between the voltage and current of
harmonic order h.
B. Reactive Power (Q)
𝑄 = ∑ℎ=𝑚á𝑥ℎ=1 𝑉ℎ∗ 𝐼ℎ∗ 𝑠𝑒𝑛𝜃ℎ [Var] (2)
C. Apparent Power (S)
𝑆 = 𝑉𝑟𝑚𝑠∗ 𝐼𝑟𝑚𝑠= √∑ℎ=1ℎ=𝑚á𝑥𝑉ℎ2∗ ∑ℎ=𝑚á𝑥ℎ=1 𝐼ℎ2 [VA] (3) Where:
Vrms: True voltage rms value;
Irms: True current rms value.
𝑉𝑟𝑚𝑠 = √∑ℎ=𝑚á𝑥ℎ=1 𝑉ℎ2 [V] (4)
𝐼𝑟𝑚𝑠= √∑ℎ=𝑚á𝑥ℎ=1 𝐼ℎ2 [A] (5)
D. Distortion Reactive Power (D)
𝐷 = √𝑆2− 𝑃2− 𝑄2 [Var] (6)
E. Total Reactive Power (QT)
𝑄𝑇 = √𝐷2+ 𝑄2 [Var] (7)
Due to the interaction between harmonic components of voltage and current, the triangle of power is no longer satisfied, because:
𝑆2> 𝑃2+ 𝑄2 (8)
So the graphical representation proposed in [2] is shown in Fig. 1.
Fig. 1. Tetrahedron powers
Where:
P: Active Power; S: Apparent Power; Q: Reactive Power;
D: Distortion Reactive Power; QT: Total Reactive Power.
Observing to new graphic representation is possible determine the displacement power factor (due to fundamental frequency of voltage and current) and the true power factor.
F. Displacement Power Factor (DPF):
𝐷𝑃𝐹 = cos (𝜃1) (9)
G. True Power Factor: T𝑃𝐹 =𝑃
𝑆= cos(𝜃) (10)
III.GENERATING ELECTRICAL SIGNALS
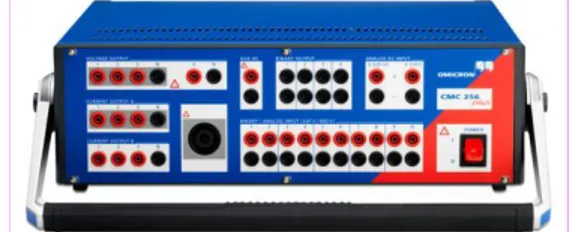
The voltage and current signals were generated by the OMICRON CMC 256-6 (Fig. 2) programmable source and applied to the PQ instruments, with high-accuracy. For voltage and current the accuracy is less than 0.05%.
Fig. 2. OMICRON CMC 256-6 programmable source.
The electric powers and power factors showed in equations (1) to (7) were calculated using software developed at the LabVIEW platform. For this, the DAQ Acquisition NI USB-6212 (Fig. 3) [19] was used, with 16 bits of resolution, voltage transducer (0.2% of error) and a current transducer (0.15% of error).
IV.ELECTRIC POWER MEASUREMENTS
As mentioned, it was considered at the LabVIEW software the active power (P), the reactive power (Q), the apparent power (S) and the power factors (TPF and DPF) results. As the OMICRON programmable source is able to generate voltage and current, it was not necessary to use of electrical real loads.
It was analyzed three situations test in three-phase circuits: A. Balanced and sinusoidal voltages and currents (inductive
70 degrees);
B. Balanced sinusoidal voltages and distorted currents; C. Balanced distorted voltages and currents.
V.LABORATORY TESTS
Two commercial instruments, denoted as Class S and Class A [6], were used. It is important to highlight that the used Class A monitor does not show the (TPF) and the Class S does not show the DPF.
A. Test 1
The Table II shows the values of voltage (Volts) and current (Amps) of each phase used in this test, and their respective phase angles (in degrees).
TABLE II.VOLTAGES AND CURRENTS USED IN THE TEST 1. Va1 Phase Va1 Vb1 Phase Vb1 Vc Phase Vc1 100 0 100 -120 100 120 Ia1 Phase Ia1 Ib1 Phase Ib1 Ic1 Phase Ic1
5 -70 5 -190 5 50
The results are shown in Table III.
TABLE III.RESULTS OF TEST 1.
S_a (VA) S_b (VA) S_c (VA)
LabVIEW 500 500 500
Class S / Error (%) 504 / 0.8 495 / 1 494 / 1.2 Class A / Error (%) 500.07 / 0.01 499.07 / 0.19 499.51 / 0.1
P_a (W) P_b (W) P_c (W) LabVIEW 171.01 171.01 171.01 Class S / Error (%) 167 / 2.34 168 / 1.76 168 / 1.76 Class A / Error (%) 170.9 / 0.06 170.23 / 0.46 171.31 / .17 QT_a (Var) QT_b (Var) QT_c (Var) LabVIEW 469.846 469.846 469.846 Class S / Error (%) 475 / 1.1 465 / 1.03 464 / 1.24 Class A / Error (%) 470.03 / 0.4 469.13 / 0.15 469.18 / 0.14
TPF_a TPF_b TPF_c
LabVIEW 0.342 0.342 0.342
Class S / Error (%) 0.332 / 2.92 0.34 / 0.59 0.34 / .59
Class A / Error (%) - - -
DPF_a DPF_b DPF_c
LabVIEW 0.342 0.342 0.342
Class S / Error (%) - - - Class A / Error (%) 0.34 / 0.59 0.34 / 0.59 0.34 / 0.59
It can be noticed that the results coming from Class A instrument have achieved lower error, even so it can be said that the two instruments obtained good results.
B. Test 2
The Table IV shows the values of voltage (Volts) and current (amps) of each phase used in this test, and their respective phases (in degrees).
The results are shown in Table V.
TABLE IV.VOLTAGES AND CURRENTS USED IN THE TEST 2. Va1 Phase Va1 Vb1 Phase Vb1 Vc Phase Vc1
100 0 100 -120 100 120
Ia1 Phase Ia1 Ib1 Phase Ib1 Ic1 Phase Ic1
2.7 0 2.7 -120 2.7 120
Ia3 Phase Ia3 Ib3 Phase Ib3 Ic3 Phase Ic3
2.43 0 2.43 0 2.43 0
Ia5 Phase Ia5 Ib5 Phase Ib5 Ic5 Phase Ic5 2.16 0 2.16 120 2.16 -120
Ia7 Phase Ia7 Ib7 Phase Ib7 Ic7 Phase Ic7 1.62 0 1.62 -120 1.62 120
Ia9 Phase Ia9 Ib9 Phase Ib9 Ic9 Phase Ic9
1.35 0 1.35 0 1.35 0
Ia11 Phase Ia11 Ib11 Phase Ib11 Ic11 Phase Ic11 0.945 0 0.945 120 0.945 -120
Ia13 Phase Ia13 Ib13 Phase Ib13 Ic13 Phase Ic13 0.54 0 0.54 -120 0.54 120
TABLE V.THE TEST RESULTS 2.
S_a (VA) S_b (VA) S_c (VA) LabVIEW 484.686 484.686 484.686 Class S / Error (%) 494 / 1.92 494 / 1.92 495 / 2.13 Class A / Error (%) 482.2 / 0.51 481.24 / 0.71 482.88 / 0.37
P_a (W) P_b (W) P_c (W)
LabVIEW 270 270 270
Class S / Error (%) 274 / 1.48 275 / 1.85 274 / 1.48 Class A / Error (%) 269.88 / 0.04 269.41 / 0.22 270.24 / 0.1
QT_a (Var) QT_b (Var) QT_c (Var) LabVIEW 402.517 402.517 402.517 Class S / Error (%) 411 / 2.11 412 / 2.36 413 / 2.6 Class A / Error (%) 399.6 / 0.73 398.76 / 0.93 400.18 / 0.58
TPF_a TPF_b TPF_c LabVIEW 0.557 0.557 0.557 Class S / Error (%) 0.555 / 0.36 0.556 / 0.18 0.554 / 0.54
Class A / Error (%) - - -
DPF_a DPF_b DPF_c
LabVIEW 1 1 1
Class S / Error (%) - - -
Class A / Error (%) 1 / 0 1 / 0 1 / 0
In this test the results of the two instruments were also satisfactory, remaining best results of meter Class A.
With the results of test 1, which only has angular displacement between voltage and current, and with the results of test 2, which does not have angular displacement, but only harmonic distortion in current signal, it can be concluded that the meters are really providing total reactive power, composed by both the reactive power and the distortion reactive power, as well as shows in (7).
C. Test 3
The Table VI shows the values of voltage (Volts) and current (Amps) of each phase used in this test, and their respective phases (in degrees).
The results are shown in Table VII.
𝑃1= 𝑉1∗ 𝐼1∗ 𝑐𝑜𝑠𝜃1 [W] (11)
𝑃1 = 100 ∗ 2.7 ∗ 𝑐𝑜𝑠70° = 92.345 [W] (12)
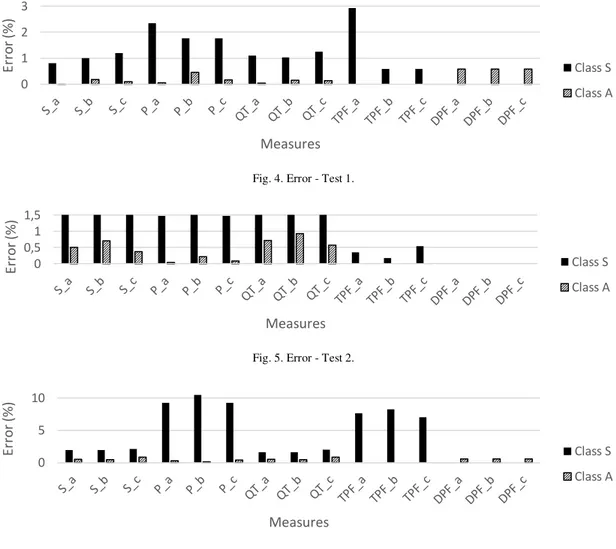
For best viewing, the obtained error values are shown in the Figs 4, 5 and 6.
TABLE VI.VOLTAGES AND CURRENTS USED IN THE TEST 3. Va1 Phase Va1 Vb1 Phase Vb1 Vc1 Phase Vc1
100 0 100 -120 100 120
Va3 Phase Va3 Vb3 Phase Vb3 Vc3 Phase Vc3
10 0 10 0 10 0
Va5 Phase Va5 Vb5 Phase Vb5 Vc5 Phase Vc5
10 0 10 120 10 -120
Va7 Phase Va7 Vb7 Phase Vb7 Vc7 Phase Vc7
9 0 9 -120 9 120
Va9 Phase Va9 Vb9 Phase Vb9 Vc9 Phase Vc9
8 0 8 0 8 0
Va11 Phase Va11 Vb11 Phase Vb11 Vc11 Phase Vc11
6 0 6 120 6 -120
Va13 Phase Va13 Vb13 Phase Vb13 Vc13 Phase Vc13
5 0 5 -120 5 120
Ia1 Phase Ia1 Ib1 Phase Ib1 Ic1 Phase Ic1
2.7 -70 2.7 -190 2.7 50
Ia3 Phase Ia3 Ib3 Phase Ib3 Ic3 Phase Ic3 2.43 -210 2.43 -210 2.43 -210
Ia5 Phase Ia5 Ib5 Phase Ib5 Ic5 Phase Ic5 2.16 10 2.16 130 2.16 -110
Ia7 Phase Ia7 Ib7 Phase Ib7 Ic7 Phase Ic7 1.62 -130 1.62 110 1.62 -10
Ia9 Phase Ia9 Ib9 Phase Ib9 Ic9 Phase Ic9
1.35 90 1.35 90 1.35 90
Ia11 Phase Ia11 Ib11 Phase Ib11 Ic11 Phase Ic11 0.945 -50 0.945 70 0.945 190
Ia13 Phase Ia13 Ib13 Phase Ib13 Ic13 Phase Ic13 0.54 -190 0.54 50 0.54 -70
TABLE VII.THE RESULTS OF TEST 3.
S_a (VA) S_b (VA) S_c (VA) LabVIEW 494.427 494.427 494.427 Class S / Error (%) 504 / 1.94 504 / 1.94 505 / 2.14 Class A / Error (%) 492.01 / 0.49 492.2 / 0.45 490.38 / 0.82
P_a (W) P_b (W) P_c (W) LabVIEW 84.187 84.187 84.187 Class S / Error (%) 92 / 9.28 93 / 10.47 92 / 9.28 Class A / Error (%) 84.44 / 0.3 84.07 / 0.14 83.86 / 0.39
QT_a (Var) QT_b (Var) QT_c (Var) LabVIEW 487.207 487.207 487.207 Class S / Error (%) 495 / 1.6 495 / 1.6 497 / 2.01 Class A / Error (%) 484.71 / 0.51 484.96 / 0.46 483.15 / 0.83
TPF_a TPF_b TPF_c
LabVIEW 0.17 0.17 0.17
Class S / Error (%) 0.183 / 7.65 0.184 / 8.24 0.182 / 7.06
Class A / Error (%) - - -
DPF_a DPF_b DPF_c LabVIEW 0.342 0.342 0.342
Class S / Error (%) - - -
Class A / Error (%) 0.34 / 0.59 0.34 / 0.59 0.34 / 0.59
D. Performance of the instruments
Table VIII is used to qualify the instruments, based on [3].
TABLE VIII.ERROR XSCORE. Error (%) Range Score 0 ≤ Error (%) ≤ 5 10 5 < Error (%) ≤ 10 5 10 < Error (%) ≤ 20 2 20 < Error (%) 0
The mean punctuation value determined for each instrument per index is considered. Depending on the result, the instrument is qualified as having excellent, good, regular, or inferior performance as shown in Table IX.
TABLE IX.QUALIFICATION X SCORE
Qualification Score Range Excellent 10 < Score < 9
Good 9 < Score < 7 Regular 7 < Score < 4 Inferior Less than 4
Using this procedure, the Table X presents the final instrument classification.
TABLE X.PERFORMANCE INSTRUMENTS IN ACCORDANCE WITH ERROR
RANGE
Classification
Meters S P QT TPF DPF
Class S Excellent Good Excellent Good - Class A Excellent Excellent Excellent - Excellent
VII.CONCLUSIONS
Generally, PQ monitoring instruments do not present the same results when subjected to the same disturbance. This problem continues to be a challenge for the power quality community (utilities, customers, manufacturers, research centers, and regulators) and has motivated many comparative instrument surveys, as the one presented in this paper. This work analyzed results of measurements of electrical power and power factor from two power quality instruments, comparing them with results, considered as reference, software developed in LabVIEW.
It could be observed that the power factor supplied by the Class A meter is, in fact, the displacement factor. Already the Class S meter provides the true power factor.
The results were very satisfactory for the Class A instrument and also for the values of apparent power and reactive power coming from Class S instrument.
Fig. 4. Error - Test 1.
Fig. 5. Error - Test 2.
Fig. 6. Error - Test 3.
VII.REFERENCES
[1] R. C. Dugan; M. F. McGranaghan; S. Santoso; H. W. Beaty, “Electrical Power Systems Quality”, 3rd. Ed., McGraw-Hill, 2012.
[2] J. Arrillaga; N. R. Watson, “Power System Harmonics”, 2nd edition, Inglaterra, Wiley, 2003.
[3] P. F. Ribeiro; D. O. C. Brasil; J. R. Medeiros; J. C. Oliveira; A. C. Delaiba, “Considerations on power quality measurements and measurement instrumentation,” 7ª EPQU - International Conference on Electrical Power Quality and Utilisation, 2003.
[4] A. D. Femine; D. Gallo; C. Landi; M. Luiso, “Performance Analysis of Power Quality Monitoring Instruments. IEEE International Instrumentation and Measurement Technology Conference, Canada, 2008.
[5] K. Chmielowiec; M. Zietek; K. Piatek; A. Firlit; R. Szkoda; et al, “Comparative tests of power quality analyzers - harmonic distortion”,
IEEE 15th International Conference on Harmonics and Quality of Power (ICHQP), 2012.
[6] IECElectromagnetic Compatibility (EMC) - Part 4-30: Testing and Measurements Techniques – Power Quality Measurement Methods,
IEC 61000-4-30, 2008.
[7] IEC 62586-1 - Power quality measurement in power supply systems - Part 1: Power quality instruments, 2013.
[8] R. P. Bingham, ‘Recent Advancements in Monitoring the Quality of the Supply”, Power Engineering Society Summer Meeting, 2001. [9] D. Gallo; C. Landi; R. Langella; A. Testa, “Implementation of a Test
System for Advanced Calibration and Performance Analyses of Flickermeters”, IMTC - Instrumentation and Measurement Technology Conference. 2003.
[10] IEC Electromagnetic compatibility (EMC) - Part 4-15: Testing and measurement techniques - Flickermeter - Functional and design specifications, IEC 61000-4-15 Ed 2; 2010.
[11] D. Gallo; C. Landi; N. Pasquino; N. Polese, “A New Methodological Approach to Quality Assurance of Energy Meters Under Nonsinusoidal
Conditions”; IEEE Transactions on Instrumentation and Measurement,
vol. 56, no. 5, October 2007.
[12] A. Ferrero; M. Lazzaroni; S. Salicone, “A calibration procedure for a digital instrument for electric power quality measurement”, IEEE Transactions on Instrumentation and Measurement, vol. 51, no. 4, August 2002.
[13] S. H. Laskar; M. Muhammad, “Power Quality Monitoring by Virtual Instrumentation using LabVIEW”, 46th International Engineering Conference (UPEC), 2011.
[14] S. K. Bath; S. Kumra; “Simulation and Measurement of Power Waveform Distortions using LabVIEW”, IEEE International Power Modulators and High Voltage Conference, 2008.
[15] D. Pradhan; L. Lakshminarayanan; V. Patil, “A LabVIEW based power analyzer”, International Conference on Advances in Energy Conversion Technologies (ICAECT), 2014.
[16] Y. Y. Phang; M. V. Chilukuri, “Remote power quality monitoring and analysis system using LabVIEW software”, IEEE Conference on Instrumentation and Measurement Technology, 2009.
[17] I. Búa-Núñez; J. E. Posada-Román; J. Rubio-Serrano; J. A. Garcia-Souto, “Instrumentation System for Location of Partial Discharges Using Acoustic Detection With Piezoelectric Transducers and Optical Fiber Sensors”, IEEE Transactions on Instrumentation and Measurement, vol. 63, no. 5, May 2014.
[18] A. P. J. Chandra; C. R. Venugopal, “Novel Design Solutions for Remote Access, Acquire and Control of Laboratory Experiments on DC Machines”, IEEE Transactions on Instrumentation and Measurement, vol. 61, no. 2, February 2012.
[19]DAQ Acquisition N IUSB 6212 <http://sine.ni.com/nips/cds/view/p/ lang/pt/nid/207096>, accessed in 2015-02-19.
0 1 2 3
E
rr
o
r
(%)
Measures
Class S
Class A
0 0,5 1 1,5
E
rr
o
r
(%)
Measures
Class S
Class A
0 5 10
E
rr
o
r
(%)
Measures
Class S