Engineering
ISSN: 1809-4430 (on-line)
_________________________
2 Universidade Federal de Campina Grande, Campina Grande, Brasil.
MILK PRODUCTION AS AN INDICATOR OF DROUGHT VULNERABILITY OF CITIES LOCATED IN THE BRAZILIAN SEMIARID REGION
Doi:http://dx.doi.org/10.1590/1809-4430-Eng.Agric.v37n6p1203-1212/2017
TAFNES DA S. ANDRADE1*, JOHN E. DE B. L. CUNHA2, 3,
CARLOS DE O. GALVÃO2, 4,IANA A. A. RUFINO2
1*Corresponding author. Agência Estadual de Meio Ambiente/ Garanhuns - PE, Brasil.
E-mail: [email protected]
ABSTRACT: Several spectral indices have been used to estimate droughts, however, these indicators only give evidence of a dry spell leaving out its impacts on significant economic activities performed in a given region. In this context, livestock breeding in one of the most important activities to analyze in the Brazilian semiarid region. The aim of this study was to evaluate the relationship between the drought indices, obtained through remote sensory devices, and annual milk production (2004 – 2014), identifying the most affected cities by the drought and were considered the most vulnerable and in need of special attention during dry periods. In order to analyze the data, the hierarchical grouping technique and correlation analyses between milk production and VCI - Vegetation Condition Index, TCI - Temperature Condition Index, VHI - Vegetation Health Index, PCI - Precipitation Condition Index and SDCI - Scaled Drought Condition indices were used. The intense correlation between milk production and the drought indices may be related to the dependency of the cities’ economies on natural resources. On the other
hand, the diversification of the cities’ economic activities may enable access to various resources
and drought vulnerability reduction.
KEYWORDS: drought management, drought indices, livestock.
INTRODUCTION
Nowadays, several indices are used to monitor droughts and most of them are based on hydroclimatic, edaphic and physical variables. However, droughts are phenomena which cause mostly socioeconomic impacts. Hence, an appropriate index used to monitor the drought of a given region is expected to adjust itself to the respective local socioeconomic impacts.
Livestock production stands out in drought impact evaluations since it is one of the main
economic activities of Brazil’s semiarid regions. The animals complement the population’s
alimentation, are used to transport people and cargo, have higher resistance to droughts when compared to plants, and act as an alternative for subsistence during droughts, ergo become a type of family savings account (Coutinho et al., 2013; Ferreira & Urbano, 2013; Cândido et al., 2015).
One of the main negative impacts of droughts on cattle raising is the limitation of forage
production, which is basically composed of the region’s native pasture, heavily influenced by the
seasonality of the climate, and, consequently, the rainy season (Lima Júnior et al., 2013; Mcclaran & Wei, 2014). Scarcity or lack of nourishment make the animals lose weight, reducing the quality of the derivatives, and in extreme cases, death, which threatens the whole livestock production chain (Kachergis et al., 2014).
estimate the pasture loss (Chantarat et al., 2013; Vrieling et al., 2014; Takahashi et al., 2016). Therefore, there is a need to intensify (deepen) the relationship between these indices and the aspects related to cattle raising.
This study aimed to evaluate the correlation between drought indices from remote sensing products (devices) and milk production in the semiarid region of the State of Paraíba. As a premise, the milk producing cities directly affected by droughts are more socioeconomically vulnerable, demanding more attention from officials in prolonged drought periods.
MATERIAL AND METHODS
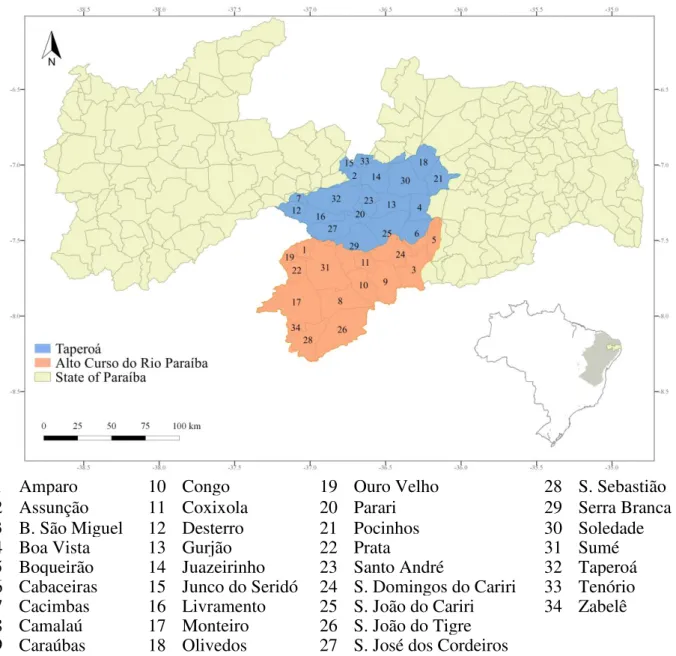
The area evaluated in this study includes the cities belonging to the Taperoá and upper Paraíba river basins (Figure 1). The region presents elevated temperature, small thermic variations, rain with great spatial and temporal variability. Its economy is based on extensive livestock production, mainly cattle and goats, which is carried out in small family managed lands (Alves et al., 2015; Pereira & Alcântara, 2015). The raising of the animals is semi-confined, the milking system is manual and natural estrus, with no refrigeration and low daily productivity of milk (Cândido et al., 2015; Clementino et al., 2015).
1 Amparo 10 Congo 19 Ouro Velho 28 S. Sebastião
do
2 Assunção 11 Coxixola 20 Parari 29 Serra Branca
3 B. São Miguel 12 Desterro 21 Pocinhos 30 Soledade
4 Boa Vista 13 Gurjão 22 Prata 31 Sumé
5 Boqueirão 14 Juazeirinho 23 Santo André 32 Taperoá
6 Cabaceiras 15 Junco do Seridó 24 S. Domingos do Cariri 33 Tenório
7 Cacimbas 16 Livramento 25 S. João do Cariri 34 Zabelê
8 Camalaú 17 Monteiro 26 S. João do Tigre
9 Caraúbas 18 Olivedos 27 S. José dos Cordeiros
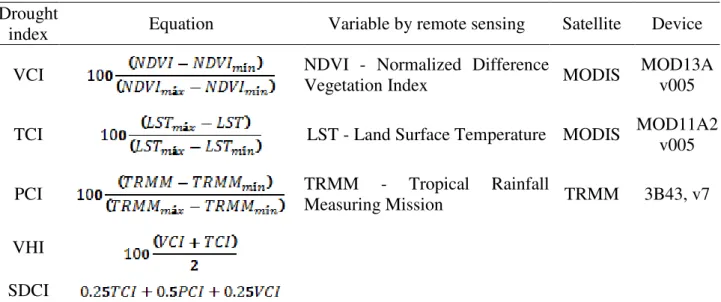
The VCI - Vegetation Condition Index and TCI - Temperature Condition Index (Kogan, 1995) were used to consider the aspects related to vegetation and temperature, along with the VHI - Vegetation Health Index (Kogan, 1997), which is a combination of the first two indices. The other indices used were the PCI - Precipitation Condition Index (Rhee et al., 2010; Du et al., 2013), regarding the rainfall obtained through remote sensing; and the SDCI - Scaled Drought Condition Index (Rhee et al., 2010), which is a linear combination of TCI, PCI and VCI.
Table 1 contains some information about the products used in the estimations of the indices. The information was obtained from a data bank maintained by NASA EOSDIS Land Processes Distributed Active Archive Center on the USGS/Earth Resources Observation and Science Center, Sioux Falls, South Dakota. The MOD13A3 (NASA, 2016a) product regards the monthly composition of the Normalized Difference Vegetation Index (NDVI) and the MOD11A2 (NASA, 2016b) considers the superficial temperature (Land Surface Temperature - LST) available every eight days, both with 1 km resolution. On the other hand, the TRMM 3B43 (NASA, 2016c) measures the monthly rainfall rate (mm/h) with 0.25º (± 25 x 25 km) spatial resolution.
TABLE 1. Description of drought indices by remote sensing.
Drought
index Equation Variable by remote sensing Satellite Device
VCI NDVI - Normalized Difference
Vegetation Index MODIS
MOD13A v005
TCI LST - Land Surface Temperature MODIS MOD11A2
v005
PCI TRMM - Tropical Rainfall
Measuring Mission TRMM 3B43, v7
VHI
SDCI
Where: NDVImax, NDVImin, LSTmax, LSTmin, and TRMMmax, TRMMmin are the highest and lowest results of NDVI, LST, and TRMM, respectively, in the time series of each point.
The indices were estimated on a monthly scale and, later, the annual average was calculated to compose the reference values and compare them to the milk production data. The total annual milk production was obtained from the database of the Brazilian Institute of Geography and Statistics (IBGE, 2016), available from 2004 through 2014.
Interviews were also conducted with technicians of EMATUR (Technical Assistance and Rural Extension Company of Paraíba State), to obtain information about the characteristics of milk production, especially on producers who deal with droughts. The interviews were conducted in a non-structured manner in order to broadly explore the matters related to the topic of interest.
RESULTS AND DISCUSSION
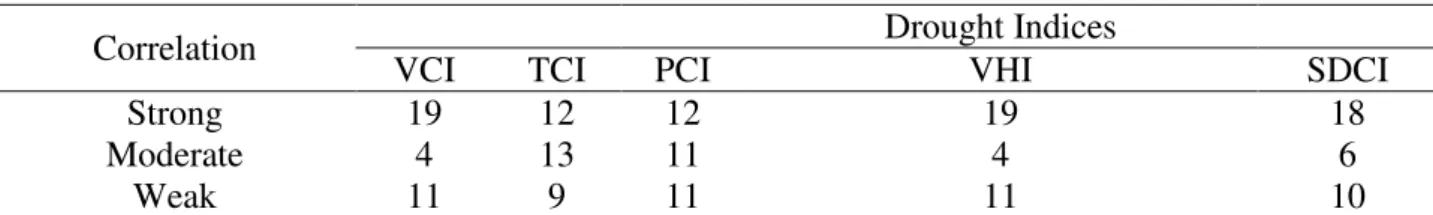
The best correlations among drought and milk production indices were observed for the indices: VCI, VHI, and SDCI. Twenty, of the thirty-four cities, presented strong correlation in at least one of the five indices (Figure 1; Table 2). Among them, 18 cities presented strong, 3 presented moderate and 9 presented low simultaneous correlation for the VCI, VHI, and SDCI. However, 4 cities presented no mutually consistent correlations with these three indices but did present other classes of correlation.
FIGURE 2. Correlation between drought indices and milk production in the 34 municipalities of the Taperoá and Upper Paraíba River basin, State of Paraíba.
TABLE 2. Number of municipalities by classes of correlation between drought indices and milk production.
Correlation Drought Indices
VCI TCI PCI VHI SDCI
Strong 19 12 12 19 18
Moderate 4 13 11 4 6
Weak 11 9 11 11 10
Milk production had strong correlations with vegetation indices, unlike with the rainfall indices, i.e. the overall correlations with PCI were weak. This fact can be related to the low sensibility of the TRMM sensor in detecting the broad spatial variability in the region, in relation to the size of the cities (see Figure 2). This sensor possesses 0.25º (± 25 x 25 km) of spatial resolution, which is inferior to that produced by MODIS, which is 1 km and is used for drought indices.
The low correlations with TCI show the weak influence of surface temperature in monitoring droughts. The TCI, which uses an LST, is better employed when combined with NDVI (Rhee et al., 2010; Son et al., 2012; Du et al., 2013; Hao et al., 2015), which gives superior information on the vegetation conditions, while LST is related solely to the hydric stress.
The cities of Monteiro, Boqueirão, Pocinhos, and Juazeirinho all presented: low correlations between the milk production and drought indices; populations larger than ten thousand inhabitants; and are among the seven cities with the highest milk production averages. Factors such as these can contribute to attract and diversify investments and infrastructure, reducing their economic dependence on rainfall.
The city of Taperoá presented moderate correlation with the drought indices, the highest milk production averages, and more than ten thousand inhabitants. Taperoá and Monteiro contain milk processing infrastructure, which attracts other investments and exerts influence on the neighboring cities. We verified that both the aforementioned cities use silage, small irrigation systems, and blood-red prickly pear(Opuntia ficus-indica) cultivation.
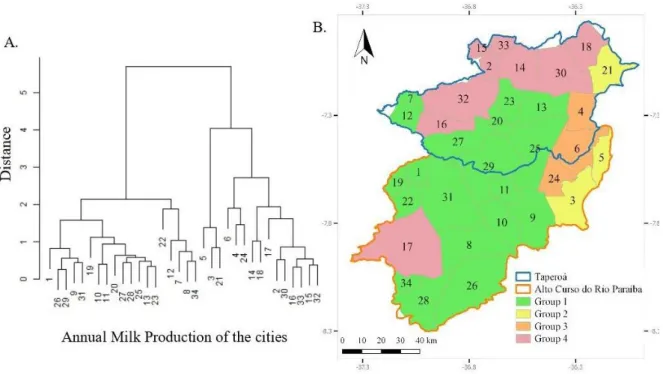
Once the existence of a correlation between the drought and milk production indices was established, we investigated the existence of groupings among the cities. Analyzing the dendrogram (Figure 3A), four groups were formed. The cities within the same group tended to have similar characteristics of milk production variation, but different characteristics from the other groups. Figure 3B shows the spatial distribution of the groups.
FIGURE 3. Dendrogram of milk production (A). Spatial distribution of groups in the study area (B).
Group 1: Formed by 19 cities, it presented an accentuated drop in milk production in 2012. With the exception of Prata (22), these cities stood out because of their strong correlation with the VCI, VHI, and SDCI indices. Additionally, this is the same group which presented the strongest correlation with the drought indices.
Group 2: Composed of three cities (3, 5 and 21), it presented small reductions in milk production in 2012 and weak correlation with drought indices. This was the only group to have higher production in 2013 than in 2012.
Group 3: Composed of three cities (4, 6 and 24), it presented reductions in milk production, having moderate results, between groups 1 and 2. Contrarily to what occurred in the other groups, which tended to stabilize or increase milk production from 2013 onwards, no recovery rates were found for these cities, with production falling off from 2013 to 2014.
Analyses of the groupings and the correlations suggest that cities from Group 1 have their economies strongly dependent on natural resources and are more affected by the droughts. These cities should be given help regarding the fulfillment of drought management strategies, especially in risk management, which should include continuous and proactive measures, aiming to reduce the negative effects, the economic losses and the costs associated with reactive and recovery actions.
Group 2’s milk production was the least affected by the drought and presented the weakest
correlations with the drought indices, being considered the least vulnerable group to the impacts caused by the drought. This condition can be credited to the use of small irrigation (systems or doses) and economic diversification.
Group 4 contains a few of the cities with the largest populations and highest milk production. Silage, small irrigation (systems or doses) and milk processing centers are all used in these cities. Their economies are heavily dependent on the livestock and agricultural activities, but they are also influenced by the services and mineral extraction sectors. The cities in Group 3 have similar characteristics, however, they continued to suffer production decreases in the years of 2013 and 2014.
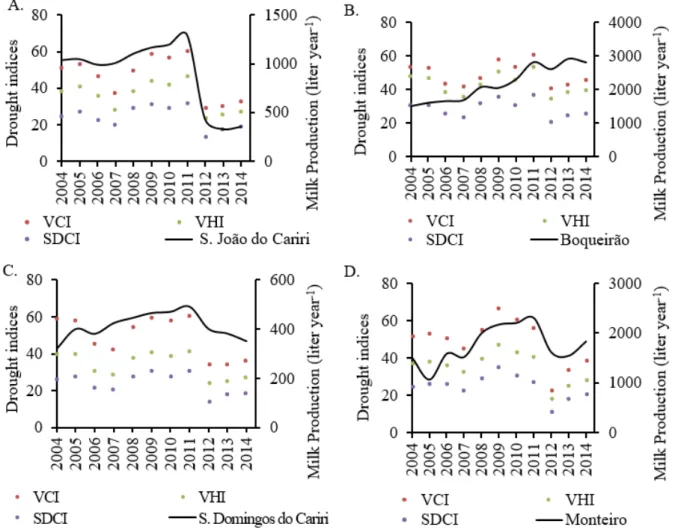
The cities of São João do Cariri, Boqueirão, São Domingos do Cariri and Monteiro were chosen to represent Groups 1, 2, 3 and 4, respectively, in the temporal production and drought index analysis. An increase in milk production can be observed between 2004 and 2011 (Figure 4), a period lacking severe droughts and may have had good native pasture availability to feed the herds. Being implemented in Paraíba in 2003, the Programa do Leite (Milk Program) may have contributed to higher investments in this sector since it promoted the strengthening of family agriculture guaranteeing the purchase of milk at a fixed price.
The highest milk production results were registered in 2011, described by drought indices as the most humid year of the series. However, in 2012, the highest drought indices were registered. These results were similar to those obtained by Cunha et al. (2015), who used MODIS (LST and NDVI) devices to evaluate the environmental changes capable of generating drought alerts. The authors observed that 2011 was a humid year and in 2012 a drought occurred, which intensified from 2012 to 2013.
Anderson et al. (2015), who used remote sensing devices, also observed the intensification of the drought in the same region and period (2012-2013). Gutiérrez et al. (2014) reported this specific drought as one of the most severe of the last century, as several cities declared a state of emergency because of the agricultural losses of nearly 90% when compared to 2011.
Small index reductions reflect no effective (actual) changes in the milk production behavior pattern (Figure 4). However, when indices are expressively reduced, indicating severe drought, milk production drops. This behavior indicates that, although the producers’ adaptation strategies are somewhat still flawed, they are enough to overcome less severe droughts, but, in severe cases, they become insufficient, highlighting the need for perfecting their contingency plans.
Costa et al. (2008) reported the lack of technique in strategies used by farmers in the Cariri region of Paraíba. These authors mentioned the used of beans, corn, cotton, palm and mandacaru
(Cereus jamacaru P. DC.) forage in livestock feeding, along with animal sales and, in some cases,
haymaking.
Riet-Correa et al. (2013) analyzed dairy goat breeding in the semiarid region of Brazil, reporting that farmers had been experiencing problems to maintain production during the dry seasons. Success in these conditions depended largely on the government’s assistance policies. Their study verified general difficulties in forage management and production, lack of technical assistance and the increase of prickly pears resistant to cochineal (Diaspis echinocacti) production, because of its importance as an alternative for animal feeding during the droughts.
The sale of part of the herd and the lack of pasture are among the reasons for milk production reductions in 2012. The recovery of the palm tree plantation areas and other governmental interventions, such as corn purchase subsidies for animal rations, may have contributed to the modest milk production growth in 2013 and 2014, even with the prolongation of the drought.
The monitoring of the drought indices, which presented intense correlation with milk production, can serve to alert producers about the lack of natural pastures and increase in ration prices, which occur due to below average rainfall.
These data, which are already available, can help in preparing and applying management strategies, such as water conservation, preventive slaughtering of livestock and exploring of alternative pricing measures for grains used in animal rations, among others aiming to reduce the negative impacts of the droughts on livestock farming.
CONCLUSIONS
The drought indices, obtained by remote sensory, correlated well with the milk production in most of the assessed cities, especially the VCI, VHI and SDCI, and have the potential of being used as tools in monitoring and managing strategies to reduce the losses of livestock caused by droughts.
Most of the cities are vulnerable to droughts, since farming in this region is extremely dependent on natural resources, as shown in correlations between milk production and drought indices. On the other hand, cities with better economic diversity present less vulnerability.
ACKNOWLEDGEMENTS
This article had the support of CNPq, CAPES, and FINEP and is a contribution to the EU-Brazil Cloud Connect (Public Notice: MCT/CNPq 13/2012) and Cheias e Secas (Edital CAPES-ANA 19/2015) projects. John Cunha is a PhD candidate at the Graduate Program on Natural Resources at Federal University of Campina Grande and holds a CAPES/PDSE scholarship (grant 88881.134740/2016-01).
REFERENCES
Alves TLB, Azevedo PVde, Santos CACdos (2015) Influence of climate variability on land degradation (desertification) in the watershed of the upper Paraíba River. Theoretical and Applied Climatology 127:741. DOI: http://dx.doi.org/10.1007/s00704-015-1661-1
Anderson MC, Hain CR, Semmens K, Yilmaz MT, Gao F (2015) Comparison of satellite-derived LAI and precipitation anomalies over Brazil with a thermal infrared-based Evaporative Stress Index for 2003–2013. Journal of Hydrology 526:287-302.
Antwi-Agyei P, Fraser ED, Dougill AJ, Stringer LC, Simelton E (2012) Mapping the vulnerability of crop production to drought in Ghana using rainfall, yield and socioeconomic data. Applied Geography 32(2):324-334.
Cândido EP, Pimenta Filho EC, Gonzaga Neto S, Santos EM, Moura JFPde (2015) Análise dos sistemas de produção de bovinos leiteiros do Cariri Oriental da Paraíba. Revista Científica de Produção Animal 17(1):7-17. DOI: http://dx.doi.org/10.15528/2176-4158/rcpa.v17n1p7-17
Chantarat S, Mude AG, Barrett CB, Carter MR (2013) Designing index‐based livestock insurance for managing asset risk in northern Kenya. Journal of Risk and Insurance 80(1):205-237. DOI: http://dx.doi.org/10.1111/j.1539-6975.2012.01463.x
Clementino IJ, Pimenta CM, Fernandes LG, Bezerra CS, Alves CJ, Dias RA, Ferreira Neto JS, Azevedo SSde (2015) Caracterização da pecuária bovina no Estado da Paraíba, Nordeste do Brasil. Semina: Ciências Agrárias 36(1):557-570. DOI:
http://dx.doi.org/10.5433/1679-0359.2015v36n1p557
Costa RG, Almeida CC, Pimenta Filho EC, Holanda Júnior EV, Santos NM (2008) Caracterização do sistema de produção caprino e ovino na região semi-árida do estado da Paraíba, Brasil. Archivos de Zootecnia 57(218):195-205.
Coutinho MJF, Carneiro MSDS, Edvan RL, Pinto APA (2013) A pecuária como atividade estabilizadora no semiárido brasileiro. Veterinária e Zootecnia 20(3):434-441.
Cunha APM, Alvalá RC, Nobre CA, Carvalho MA (2015) Monitoring vegetative drought dynamics in the Brazilian Semiarid Region. Agricultural and Forest Meteorology 214:494-505.
Diniz AF, Santos RL (2011) Repercussões da seca de 1997 e 1998 no semi-árido baiano: o caso do município de Feira de Santana (Bahia-Brasil). Revista Geográfica de América Central 2:47E.
Du L, Tian Q, Yu T, Meng Q, Jancso T, Udvardy P, Huang Y (2013) A comprehensive drought monitoring method integrating MODIS and TRMM data. International Journal of Applied Earth Observation and Geoinformation 23:245-253.
Fernandes DS, Heinemann AB (2011) Estimativa da variação da produtividade do arroz em diferentes escalas temporais do índice SPI. Pesquisa Agropecuária Brasileira 46(4):335-343.
Ferreira MA, Urbano SA (2013) Novas tecnologias para alimentação de bovinos leiteiros na seca. Revista Científica de Produção Animal 15(1):42-52. DOI: http://dx.doi.org/10.15528/2176-4158/rcpa.v15n1p42-52
Hao C, Zhang J, Yao F (2015) Combination of multi-sensor remote sensing data for drought monitoring over Southwest China. International Journal of Applied Earth Observation and Geoinformation 35:270-283.
IBGE - Instituto Brasileiro de Geografia e Estatística (2016) Cidades@. Available:
http://www.cidades.ibge.gov.br/xtras/uf.php?lang=&coduf=25&search=paraiba. Accessed: Sep 11, 2016.
Kachergis E, Derner JD, Cutts BB, Roche LM, Eviner VT, Lubell MN, Tate KW (2014) Increasing flexibility in rangeland management during drought. Ecosphere 5(6):1-14. DOI:
http://dx.doi.org/10.1890/ES13-00402.1
Kogan FN (1995) Application of vegetation index and brightness temperature for drought detection. Advances in Space Research 15(11):91-100. DOI: http://dx.doi.org/10.1016/0273-1177(95)00079-T
Kogan FN (1997) Global drought watch from space. Bulletin of the American Meteorological Society 78(4):621-636. DOI:
http://dx.doi.org/10.1175/1520-0477(1997)078<0621:GDWFS>2.0.CO;2
Lima Júnior DM, Rangel AHDN, Urbano SA, Oliveira JPFD, Araújo TLACD (2013) Silagem para vacas leiteiras no semiárido. Agropecuária Científica no Semiárido 9(2):33-42.
Mcclaran MP, Wei H (2014) Recent drought phase in a 73-year record at two spatial scales:
implications for livestock production on rangelands in the Southwestern United States. Agricultural and Forest Meteorology 197:40-51.
NASA LP DAAC (2016a) MODIS Level 3 Vegetation Indices Monthly L3 Global 1km. Version 5. NASA EOSDIS Land Processes DAAC, USGS Earth Resources Observation and Science (EROS) Center, Sioux Falls, South Dakota (https://lpdaac.usgs.gov). Available:
https://lpdaac.usgs.gov/dataset_discovery/modis/modis_products_table/mod13a3. Accessed: Jan 1, 2016.
NASA LP DAAC (2016b) MODIS Level 3 Land Surface Temperature and Emissivity 8-Day L3 Global 1km. Version 5. NASA EOSDIS Land Processes DAAC, USGS Earth Resources
Observation and Science (EROS) Center, Sioux Falls, South Dakota (https://lpdaac.usgs.gov). Available: https://lpdaac.usgs.gov/dataset_discovery/modis/modis_products_table/mod11a2. Accessed: Jan 1, 2016.
NASA LP DAAC (2016c) TRMM/TMPA 3B43 TRMM and Other Sources Monthly Rainfall Product. Version 7. NASA EOSDIS Land Processes DAAC, USGS Earth Resources Observation and Science (EROS) Center, Sioux Falls, South Dakota (https://lpdaac.usgs.gov). Available: https://mirador.gsfc.nasa.gov/collections/TRMM_3B43__007.shtml. Accessed: Jan 1, 2016.
Pereira RA, Alcântara CR (2015) Perfil do produtor rural no município de São João do Cariri e seus reflexos no processo produtivo: entre o tradicional e o moderno. Ciência e Natura 37(4):350-365. DOI: http://dx.doi.org/105902/2179460X15355
R Core Team (2016). R: A language and environment for statistical computing. R Foundation for Statistical Computing, Vienna, Austria. Available: http://www.R-project.org/.
Rhee J, Im J, Carbone GJ (2010) Monitoring agricultural drought for arid and humid regions using multi-sensor remote sensing data. Remote Sensing of Environment 114(12):2875-2887.
Riet-Correa B, Simões SVD, Pereira Filho JM, Azevedo SSde, Melo DBde, Batista JA (2013) Sistemas produtivos de caprinocultura leiteira no semiárido paraibano: caracterização, principais limitantes e avaliação de estratégias de intervenção. Pesquisa Veterinária Brasileira 33(3):345-352.
Son NT, Chen CF, Chen CR, Chang LY, Minh VQ (2012) Monitoring agricultural drought in the Lower Mekong Basin using MODIS NDVI and land surface temperature data. International Journal of Applied Earth Observation and Geoinformation 18:417-427.
Takahashi K, Ikegami M, Sheahan M, Barrett CB (2016) Experimental evidence on the drivers of index-based livestock insurance demand in Southern Ethiopia. World Development 78:324-340.