Robson Schaff Corrêa1 , Antônio Francisco Jurado Bellote2 (received: January 28, 2010; accepted: February 25, 2011)
ABSTRACT: Biomass yield from Pinus caribaea var. hondurensis is conditional on soil attributes. With the silvicultural practice
currently being used in Brazil, Pinus stands might produce lower yields due to nutrient shift from harvest and due to changes in the
edaphic environment from mechanization. Therefore, this study aims to evaluate chemical and physical soil attributes and determine which are correlated with higher biomass yields. Four commercial stands were selected, with differing growth patterns, each having four trees selected from the dominant layer, in addition to soil samples for chemical and physical analyses. Soil attributes and biomass yield data were submitted to analysis of variance (ANOVA), means were compared by the Tukey test, and the Pearson correlation coeffi cient was determined. Chemical attributes directly or indirectly associated with the sum of bases and physical attributes associated with water availability were found to be related to biomass yield.
Key words: Nutrition, growth, silviculture, fertility, soil physics.
AT RIBUTOS DO SOLO E PRODUÇÃO DE BIOMASSA DE Pinus caribaea var. hondurensis
RESUMO: A produção de biomassa de Pinus caribaea var. hondurensis é dependente dos atributos do solo. Com o modelo silvicultural atualmente adotado no Brasil, povoamentos de Pinus poderão diminuir a produção devido à exportação de nutrientes pela colheita e pela alteração do ambiente edáfi co pela mecanização. Assim, avaliaram-se quais atributos químicos e físicos do solo estão relacionados a maiores produções de biomassa. Foram selecionados 4 plantios comerciais, com diferentes ritmos de crescimento, e selecionadas 4 árvores do extrato dominante, além de solo para as as análises químicas e físicas. Para a avaliação das diferenças entre os atributos do solo e de produção de biomassa foram aplicados análise de variância (ANOVA), teste de comparação de médias (Tukey) e determinado o coefi ciente de correlação de Pearson. Os atributos químicos ligados direta ou indiretamente à soma de bases e os físicos ligados à disponibilidade hídrica apresentaram relação com a produção de biomassa.
Palavras-chave: Nutrição, crescimento, silvicultura, fertilidade, física do solo.
1Forest Engineer, Ph.D. candidate in Forest Engineering – Laboratório de Ecologia Florestal – Centro de Ciências Rurais – Universidade Federal de
Santa Maria – Avenida Roraima, 1000 – 97105-900 – Santa Maria, RS, Brasil – [email protected]
2Agronomic Engineer, Ph.D. in Forest Science, Researcher – Embrapa Florestas – Estrada da Ribeira, km 111 – Cx. P. 319 – 83411-000 – Colombo,
PR, Brasil – [email protected]
1 INTRODUCTION
The Brazilian forest-based industrial sector is one of the most competitive in the international scene, relying primarily on nonnative forests of species from genus Eucalyptus and Pinus for supply of raw material. In
2009, the total area planted with Pinus was around 1,795
thousand ha (ABRAF, 2010), consisting predominantly of subtropical species as opposed to tropical species.
Although fertilization practices are recommended in commercial forestry, Pinus stands usually do not receive
such treatment. Reasons for that include good growth rates and absence of nutritional defi ciency symptoms in species such as P. taeda and P. elliottii (REISSMANN;
WISNIEWSKY, 2005). In some cases, however, the number of rotations, as in relation to N, is now reaching threshold limits (BIZON, 2005), whether due to some stands dating back to the 50’s (IPEF, 1976), or due to the presence of low
fertility soils or shorter crop rotations. Works exploring nutrient defi ciency in tropical species of Pinus are few and
scarce in Brazil (CHAVES; CORRÊA, 2003).
Also, there is growing concern about hydrophysical restrictions in soils, which potentially reduce the effect intensity of their chemical properties on plant growth (BELLOTE; DEDECEK, 2006).
Typically, P. caribaea has excellent adaptability
2 MATERIALS AND METHODS 2.1 Study site
The material was collected in São Paulo state, at geographical coordinates -22°20’ to -22°29’ and -48°51’ to -48°59’. The local relief is predominantly fl at and sits at an altitude of around 550 m. Taxonomic soil units1 include typic dystrophic red Latosol (EMBRAPA, 2006) in sites 1, 2 and 3, and gleysolic orthic quartzarenic Neosol (EMBRAPA, 2006) in site 4, both soils being structurally deep and posing no physical obstruction to root growth at the time of collection.
The local climate is typically tropical with dry winters, Aw type according to Köppen classification (ROLIM et al., 2007), with annual average temperatures of 21.8º C and annual average precipitation of 1,341 mm (MIRANDA et al., 2010).
2.2 Site and tree selection
The species of choice was Pinus caribaea var.
hondurensis, using seed originated stands in 1st rotation,
and initial spacing of 2.7 m x 1.85 m.
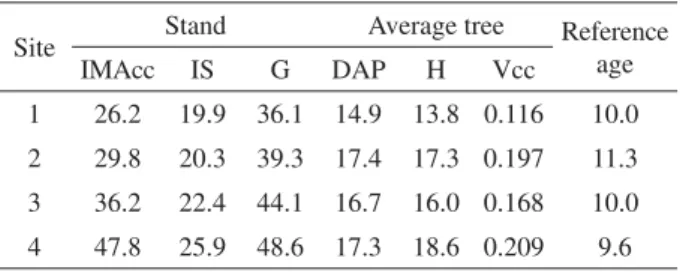
Sites were selected for sample collection based on forest inventory data provided by Empresa Duratex S.A. and also on soil analyses by Cavaglieri (2005). Four sites (treatments) were selected having site indices of 20 to 26 and with tree age ranging from 10.5 to 12 years, as illustrated in Table 1. Four trees were selected per site from the dominant layer, to a total of 16 trees.
Table 1 – Characteristics of stands sampled.
Tabela 1 – Características dos povoamentos amostrados.
Site Stand Average tree Reference
age
IMAcc IS G DAP H Vcc
1 26.2 19.9 36.1 14.9 13.8 0.116 10.0
2 29.8 20.3 39.3 17.4 17.3 0.197 11.3
3 36.2 22.4 44.1 16.7 16.0 0.168 10.0
4 47.8 25.9 48.6 17.3 18.6 0.209 9.6
Note: IMAcc = average annual increase with bark (m3 ha-1 year-1); IS = site index; G = basal area (m² ha-1); DAP = diameter at breast height (cm); H = height (m); Vcc = volume with bark (m3); Reference age = age on which the characteristics being determined were based (years).
1Data provided by Duratex S.A. according to soil inventory compiled
in areas of the estate.
2.3 Tree and soil sampling and processing
Trees were felled level with the ground and the crown was separated into the following sections: live branches, needle-shaped foliage and tip section – log portion above the 6-cm minimum diameter. The total fresh matter of branches and needles was measured with a dynamometer. Samples were dried in a forced air circulation oven at 60°C, and biomass was then derived from the correlation of total fresh matter with dry matter of samples.
Barked disks around 5 cm in thickness were removed from each log at heights 0.1m, 0.3m, 1.3m and then every 2 meters until the minimum 6-cm diameter mark was reached. The biomass of wood and bark was determined according to Silva (1996), who proposes biomass determination based on volumes and densities. The volume was obtained using the Smalian method (FINGER, 1992) and densities were obtained using the hydrostatic scale method (DURLO, 1991).
On account of trees differing in age, the effect of age on biomass yield was assessed using analysis of covariance and, as a result, the wood biomass was standardized for age 11 years, while the remaining tree sections remained unchanged.
Soil was sampled by excavating from where the crown of each tree projected on the ground, sampling at depth levels 0-5 cm, 5-10 cm, 10-20 cm and 20-30 cm, then submitting samples for chemical and physical analyses according to EMBRAPA (1997).
2.4 Statistical analyses
Data related to chemical and physical soil attributes and to the biomass of each tree section were submitted to ANOVA using a completely randomized design, and means were compared by the Tukey test. Pearson correlations were tested between soil attributes and biomass results. All analyses were performed using statistical application MSTAT-C® , at a 5% error probability level.
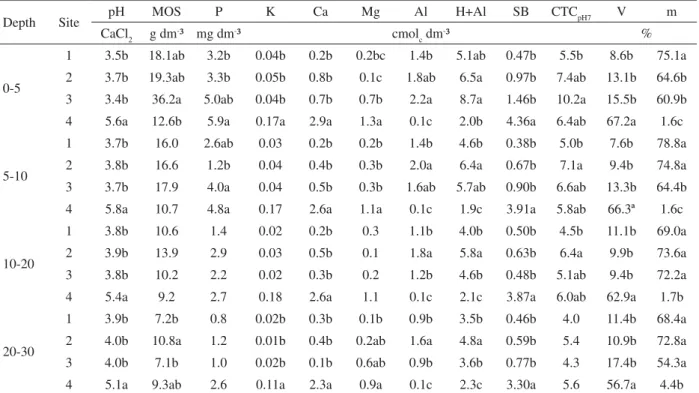
3 RESULTS AND DISCUSSION 3.1 Chemical soil analysis
Although P. caribaea is present in low fertility
environments, fertilizer application does improve yield outcome (ALVARADO et al., 2006). Results found in this study for sites 1, 2 and 3, all layers being considered, were around 0.04 cmolc K+ dm-3; 0.3 cmol
c Ca++ dm-3 and 0.3 cmolc Mg++ dm-3, higher than values found in stands with needle yellowishness and tree death symptoms, namely 0.02 cmolc K+ dm-3; 0.1 cmol
c Ca++ dm-3 and 0.0 cmolc Mg++ dm-3 (CHAVES; CORRÊA, 2005), demonstrating the adaptability of the species to low fertility environments, given that a small increase in the above contents dictated absence of defi ciency symptoms. Despite adaptable to poor fertility soils, soils with higher pH and V% were characteristic in higher yielding sites for P. taeda, yet with
a low correlation between chemical attributes and growth (DEDECEK et al., 2008).
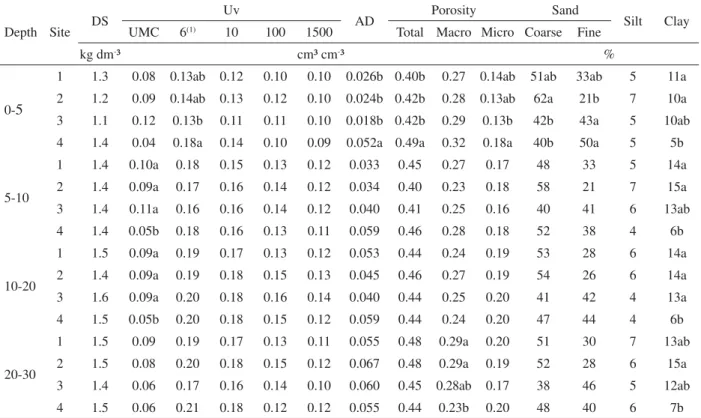
3.2 Physical soil analysis
Physical attributes (Table 3) showed less differentiation among sites than chemical attributes.
Table 2 – Soil chemistry at different depth levels, in each site being assessed. Tabela 2 – Química do solo em diferentes profundidades em cada sítio avaliado.
Depth Site pH MOS P K Ca Mg Al H+Al SB CTCpH7 V m
CaCl2 g dm-³ mg dm-³ cmol
c dm-³ %
0-5
1 3.5b 18.1ab 3.2b 0.04b 0.2b 0.2bc 1.4b 5.1ab 0.47b 5.5b 8.6b 75.1a
2 3.7b 19.3ab 3.3b 0.05b 0.8b 0.1c 1.8ab 6.5a 0.97b 7.4ab 13.1b 64.6b
3 3.4b 36.2a 5.0ab 0.04b 0.7b 0.7b 2.2a 8.7a 1.46b 10.2a 15.5b 60.9b
4 5.6a 12.6b 5.9a 0.17a 2.9a 1.3a 0.1c 2.0b 4.36a 6.4ab 67.2a 1.6c
5-10
1 3.7b 16.0 2.6ab 0.03 0.2b 0.2b 1.4b 4.6b 0.38b 5.0b 7.6b 78.8a
2 3.8b 16.6 1.2b 0.04 0.4b 0.3b 2.0a 6.4a 0.67b 7.1a 9.4b 74.8a
3 3.7b 17.9 4.0a 0.04 0.5b 0.3b 1.6ab 5.7ab 0.90b 6.6ab 13.3b 64.4b
4 5.8a 10.7 4.8a 0.17 2.6a 1.1a 0.1c 1.9c 3.91a 5.8ab 66.3ª 1.6c
10-20
1 3.8b 10.6 1.4 0.02 0.2b 0.3 1.1b 4.0b 0.50b 4.5b 11.1b 69.0a
2 3.9b 13.9 2.9 0.03 0.5b 0.1 1.8a 5.8a 0.63b 6.4a 9.9b 73.6a
3 3.8b 10.2 2.2 0.02 0.3b 0.2 1.2b 4.6b 0.48b 5.1ab 9.4b 72.2a
4 5.4a 9.2 2.7 0.18 2.6a 1.1 0.1c 2.1c 3.87a 6.0ab 62.9a 1.7b
20-30
1 3.9b 7.2b 0.8 0.02b 0.3b 0.1b 0.9b 3.5b 0.46b 4.0 11.4b 68.4a
2 4.0b 10.8a 1.2 0.01b 0.4b 0.2ab 1.6a 4.8a 0.59b 5.4 10.9b 72.8a
3 4.0b 7.1b 1.0 0.02b 0.1b 0.6ab 0.9b 3.6b 0.77b 4.3 17.4b 54.3a
4 5.1a 9.3ab 2.6 0.11a 2.3a 0.9a 0.1c 2.3c 3.30a 5.6 56.7a 4.4b
Note: numbers 1 to 4 for site indicate yield increase for an individual tree; different letters for the same column and depth indicate statistical difference by the Tukey test at 5%; no letters for the same column and depth indicate no signifi cant statistical difference. MOS = soil organic matter; SB = sum of bases; CTC = cation exchange capacity; V% = base saturation; m% = Al saturation.
Soil density remained unchanged among sites in all depth levels, noting that the highest value found (1.6 kg dm-3) is lower than the critical soil density value which ranges between 1.7 and 1.8 kg dm-3 for similar texture soils (REICHERT et al., 2003). Total porosity (PT) was around 50%, which is the ideal value generally speaking (MACHADO; FAVARETTO, 2006), with around 60% of macropores.
drained soils (REISSMANN; WISNIEWSKI, 2005), potentially stimulating growth. Clay content differed statistically among sites, with Neosol (site 4) not only showing the lowest content but also being the only soil falling into the ‘sand’ textural category, against the ‘loamy sand’ or ‘sandy loam’ textural categories of the other sites, all Latosols2 (Table 3).
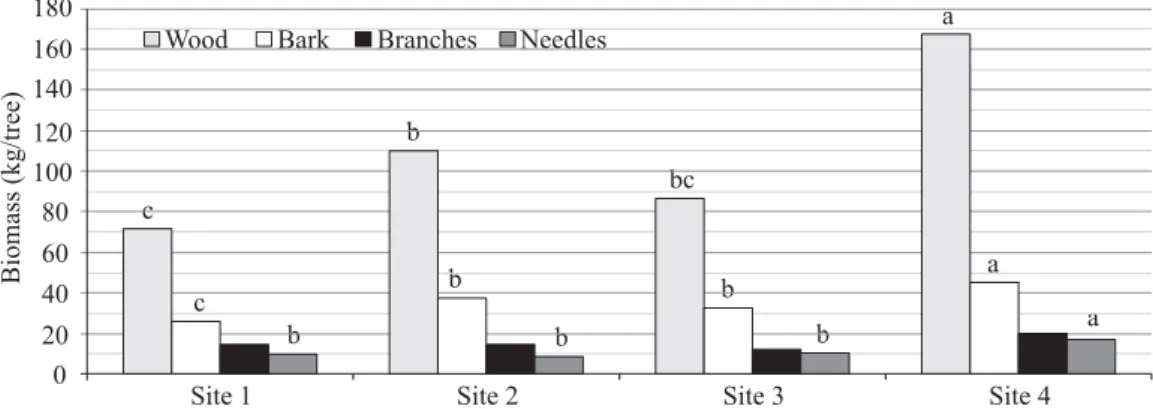
3.3 Biomass yield
For the branch section, no difference was found among sites due to high variability in tree crowns within a single site (Figure 1). As regards the other tree sections, site 4 had the overall highest biomass, site 1 had the lowest biomass of wood and bark, and site 2 had the lowest needle biomass.
2Latosols with an average 18% of clay in the Bw subhorizons, reaching
up to 29%.
3.4 Correlation between soil attributes and biomass yield
Chemical attributes relating to acidity (H+Al, Al and m%) infl uenced biomass yield negatively (Table 4). Although genus Pinus involves species tolerant of acidity
and Al, it is when these attributes are at low levels that species seem to grow more vigorously. A similar result was found by Dedecek et al. (2008).
Only for needle biomass at depths 5-10 cm and 20-30 cm (r=0.58 and p<5%, data not provided) was a correlation found with the P content in the soil. Despite the higher content of this nutrient in the site with greater biomass, overall P availability in this study was considered low. This condition is naturally found in Brazilian cerrados
and may have contributed to the outcome. This study is not to be considered conclusive, though, since Watanabe et al. (2009) found P to be a key factor for productivity. Table 3 – Soil physics at different depth levels, in each site being assessed.
Tabela 3 – Física de solo em diferentes profundidades em cada sítio avaliado.
Depth Site DS
Uv
AD Porosity Sand Silt Clay
UMC 6(1) 10 100 1500 Total Macro Micro Coarse Fine
kg dm-³ cm³ cm-³ %
0-5
1 1.3 0.08 0.13ab 0.12 0.10 0.10 0.026b 0.40b 0.27 0.14ab 51ab 33ab 5 11a
2 1.2 0.09 0.14ab 0.13 0.12 0.10 0.024b 0.42b 0.28 0.13ab 62a 21b 7 10a
3 1.1 0.12 0.13b 0.11 0.11 0.10 0.018b 0.42b 0.29 0.13b 42b 43a 5 10ab
4 1.4 0.04 0.18a 0.14 0.10 0.09 0.052a 0.49a 0.32 0.18a 40b 50a 5 5b
5-10
1 1.4 0.10a 0.18 0.15 0.13 0.12 0.033 0.45 0.27 0.17 48 33 5 14a
2 1.4 0.09a 0.17 0.16 0.14 0.12 0.034 0.40 0.23 0.18 58 21 7 15a
3 1.4 0.11a 0.16 0.16 0.14 0.12 0.040 0.41 0.25 0.16 40 41 6 13ab
4 1.4 0.05b 0.18 0.16 0.13 0.11 0.059 0.46 0.28 0.18 52 38 4 6b
10-20
1 1.5 0.09a 0.19 0.17 0.13 0.12 0.053 0.44 0.24 0.19 53 28 6 14a
2 1.4 0.09a 0.19 0.18 0.15 0.13 0.045 0.46 0.27 0.19 54 26 6 14a
3 1.6 0.09a 0.20 0.18 0.16 0.14 0.040 0.44 0.25 0.20 41 42 4 13a
4 1.5 0.05b 0.20 0.18 0.15 0.12 0.059 0.44 0.24 0.20 47 44 4 6b
20-30
1 1.5 0.09 0.19 0.17 0.13 0.11 0.055 0.48 0.29a 0.20 51 30 7 13ab
2 1.5 0.08 0.20 0.18 0.15 0.12 0.067 0.48 0.29a 0.19 52 28 6 15a
3 1.4 0.06 0.17 0.16 0.14 0.10 0.060 0.45 0.28ab 0.17 38 46 5 12ab
4 1.5 0.06 0.21 0.18 0.12 0.12 0.055 0.44 0.23b 0.20 48 40 6 7b
(1) tensions in kPa.
Note: numbers 1 to 4 for site indicate yield increase for an individual tree; different letters indicate statistical difference for a single tree section (p<0.05).
Figure 1 – Biomass in different tree sections of Pinus caribaea var. hondurensis. Figura 1 – Biomassa em compartimentos de árvores de Pinus caribaea var. hondurensis.
Table 4 – Correlations above 0.70 (p<=5%) of physical and chemical soil attributes with biomass of Pinus caribaea var. hondurensis. Tabela 4 – Correlações acima de 0,70 (p<=5%) entre atributos físicos e químicos do solo e biomassa de Pinus caribaea var. hondurensis.
Attribute
Depth
0-5 5-10 10-20 20-30
Section
M C A M C A M C A M C A
pHCaCl2 0.88 0.79 0.77 0.89 0.81 0.76 0.88 0.78 0.72 0.90 0.79 0.73
K+ 0.73 0.72 0.72
Ca++ 0.89 0.88 0.90 0.82 0.87 0.84 0.80 0.76
Mg++ 0.79 0.76 0.74
Ca+Mg 0.88 0.84 0.90 0.83 0.72 0.80 0.78 0.80 0.78
Al+++ -0.72 -0.71 -0.78 -0.77 -0.77
H+Al -0.74 -0.72 -0.74
SB 0.87 0.85 0.88 0.83 0.71 0.79 0.78 0.80 0.78
CTCpH7 0.73
CTCef 0.71 0.76 0.85 0.86 0.73 0.81 0.76 0.81
V% 0.88 0.83 0.74 0.89 0.81 0.79 0.87 0.77 0.74 0.83 0.77
Al% -0.89 -0.83 -0.77 -0.89 -0.79 -0.82 -0.85 -0.71 -0.82 -0.78 -0.70 -0.72
Na+ 0.76 0.72 0.81 0.72
UMC -0.74 -0.79 -0.82 -0.74
PT 0.76
AD 0.76
AT 0.73 0.76 0.74 0.83
Clay -0.70 -0.79 -0.79
As regards physical attributes, factors found to correlate with tree growth included PT, AD, UMC, total sand and clay. The correlation of growth with AD was expected because the region from which trees were collected has a seasonal climate and soils have low water retention due to the high percentage of sand, therefore the greater the amount of water available to plants in this soil, the more they will grow. Another attribute relating to soil water, UMC, correlates negatively with growth because where trees grow more they notably need more water in order to produce biomass, and also, greater needle biomass provides more surface for water evaporation.
Only total sand and clay contents (besides UMC) showed repetitiveness in correlations. The total sand fraction correlated positively with growth, while the clay fraction correlated negatively with growth, which is a result associated to chemical properties, since the sandiest soil proved more fertile and the sand fraction is inert and hardly contributes to water storage. Sandy soils also allowed improved growth for Tectona grandis in sites of
west-central Brazil (SILVA et al., 2000).
PT was found to correlate with biomass yield, yet other attributes, including microporosity, were also expected to have this correlation due to their relation to water availability and to the statistical differences among sites (Table 3).
No correlation was found in this study of physical or chemical attributes with biomass of live branches, for any site or depth. No references are available in literature to demonstrate this relationship, but in studies about biomass estimation the lowest coeffi cients of correlation are derived for branches (ANDRADE; HAY, 2007; SILVA et al., 2004; MELLO; GONÇALVES, 2008); in addition, the branch biomass did not differ among sites.
4 ACKNOWLEDGMENTS
We wish to thank CNPq for granting the scholarship and Duratex S/A for allowing and supporting data collection.
5 REFERENCES
ALVARADO, A.; RAIGOSA, J.; OVIEDO, J. Nutricion y fertilizacion del pino caribeño (Pinus caribaea). Quito: INPOFOS, 2006. 12 p. (Informaciones Agronomicas, 62).
ANDRADE, B. S. de; HAY, J. D. V. Estimation of aerial biomass of Lychnophora ericoides (Mart.). Brazilian Archives Biology Technology, Curitiba, v. 50, n. 4, p. 687-694, 2007.
ASSOCIAÇÃO BRASILEIRA DOS PRODUTORES DE FLORESTAS PLANTADAS. Anuário estatístico da ABRAF 2010: ano base 2009. Brasília, 2010. 140 p.
BELLOTE, A. F. J.; DEDECEK, R. A. Atributos físicos e químicos do solo e suas relações com o crescimento e a produtividade do Pinustaeda. Boletim de Pesquisa Florestal,
Colombo, n. 53, p. 21-38, 2006.
BIZON, J. M. C. Avaliação da sustentabilidade nutricional de plantios de Pinus taeda L. usando um balanço de entrada-saída de nutrientes. 2005. 95 f. Dissertação (Mestrado em Recursos Florestais) – Escola Superior de Agricultura Luiz de Queiroz, Piracicaba, 2005.
CAVAGLIERI, V. S. Avaliação e correlação do status nutricional de povoamentos de Pinus caribaea var. hondurensis com a produtividade e atributos do solo na Duratex. 2005. 44 p. Monografi a (Graduação em Engenharia Florestal) – Escola Superior de Agricultura Luiz de Queiroz, Piracicaba, 2005.
CHAVES, R. de Q.; CORRÊA, G. F. Macronutrientes no sistema solo-Pinus caribaea Morelet em plantios apresentando amarelecimento das acículas e morte de plantas. Revista Árvore, Viçosa, v. 29, n. 5, p. 691-700, 2005.
CHAVES, R. de Q.; CORRÊA, G. F. Micronutrientes no sistema solo-Pinus caribaea Morelet em plantios apresentando
amarelecimento das acículas e morte de plantas. Revista Árvore, Viçosa, v. 27, n. 6, p. 769-778, 2003.
DEDECEK, R. A.; FIER, I. S. N.; SPELTZ, R.; LIMA, L. C. de S. Infl uência do sítio no desenvolvimento do Pinustaeda L.
aos 22 anos: estado nutricional das plantas. Floresta, Curitiba, v. 38, n. 3, p. 507-516, 2008.
DURLO, M. A. Tecnologia da madeira: peso específi co. Santa Maria: CEPEF/UFSM, 1991. 29 p. (Série técnica, 8).
EMPRESA BRASILEIRA DE PESQUISA
AGROPECUÁRIA. Manual de métodos de análise de solos. 2. ed. Rio de Janeiro: CNPS, 1997. 212 p.
EMPRESA BRASILEIRA DE PESQUISA
AGROPECUÁRIA. Sistema brasileiro de classifi cação de solos. 2. ed. Rio de Janeiro: Embrapa Solos, 2006. 306 p.
IPEF. Programa de melhoramento fl orestal da CAFMA. Piracicaba, 1976. (Circular técnica, 13). 7 p.
LIMA, R. T. Comportamento de espécies/procedências tropicais do gênero Pinus em Felixlândia-MG, Brasil, região
de Cerrados: 1., Pinus caribaea var. hondurensis e Pinus oocarpa. Revista Árvore, Viçosa, v. 14, n. 1, p. 16-25, 1990.
MACHADO, M. A. M.; FAVARETTO, N. Atributos físicos do solo relacionados ao manejo e conservação de solos. In: LIMA, M. R. L. Diagnóstico e recomendações de manejo do solo: aspectos teóricos e metodológicos. Curitiba: UFPR, 2006. p. 233-254.
MELLO, S. L. de M.; GONCALVES, J. L. de M. Equações para estimar a biomassa da parte aérea e do sistema radicular em povoamentos de Eucalyptus grandis em sítios com produtividades distintas. Revista Árvore, Viçosa, v. 32, n. 1, p. 101-111, 2008.
MIRANDA, M. J. de; PINTO, H. S.; ZULLO JÚNIOR, J.; FAGUNDES, R. M.; FONSECHI, D. B.; CALVE, L.; PELLEGRINO, G. Q. Clima dos municípios paulistas:
a classifi cação climática de Koeppen para o Estado de São Paulo. Disponível em: <http://www.cpa.unicamp.br/>. Acesso em: 30 out. 2010.
MONTE SERRAT, B.; KRIEGER, K. I.; MOTTA, A. C. V. Considerações sobre interpretações de análise de solo: com exemplos. In: LIMA, M. R. L. Diagnóstico e recomendações de manejo do solo: aspectos teóricos e metodológicos. Curitiba: UFPR, 2006. p. 125-142.
MORALES, C. A. S. Relação entre atributos do solo com a produtividade de Pinus taeda. 2007. 133 p. Dissertação (Mestrado) – Universidade para o Desenvolvimento do Estado de Santa Catarina, Lages, 2007.
REICHERT, J. M.; REINERT, D. J.; BRAIDA, J. A. Qualidade dos solos e sustentabilidade de sistemas agrícolas.
Revista Ciência & Ambiente, n. 27, p. 29-48, 2003.
REISSMANN, C. B.; WISNIEWSKI, C. Aspectos
nutricionais de plantios de Pinus. In: GONÇALVES, J. L. M.;
BENEDETTI, V. Nutrição e fertilização fl orestal. Piracicaba: IPEF, 2005. p. 135-166.
ROLIM, G. de S.; CAMARGO, M. B. P. de; LANIA, D. G.; MORAES, J. F. L. de. Classifi cação climática de Köppen e de Thornthwaite e sua aplicabilidade na determinação de zonas agroclimáticas para o Estado de São Paulo. Bragantia, Campinas, v. 66, n. 4, p. 711-720, 2007.
SILVA, D. J.; FERRAZ, J. B. S.; SANTOS FILHO, M. S.; SILVA, J. S. H. Avaliação do estado nutricional, crescimento de teca (Tectonagrandis L.) e suas relações com os fatores
de sítio do solo em plantios no sudoeste de Mato Grosso, a partir da análise de componentes principais. In: SIMPÓSIO SOBRE RECURSOS NATURAIS E SÓCIO-ECONÔMICOS DO PANTANAL: OS DESAFIOS DO NOVO MILÊNIO, 3., 2000, Corumbá. Anais... Corumbá, 2000. Disponível em: <http://www.cpap.embrapa.br/agencia/congresso/Bioticos>. Acesso em: 10 dez. 2006.
SILVA, H. D. da. Modelos matemáticos para a estimativa da biomassa e do conteúdo de nutrientes em plantações de Eucalyptus grandis Hill (ex- Maiden) em diferentes idades. 1996. 101 f. Tese (Doutorado em Ciências Florestais) - Universidade Federal do Paraná, Curitiba, 1996.
SILVA, H. D. da; FERREIRA, C. A.; CORRÊA, R. S.; BELLOTE, A. F. J.; TUSSOLINI, E. L. Alocação de biomassa e ajuste de equações para estimativa de biomassa em
compartimentos aéreos de Eucalyptus benthamii. Boletim de Pesquisa Florestal, Colombo, n. 49, p. 83-95, 2004.
WATANABE, Y.; MASUNAGA, T.; FASHOLA, O. O.; AGBOOLA, A.; OVIASUYI, P. K.; WAKATSUKI, T.
Eucalyptuscamaldulensis and Pinuscaribaea growth in