347 Evolution of the hypsometric relationship ...EVOLUTION OF THE HYPSOMETRIC RELATIONSHIP IN Araucaria angustifolia
PLANTATIONS IN THE MID-SOUTH REGION OF PARANÁ STATE
Afonso Figueiredo Filho1, Andrea Nogueira Dias2, Sintia Valerio Kohler3, Aline Angélica Verussa4, Ademar Luiz Chiquetto5
(received: June 5, 2009; accepted: May 28, 2010)
ABSTRACT: The aim of this study was to assess and model the evolution of the hypsometric relationship in Araucaria angustifolia plantations grown in the 1940’s and 1960’s in the Irati National Forest, in the mid-south region of Paraná state, Brazil. Using the complete stem analysis method, it was possible to reconstitute the past annual growth of the diameter at 1.3 m (d) and of the total height (h) of a sample of 30 trees, selected so as to cover diametric and age variability. Eleven discs were removed from each tree at 0.1 and 1.3 m and at 15, 25, 35,..., 95% of the total height. Eleven models traditionally used in hypsometric relationships were tested, two of which were considered generic because they involved the age variable. The models were selected based on the Adjusted Coefficient of Determination (R²Adj), Standard Estimate Error (Syx), absolute (m) and relative (%), and on the graphic distribution of residues in percentage. In the models tested by age, no tendencies were observed and erros (Syx) remained below 14.6%, except for ages 5 and 11. However, the coefficients of determination were low, ranging from 0.29 to 0.55. The Curtis generic model (1970), selected to represent the h/d curve for all ages, also presented a satisfactory performance (R²Adj = 0.87 and Syx= 16%), with results similar to those obtained for the models in each age. As age increases, the h/d curve shifts to the right and changes level, remaining steep at the younger ages and more stable and flat as the population nears the end of its cycle.
Key words: Paraná Pine, h/d curve, stem analysis.
EVOLUÇÃO DA RELAÇÃO HIPSOMÉTRICA EM PLANTIOS DE Araucaria angustifolia NO CENTRO-SUL DO ESTADO DO PARANÁ
RESUMO: Nesta pesquisa, objetivou-se avaliar e modelar a evolução da relação hipsométrica em plantios de Araucaria angustifolia, estabelecidos nas décadas de 40 a 60 na Floresta Nacional de Irati, região Centro-Sul do Paraná. Com o método de análise de tronco completa foi feita a reconstituição do crescimento anual passado do diâmetro a 1,3m do solo (d) e da altura total (h) de uma amostra com 30 árvores, selecionadas de forma a cobrir a variabilidade diamétrica e de idade. De cada árvore, foram retirados 11 discos nas alturas 0,1 e 1,3 m e nas alturas de 15, 25, 35,..., 95% da altura total. Foram testados 11 modelos tradicionalmente usados para relações hipsométricas, sendo dois deles denominados de genéricos, porque envolvem a variável idade. Os modelos foram selecionados com base no Coeficiente de Determinação Ajustado (R²Adj ), Erro Padrão de Estimativa (Syx ) absoluto (m) e relativo (%) e na distribuição gráfica dos resíduos em percentagem. Os modelos testados por idade se mostraram sem tendências, com erros (Syx ) inferiores a 14,6%, exceto para as idades 5 e 11 anos, no entanto, os coeficientes de determinação foram baixos, variando de 0,29 a 0,55. O modelo genérico de Curtis (1970), selecionado para representar a curva h/d em todas as idades, também apresentou um bom desempenho (R²Adj = 0,87 e Syx = 16%) e com resultados similares àqueles obtidos com os modelos em cada idade. Com o avanço da idade, a curva h/d se desloca para a direita e muda de patamar, sendo íngreme nas idades mais jovens, tornando-se mais estável e aplainada quando o povoamento tende para o final de seu ciclo.
Palavras-chave: Pinheiro-do-Paraná, curva h/d, análise de tronco.
1Forest Engineer, PhD, Senior Professor of the Forest Engineering Graduate Course at the Universidade Federal do Paraná/UFPR, Researcher of the National Counsel of Technological and Scientific Development (CNPq) 1C – Departamento de Engenharia Florestal – Universidade Estadual do Centro-Oeste/UNICENTRO – Bairro Riozinho – Cx. P. 21 – 84500-000 – Irati, PR – [email protected]
2Forest Engineering, PhD, Professor – Departamento de Engenharia Florestal – Universidade Estadual do Centro-Oeste/UNICENTRO – Bairro Riozinho – Cx. P. 21 – 84500-000 – Irati, PR – [email protected]
3Forest Engineering Student, Scientific Initiation Scholarship Student of the National Counsel of Technological and Scientific Development (CNPq) – Departamento de Engenharia Florestal – Universidade Estadual do Centro-Oeste/UNICENTRO – Bairro Riozinho – Cx. P. 21 – 84500-000 – Irati, PR – [email protected]
4Forest Engineering Student, Scientific Initiation Volunteer Student – Departamento de Engenharia Florestal – UNICENTRO – Bairro Riozinho – Cx. P. 21 – 84500-000 – Irati, PR – [email protected]
348 FIGUEIREDO FILHO, A. et al.
1 INTRODUCTION
Estimating tree volume is, usually, the main aim of forest surveys, especially when forests and forest stands are used for commercial purposes (MACHADO & FIGUEIREDO FILHO, 2003). Therefore, the diameter with bark at 1.3 m (DBH) and the total height (h) are usually measured, serving as inputs for the functions that estimate the volume of standing trees (form factor, volume equations, taper equations). As total height measurement is rather complex, it has often been estimated using hypsometric relationships, also known as height/diameter curves, especially in forest plantations.
Schmidt (1977) defined the hypsometric relationship as the regression of height over diameter in a stand on a specific date, which may be expressed by a mathematical adjustment and is usually represented by “h/d” (FINGER, 1992). Factors such as species, sociological position, age, crown size, density, site and silvicultural practices may influence the relationship between the variables (BARROS et al., 2002; BARTOSZECK et al., 2004; CARDOSO et al., 1989; FINGER, 1992).
The stand age affects the relationship between height and diameter, hindering the use of the same relationship in successive inventories. Instead, a new relationship should be made based on new data (SCOLFORO, 1999). As the tree stand grows older, the differences between the curves tend to decrease gradually because, when a tree reaches its growth climax, a characteristic determined by species and site, its diameter and height growth are reduced. As a result, the changes in the height and diameter relationship will be quite small (FINGER, 1992).
The hypsometric relationship does not have a well-defined biological relationship, such as height and age or diameter and age, and there is a great variation in height for the same diameter in different sites and ages (CHAPMAN & MEYER, 1949).
The hypsometric relationship in stands with the same age varies according to their density and to the quality of the site. In these circumstances, a single hypsometric relationship adjusted for an entire stand would encompass several different relationships, resulting in a high variation around the height over diameter regression line (PRODAN et al., 1997). Thus, one of the procedures used in forest inventories to solve the issue has been to adjust independent equations for each sample unit.
Depending on the factors considered, the h/d curve may vary in form, inclination and origin (intercept). The form of the curve may indicate a forest stand’s development and
growth stage: a steep inclination usually indicates a young stand which is still in development, whereas a flat line indicates older stands in which the current annual increment, mainly in height, is in decline. Over time, the height/diameter curves of the same stand, defined at different ages, tend to move up and to the right, becoming increasingly flatter with age (BARTOSZECK, 2000; CARDOSO et al., 1989; CURTIS, 1967; MACHADO et al., 1994).
Araucaria angustifolia, also known as the
Paraná-Pine, has a high economic and landscaping value. Its wood is used in lining, frames, slats, boxes, cellulose, civil construction, lamination and other products (LORENZI, 1992).
For decades, Araucaria angustifolia was the most economically important species in Brazil and, until the 1970’s, it was ranked amongst the most important export products in the country’s economy.
Frequently, the volume of this species, whether in a native or a planted forest, needs to be quantified, and the use of hypsometric relationships is a relevant dendrometric tool.
Caldeira et al. (2003) adjusted 17 hypsometric models for a 14-year-old Araucaria angustifolia stand in the western region of Paraná state. The best adjustment rendered a coefficient of determination of 0.83.
Barros et al. (2002) tested traditional and generic hypsometric models for a Pinus oocarpa plantation with 1099
trees distributed in 11 treatments, according to age and number of prunings. The generic models’ coefficient of determination was higher than that of the traditional ones, while the standard estimate error values were more or less similar.
Bartoszeck et al. (2004) analyzed the behavior and dynamics of the hypsometric curve, in relation to site, age and initial density, in bracatinga stands (Mimosa scabrella
Benth.) in the metropolitan region of Curitiba, Paraná state. The authors found that age and site have significant statistical effects on the hypsometric relationship, whereas density does not.
Crechi (1996) studied the effect of ten plantation densities in an experiment with Araucaria angustifolia
(Bert.) O. Ktze., in Cuartel Rio Victoria, Missiones, Argentina. Hyposmetric relationships were developed for all diameters and ages. Results showed that plantation density had a significant effect on the variables studied, except on predominant height.
349 Evolution of the hypsometric relationship ...
traditional mathematical models with data originating from complete stem analysis.
2 MATERIAL AND METHODS 2.1 Location of the study area
The study was carried out in Araucaria angustifolia plantations in the Irati National Forest (Irati FLONA), located between the municipalities of Irati and Fernandes Pinheiros, Paraná state.
The Irati FLONA is located on the Second Plateau of Paraná state, in the mid-southern region of the state (SOCIEDADE DE PESQUISA EM VIDA SELVAGEM E EDUCAÇÃO AMBIENTAL - SPVS, 1996)1 . It covers an area of 3495 hectares, with both native vegetation and a portion of approximately 1310 ha reforested with
Araucaria, Pinus and Eucalyptus (INSTITUTO
BRASILEIRO DO MEIO AMBIENTE - IBAMA, 2009)2. It is located in the physiographic zone of Irati, in the parallel 25º27’56" latitude south, intersecting the meridian 50º37’51" west longitude, at 812 m above sea level (IRATI, 2009).
The climate in the region is type Cfb – Humid Subtropical and Mesothermal, with mild summers, frequent and severe frosts and no dry season. The mean annual temperatures in the warmest months remain below 24 ºC and in the coldest months below 18 ºC, and with mean annual temperature of 17 ºC (SPVS, 1996). The region’s
1Research Society for Wildlife and Environmental Education 2Brazilian Institute of Environment and Natural Resources
mean monthly rainfall is 193.97 mm, and the relative humidity is 79.58% (IRATI, 2006).
2.2 Collecting the sample
There are several Pinus and Araucaria stands in the Irati National Forest, most of which were established in the 1940’s, 1950’s and 1960’s; almost all of them are currently over 40 years old (FIGUEIREDO FILHO et al., 2006).
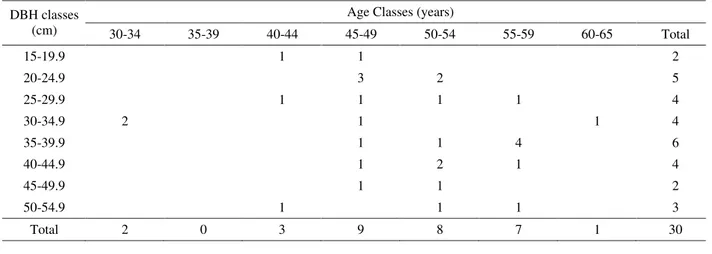
Thirty trees of the FLONA Araucária plantations were sampled, representative of the various diameter classes and ages in the forest (Table 1). It is important to highlight that a similar number of trees was sampled in each DBH class. Initially, thirty-eight trees were sampled, from which eight were eliminated for not belonging to the plantation. These were native trees already in the study area when the plantation was planted and, when ANATRO was done, their age was much higher than the plantations’. This factor contributed to the different number of trees in each DBH class. The age class 35-39 was not included as there were no plantations in this age range, a factor which also contributed to the different sample sizes in each age class.
Discs were removed from each tree at absolute heights of 0.1 and 1.3 m (DBH) and relative heights of 15, 25, 35, 45, 55, 65, 75, 85, 95% of the total height for application of the complete stem analysis technique (ANATRO) which, based on the annual growth ring measurements in each disc, enables the reconstitution of
Table 1 – Statistics of the 30 sampled trees.
Tabela 1 – Informações estatísticas das 30 árvores amostradas.
Age Classes (years) DBH classes
(cm) 30-34 35-39 40-44 45-49 50-54 55-59 60-65 Total
15-19.9 1 1 2
20-24.9 3 2 5
25-29.9 1 1 1 1 4
30-34.9 2 1 1 4
35-39.9 1 1 4 6
40-44.9 1 2 1 4
45-49.9 1 1 2
50-54.9 1 1 1 3
350 FIGUEIREDO FILHO, A. et al.
the past annual growth of the measurable variables, such as diameter, total height and volume, among others.
The discs were smoothed after drying and 4 radii were marked in each one. The annual growth rings were measured to obtain the diameter (without bark) at each age. The final height portions of each age were estimated based on the hypothesis that the ring ends occur according to the exit angle of the previous cut and are equal to the angle immediately following (more external, from the core outwards). This was the best procedure among those tested by Barusso (1977). Height was determined in function of the parallelism to the preceding ring, according to Rosot et al. (2003). This procedure is equivalent to the one used by Carmean (1972), and it has been widely used in the south of Brazil in studies involving stem analysis.
The dendometric parameters of each tree were calculated by the Excel software Florexcel supplement, developed by professor Júlio Eduardo Arce at the Federal University of Paraná (UFPR). In this work, specifically, the variables of interest were total height and DBH with bark at various ages.
2.3 Determination of the diameter at 1.3 m (DBH) with bark at various ages
Using the ANATRO, diameter at breast height (DBH) with bark can be determined only at the cutting age. In the previous ages, the technique generates only the DBH without bark. On the other hand, in the hypsometric relationship or the h/d curve, the total height and DBH with bark, the variable usually measured in standing trees, are used.
Thus, it became necessary to find a solution to the problem of using DBH with bark at various ages. Two models that could estimate DBH with bark were tested, based on the variables available in each tree subjected to ANATRO, such as: DBH with bark, DBH without bark, tree age and the total height in the different cutting ages. It is important to emphasize that this alternative, used for determining DBH with bark, may present some inconsistencies in age classes below 30, impairing height estimates in the models generated. Nevertheless, this poses no consequences to the main objectives of this study, which assessed the evolution of the hypsometric curve and checked whether modeling should be done according to age (or age class) or whether a generic model would suffice.
In order to select the best model for estimating DBH with bark, the same statistical data as detailed in item 2.5 were used. The tested models were:
(LAAR)
0 1 2 3
cc sc sc
d
b
b d
b I
b d I
) ln( ln
lndcc b0 b1 dsc b2 hI (SCHNEIDER, 1978)
where:
ln = neperian logarithm;
dcc = diameter at 1.3m with bark (cm); dsc = diameter at 1.3m without bark (cm) I = Age of tree (years);
h = total height (m);
bo, b1, b2, b3 = coefficients estimated by regression
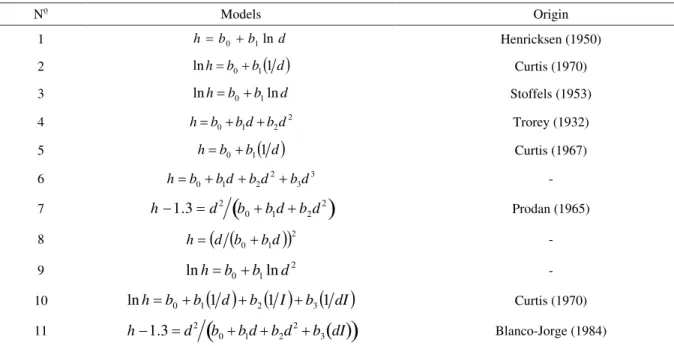
2.4 Hypsometric models tested
After estimating DBH with bark at various ages, the DBH and h data obtained through ANATRO were grouped in different ages: 5, 10, 15, 20, 25, 30, 35, 40, 45 years and a group with ages 50, 55 and 60, to evaluate the evolution of the h/d curve over the years.
This evolution was based on mathematical models especially adjusted in each age group. Eleven hypsometric models in the literature were studied (Table 2), two of which were generic models that include age, as well as DBH with bark, as independent variables.
2.5 Statistical data for selection of the models
The models in Table 2 were adjusted with each age group’s database, except for the two generic models, which were fed with the entire database. To select the models, the following statistical data were used: Adjusted Coefficient of Determination (R²Adj) and Standard Estimate Error (Syx),
absolute (m) and relative (%). To check for possible tendencies in the estimates, the graphic distribution of residues in each age group was determined in percentage in the two best models, selected based on this statistical data. The models in which the dependent variables were not total height (h) required a recalculation of Syx and R². R² was recalculated using the SCHLAEGEL Adjustment
Index (IA), as follows:
where:
n
i Y Yi
SQTot 2
n 2
i i i
ˆ
= Y - Y
SQRes
1 SQRes IA
351 Evolution of the hypsometric relationship ...
Yi = total height (m) values observed
i
Yˆ = estimated height (m) i
Y = mean total height observed (m)
The adjusted R² (R2
Adj) was determined for all the
equations, allowing for a comparison of equations with different numbers of coefficients:
n = number of observations p = number of model coefficients
Likewise, Syx was recalculated when the dependent
variable was not total height (h) using the following equation:
p n
i Y Yi Syx
n
i1
2
ˆ
Finally, Syx was determined in percentage using the following formula:
100 ) (
) ( %
m Y
m Syx Syx
ln = neperian logarithm ; d = diameter at 1.3 m with bark (cm); I = Age of tree (years); h = total height (m); bo, b1, b2, b3 = coefficient estimated by regression
Table 2 – Hypsometric models tested.
Tabela 2 – Modelos hipsométricos testados.
2.6 Comparison of height estimates by generic models and by age
For stands with different ages, the literature recommends adjusting a hypsometric model for each age or age class or the use of the so-called generic models. These models use, as independent variables, in addition to DBH with bark, age and sometimes dominant height.
To check possible differences between the two procedures, variation analysis was done in a randomized design, with three treatments: height at age i; height estimated by the model at age i and height estimated by the generic model, with 30 replications. The F test ( =
0.05) was then applied to test the following hypotheses: H0: There are no significant differences between the treatments;
H1: There are significant differences between the treatments.
If the F test indicated significant differences among treatments, the Tukey test ( = 0.05) was applied to determine which treatments were different.
No Models Origin
1 h b0 b1lnd Henricksen (1950)
2 lnh b0 b11d Curtis (1970)
3 lnh b0 b1lnd Stoffels (1953)
4 h b0 b1d b2d2 Trorey (1932)
5 h b0 b11d Curtis (1967)
6 3
3 2 2 1
0 bd bd bd
b
h -
7 h 1.3 d2 b0 b1d b2d2 Prodan (1965)
8 h d b0 b1d 2 -
9 lnh b0 b1lnd2 -
10 lnh b0 b11d b21I b31dI Curtis (1970)
11 h 1.3 d2 b0 b1d b2d2 b3 dI Blanco-Jorge (1984)
2 1 1 2 1 1 1
Adj
n n SQRes
R R
352 FIGUEIREDO FILHO, A. et al.
3 RESULTS AND DISCUSSION 3.1 DBH estimates with bark at different ages
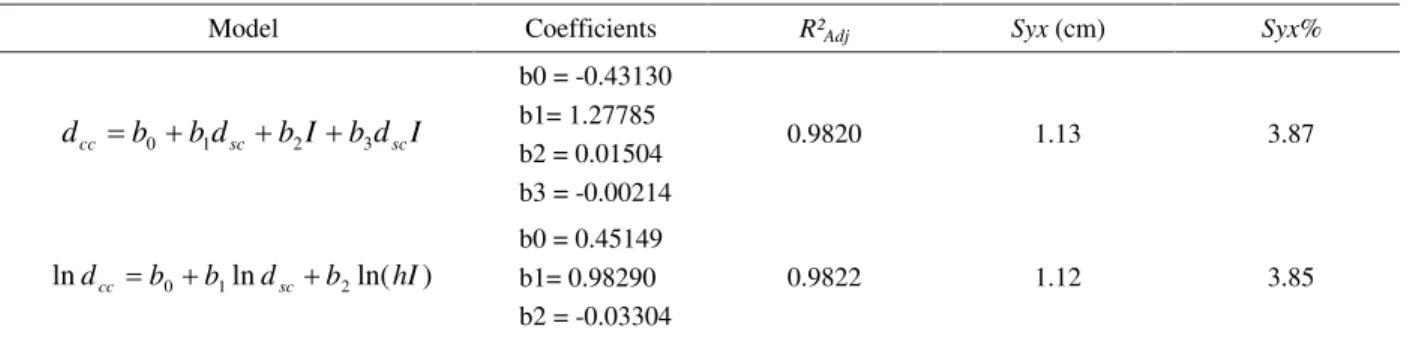
Table 3 presents the statistical data of the models for estimating DBH with bark at various ages tested and indicates that both models presented excellent results. However, as emphasized in the methodology (item 2.3), the estimates in ages below 30 years may present inconsistencies due to the cutting age of the trees in the sample.
The logarithmic model was then used to estimate DBH with bark at different ages. This was necessary to make up the database for the other ages, as mentioned in item 2.3. 3.2 Adjustment of hypsometric models by age
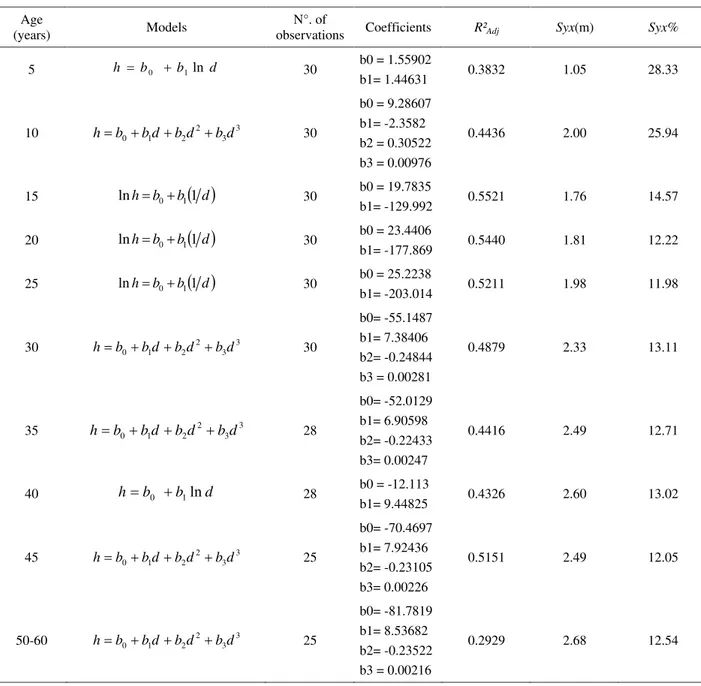
After determing diameter (DBH) with bark and the total height in all the ages of each tree, the 11 hypsometric models were adjusted based on the data available for each age, except for the age class 50 to 60 years, in which the adjustment was based on all the observations available (25). The best models for each age were selected according to the statistics cited in the methodology and listed in Table 4.
In general, Models 5 and 6, respectively the Curtis model (lnh=b0+b1(1/d)) and the third degree polynomial model (h=b0+b1d+b2d²+b3d³), presented the best
adjustments for most ages, except for ages 5 and 40, in which model 1, the Henricksen model (1950), had a better performance.
The mean errors (Syx%) are higher at younger ages (5 and 10 years), but are very reasonable above them, varying from 12% to 15%. On the other hand, adjustments (R²Adj) varying from 0.29 to 0.55 indicated only a reasonable affinity between height and DBH with bark.
The results obtained are compatible with those found by Caldeira et al. (2003), who found, for a 14-year
old Araucaria angustifolia stand, coefficients of
Table 3 – Coefficients and adjustment statistics of the tested models.
Tabela 3 – Coeficientes e estatísticas de ajuste para os modelos testados.
determination between 0.39 and 0.42 for most of the adjusted models. Only 3 models presented a better adjustment, ranging from 0.78 to 0.83, and errors lower than 15.37%.
In spite of the difficulties in obtaining satisfactory adjustments for the h/d relationship, better results may be obtained through the effective control of the basic independent variable (DBH), which is not possible when the stem analysis technique is applied. Site is another factor that affects the h/d relationship (CARDOSO et al., 1989; PRODAN et al., 1997; BARTOSZECK et al., 2004) and, in the sampled material, this variable was not subject to control.
The relative residues in the best models were plotted and no tendency was observed for height estimates. Figure 1 illustrates the behavior of the residues in some ages. 3.3 Adjustments of the generic hypsometric models
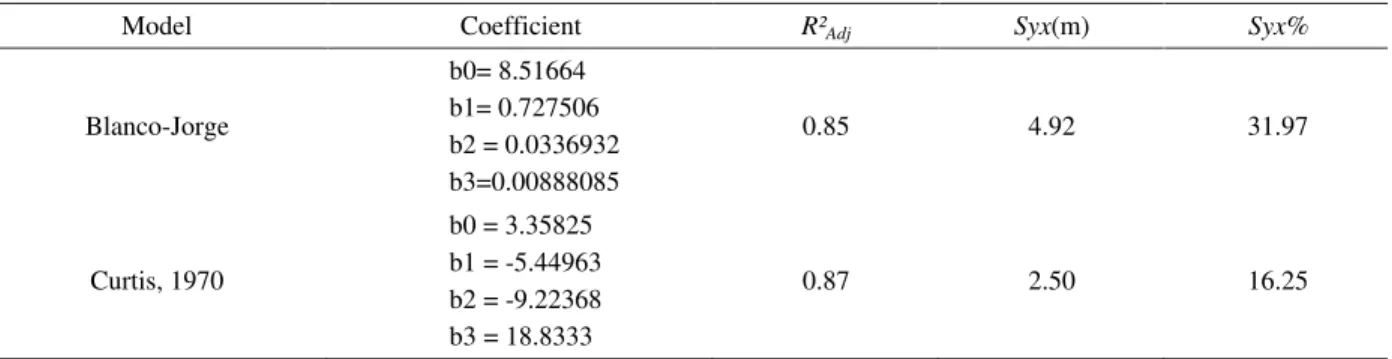
Models 10 and 11 are generic models in which the variable age is included in the equation. This allows for only one adjustment for all the data and makes it easier to visualize the evolution of the hypsometric curve in time. Table 5 shows the coefficient and the adjustment statistics of these models.
The best adjustment was found for model 10 (CURTIS, 1970), which presented a high coefficient of determination (R²Adj= 0.87) and a mean error (Syx%) of
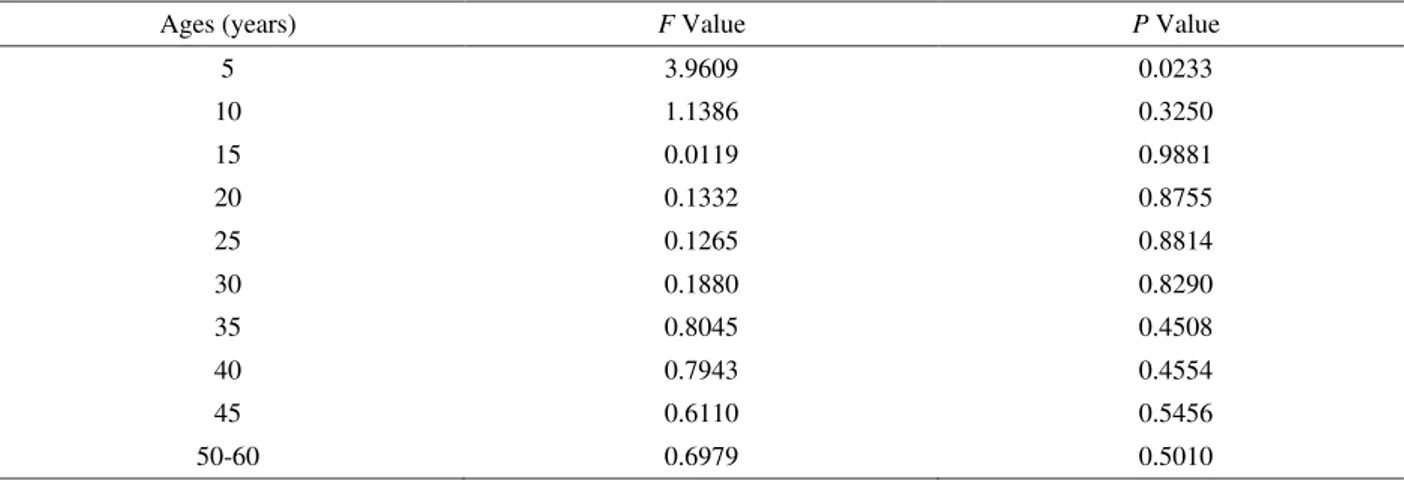
16.25%. Nevertheless, no improvements in the mean error, in comparison to the models adjusted by age, were observed. Also, statistical analysis (item 3.4) indicated that similar results are found for both procedures. Crechi (1996) obtained similar results with the Curtis model (1970) for an Araucária plantation in the region of Missiones, Argentina. 3.4 Comparison of generic models with models at each age Table 6 shows the results obtained by the variation analysis F test (ANOVA) and the respective p-values for
Model Coefficients R²Adj Syx (cm) Syx%
I d b I b d b b
dcc 0 1 sc 2 3 sc
b0 = -0.43130 b1= 1.27785 b2 = 0.01504 b3 = -0.00214
0.9820 1.13 3.87
) ln( ln
lndcc b0 b1 dsc b2 hI
b0 = 0.45149 b1= 0.98290 b2 = -0.03304
353 Evolution of the hypsometric relationship ...
Table 4 – Models selected for each age with their respective coefficients and adjustment statistics.
Tabela 4 – Modelos selecionados para cada idade com seus respectivos coeficientes e estatísticas de ajuste.
each age. It is important to highlight that the degrees of freedom changes according to the age in which the tree was cut down. This inevitably interferes with the F and p values.
ANOVA indicated that there was no significant difference between the treatments, except at age 5. The Tukey test (Table 7) was then applied and indicated that
treatment 1 (height at age i) is similar to treatment 2 (height
estimated by the i age model). However, treatment 3 (height
estimated by the generic model) differed from the others. Ignoring the difference found at age 5, when the forest is still establishing itself, the estimates of the models developed for each age were identical to the estimates provided by the generic model in the species studied. This Age
(years) Models
N°. of
observations Coefficients R²Adj Syx(m) Syx%
5 h b0 b1ln d 30
b0 = 1.55902
b1= 1.44631 0.3832 1.05 28.33
10 3 3
2 2 1
0 bd bd bd
b
h 30
b0 = 9.28607 b1= -2.3582 b2 = 0.30522 b3 = 0.00976
0.4436 2.00 25.94
15 lnh b0 b11d 30
b0 = 19.7835
b1= -129.992 0.5521 1.76 14.57
20 lnh b0 b11d 30
b0 = 23.4406
b1= -177.869 0.5440 1.81 12.22
25 lnh b0 b11d 30 b0 = 25.2238
b1= -203.014 0.5211 1.98 11.98
30 3 3
2 2 1
0 bd bd bd
b
h 30
b0= -55.1487 b1= 7.38406 b2= -0.24844 b3 = 0.00281
0.4879 2.33 13.11
35 h b0 b1d b2d2 b3d3 28
b0= -52.0129 b1= 6.90598 b2= -0.22433 b3= 0.00247
0.4416 2.49 12.71
40 h b0 b1lnd 28
b0 = -12.113
b1= 9.44825 0.4326 2.60 13.02
45 3
3 2 2 1
0 bd bd bd
b
h 25
b0= -70.4697 b1= 7.92436 b2= -0.23105 b3= 0.00226
0.5151 2.49 12.05
50-60 3 3
2 2 1
0 bd bd bd
b
h 25
b0= -81.7819 b1= 8.53682 b2= -0.23522 b3 = 0.00216
354 FIGUEIREDO FILHO, A. et al.
Figure 1 – Residue distribution of model 5 at age 15 (a) and 20 (b), model 6 at age 30 (c) and of model 1 at age 40 (d).
Figura 1 – Distribuição dos resíduos para os modelos 5 na idade 15 (a) e na idade 20 (b), 6 na idade 30 (c) e 1 na idade 40 (d).
Table 5 – Coefficients and statistics of the generic models.
Tabela 5 – Coeficientes e estatísticas obtidas para os modelos genéricos.
DBH (cm) DBH (cm)
DBH (cm) DBH (cm)
indicates that the procedures are equivalent. It also suggests the possibility of using a single model that encompasses age, a favorable aspect for growth and production modeling.
3.5 Evolution of the h/d curve
To assess the evolution of the h/d curve over the years, height was estimated by the Curtis model and plotted in a graph (Figure 2). As expected, as age increases the h/d curve shifts to the right and changes
level, becoming more stable and flat. This indicates that height growth tends to stabilize as age increases, tending towards a line parallel to the x axis as the plantation nears its final asymptotic value. The same behavior was found by Crechi (1996) in Araucária plantations in Missiones, Argentina, and by Bartoszeck et al. (2004), in bracatinga stands (Mimosa scabrella Benth.) in the
metropolitan region of Curitiba, Paraná state, among others (CARDOSO et al., 1989; CURTIS, 1967; MACHADO et al., 1994).
Model Coefficient R²Adj Syx(m) Syx%
Blanco-Jorge
b0= 8.51664 b1= 0.727506 b2 = 0.0336932 b3=0.00888085
0.85 4.92 31.97
Curtis, 1970
b0 = 3.35825 b1 = -5.44963 b2 = -9.22368 b3 = 18.8333
355 Evolution of the hypsometric relationship ...
Ages (years) F Value P Value
5 3.9609 0.0233
10 1.1386 0.3250
15 0.0119 0.9881
20 0.1332 0.8755
25 0.1265 0.8814
30 0.1880 0.8290
35 0.8045 0.4508
40 0.7943 0.4554
45 0.6110 0.5456
50-60 0.6979 0.5010
Table 6 –F and P value of the variation analysis at each age.
Tabela 6 – Valor F e P das análises de variâncias realizadas em cada idade.
Table 7 – Tukey test for comparison of the means.
Tabela 7 – Teste de Tukey para a comparação das médias.
Figure 2 – Evolution of the h/d curve in Araucaria angustifolia plantations.
Figura 2 – Evolução da curva h/d em plantios de Araucaria angustifolia.
Treatments Mean height (m) Comparisons
1 (height at age 5) 3.698 A
2 (height estimated by the model at age 5) 3.698 A
3 (height estimated by the generic model) 2.999 B
356 FIGUEIREDO FILHO, A. et al.
4 CONCLUSIONS
The equations developed to estimate diameter with bark, using complete stem analysis, were efficient, especially for the scope of the sample, which included trees over 30 years old.
The use of stem analysis to build h/d curves hinders the control of the independent variable diameter and may generate models with greater errors and lower adjustment indexes.
The generic model developed had a similar performance to the best models selected for each age, indicating that, when it is possible to design a generic model, it is not necessary to generate a model for each age or class age.
The hypsometric relationship in Araucária evolved as expected, that is, as age increased the curve shifted to the right and changed level, being steeper at younger ages and becoming increasingly stable and flat as the stand approached the end of its cycle.
5 BIBLIOGRAPHICAL REFERENCES BARROS, D. A. de; MACHADO, S. do A.; ACERBI JUNIOR, F. W.; SCOLFORO, J. R. S. Comportamento de modelos hipsométricos tradicionais e genéricos para plantações de Pinus oocarpa em diferentes tratamentos. Boletim de Pesquisa Florestal, Colombo, n. 45, p. 3-28, jul./dez. 2002.
BARTOSZECK, A. C. P. S. Evolução da distribuição diamétrica e da relação hipsométrica em função dos fatores idade, sítio e densidade inicial em bracatingais da região metropolitana de Curitiba. 2000. 214 f. Dissertação(Mestrado em Ciências Florestais) - UniversidadeFederal do Paraná, Curitiba, 2000.
BARTOSZECK, A. C. P. S.; MACHADO, S. do A.; FIGUEIREDO FILHO, A.; OLIVEIRA, E. B. Dinâmica da relação hipsométrica em função da idade, do sítio e da densidade inicial de povoamentos de bracatinga da região metropolitana de Curitiba, PR. Revista Árvore, Viçosa, v. 28, n. 4, p. 517-533, 2004.
BARUSSO, A. P. Determinação de funções de crescimento mediante análise de tronco. 1977. 133 f. Dissertação (Mestrado em Engenharia Florestal) - Universidade Federal do Paraná, Curitiba, 1977.
BLANCO-JORGE, L. A. Equação da relação hipsométrica para povoamentos de Pinus elliottii Elgelm na Floresta
Nacional de Três Barras, SC. Brasil Florestal, Brasília, n. 56, p. 41-47, 1984.
CALDEIRA, M. V. W.; SCHUMACHER, M. V.; SCHEEREN, L. W.; WATZLAWICK, L. F. Relação hipsométrica para Araucaria angustifolia (Bert.) O. Ktze na região oeste do estado do Paraná. Revista Acadêmica: Ciências Agrárias e Ambientais, Curitiba, v. 1, n. 2, p. 79-88, abr./jun. 2003.
CARDOSO, D. J.; MACHADO, S. do A.; ROSOT, N. C.; EMERENCIANO, D. B. Avaliação da influência dos fatores idade e sítio na relação hipsométrica para Pinus taeda nas regiões central e sudoeste do estado do Paraná. Revista Floresta, Curitiba, v. 19, n. 1, p. 96-115, 1989.
CARMEAN, W. H. Site index curves for upland oaks in the Central States. Forest Science, Bethesda, v. 18, p. 102-120, 1972.
CHAPMAN, H. H.; MEYER, W. H. Forest mensuration. New York: Mcgraw-Hill, 1949. 522 p.
CRECHI, E. H. Efeitos da densidade da plantação sobre a produção, crescimento e sobrevivência de Araucaria angustifolia (Bert.) O. Ktze. Em Missiones, Argentina. 1996. 172 f. Dissertação (Mestrado em Ciências Florestais) -Universidade Federal do Paraná, Curitiba, 1996.
CURTIS, R. O. Height diameter and height diameter age equations for second growth Douglas-fir. Forest Science, Bethesda, v. 13, n. 4, p. 365-375, 1967.
FIGUEIREDO FILHO, A.; DIAS, A. N.; WATZLAWICK, L. F. Inventário das florestas plantadas na Floresta Nacional de Irati, estado do Paraná. Curitiba: UFPR, 2006.
FINGER, C. A. G. Fundamentos da biometria florestal.Santa Maria: UFSA, 1992. 269 p. v. 2.
HENRICKSEN, H. A. Height-diameter curve with logarithmic diameter: brief report on a more reliable method of height determination from height curves, introduced by the State Forest Research Branch. Dansk Skovforen Tidsskr, v. 35, p. 193 202, 1950.
357 Evolution of the hypsometric relationship ...
IRATI. Prefeitura Municipal. Disponível em: <http:// www.irati.pr.gov.br/>. Acesso em: 7 jan. 2009.
LORENZI, H. Árvores brasileiras: manual de identificação e cultivo de plantas arbóreas nativas do Brasil. São Paulo: Plantarum, 1992. 368 p.
MACHADO, S. A.; BAYLEY, R. L.; BASSO, S. F.; BEVILACQUA JUNIOR, V. G. Análise do comportamento da relação hipsométrica com respeito à idade para plantações de Pinus elliottii no Estado do Paraná. Cerne, Lavras, v. 1, n. 1, p. 5-12, 1994.
MACHADO, S. A.; FIGUEIREDO FILHO, A. Dendrometria. Curitiba: [s.n.], 2003. v. 1, 309 p.
PRODAN, M.; PETERS, R.; COX, F.; REAL, P. Mensura forestal. San José: IICA, 1997. 586 p. (Serie Investigación y Educación en Desarrollo Sostenible).
ROSOT, M. A. D.; FIGUEIREDO FILHO, A.; DISPERATI, A. A.; EMERENCIANO, D. B. Análise de tronco digital: uma nova metodologia para a medição de anéis de crescimento. Floresta, Curitiba, v. 33, n. 3, p. 235-255, 2003.
SCHMIDT, P. B. Determinação indireta da relação hipsométrica para povoamentos de Pinus taeda L. Revista Floresta, Curitiba, v. 8, n. 1, p. 24-27, 1977.
SCHNEIDER, P. R. Modelo de equação e tabelas para avaliar o peso de casca de acácia-negra, Acacia mearnsii de Wild.
1978. 149 f. Dissertação (Mestrado em Engenharia Florestal) -Universidade Federal do Paraná, Curitiba, 1978.
SCOLFORO, J. R. S. Biometria florestal 2: técnicas de regressão aplicada para estimar: volume, biomassa, relação hipsométrica e múltiplos produtos de madeira. Lavras: UFLA/FAEPE/DCF, 1997. 292 p.
SOCIEDADE DE PESQUISA EM VIDA SELVAGEM E EDUCAÇÃO AMBIENTAL. Manual para recuperação da reserva florestal legal. Curitiba: FNMA, 1996. 84 p.
STOFFELS, A.; SOEST, J. van. The main problems in sample plots. Ned Bosbouwtijdschr, v. 25, p. 190-199, 1953.