www.scielo.br/rbg
CRUSTAL SEISMIC ANISOTROPY AT THE EDGE OF THE SOUTH-EAST BORDER
OF CARIBBEAN AND SOUTH AMERICAN PLATES
Tomislav E. Monjak Espinoza and Laura Teresa Pi˜nero-Feliciangeli
ABSTRACT.Anisotropic properties in the NE of the Caribbean-South American plate are investigated based on the analysis of shear-wave splitting from new S local phase data. At the collisional front in the Caribbean and the South American plates and within the retro-arc region, fast wave polarization from local S phases show considerable variability. δt are small (<0.14 s) and no dependence with depth is observed suggesting the presence of an heterogeneous anisotropic region confined to the crust and that most of the upper-mantle wedge is isotropic. In the fore-arc,φ is fairly constant, the average value is sub-parallel to the Lesser Antilles trench and differs from teleseismic result, which is perpendicular to the trench, which suggests that the crust and mantle are decoupled. The difference between the δt found in S local events and teleseismic, suggests that there is another source of deep anisotropy, which can be attributed to mantle flow underneath or around the edges of the subducting Atlantic plate beneath the Caribbean. A mix combination of deformation mechanism such as micro-fractures EDA and vertical foliation on metamorphic rocks could be responsible for the large variability found forδt in S local phases in this region.
Keywords: seismic anisotropy, deformation mechanisms, shear-wave splitting, crust, mantle.
RESUMEN.Se investigan las caracter´ısticas anisotr´opicas en el NE de la placa Caribe-Sur Am´erica basados en el an´alisis de nuevos resultados del desdoblamiento de ondas de corte en fases locales S. En el frente de colisi´on entre placa Caribe y Suramerica y en la zona de retro-arco, la polarizaci´on de onda r´apida en eventos locales S muestran considerable variabilidad. Losδt son peque˜nos (<0,14s) y no presenta dependencia con la profundidad, sugiriendo la presencia de una regi´on anisotrop´ıcamente heterogenea confinada a la corteza, siendo adem´as la cu˜na del manto superior isotr´opico. En el ante-arco,φ es poco variable, el valor promedio es sub-paralello a la trinchera de las Antillas Menores y difiere del valor obtenido para fases teles´ısmicas el cual es perpendicular a la trinchera, lo cual sugiere que la corteza y el manto en esta zona se encuentran desacoplados. La diferencia entre losδt en eventos locales S y teles´ısmicos, sugiere que existe otra fuente de anisotrop´ıa profunda, que se puede atribuir a flujo mant´elico debajo o alrededor de los bordes de la placa Atl´antica en subducci´on debajo del Caribe. Una combinaci´on de mecanismos de deformaci´on, tales como micro-fracturas EDA y foliaci´on vertical en rocas metam´orficas podr´ıa ser responsable de la gran variabilidad encontrada en losδt en fases S locales en esta regi´on.
Palabras claves: anisotrop´ıa s´ısmica, mecanismos de deformaci´on, doblamiento de ondas de corte, corteza, manto.
Instituto de Ciencias de la Tierra, Facultad de Ciencias, Universidad Central de Venezuela, Caracas, Venezuela, Aptdo. 3895, Caracas 1010-A. Phone: ++58212-6051020; Fax: ++58212-6051152 – E-mails: tomislav.monjak@ciens.ucv.ve; laura.pinero@ciens.ucv.ve
i i
“main” — 2014/4/10 — 18:38 — page 596 — #2
i i
596
CRUSTAL SEISMIC ANISOTROPY AT THE EDGE OF THE SOUTH-EAST BORDER OF CARIBBEAN AND SOUTH AMERICAN PLATESINTRODUCTION
The Caribbean-South American (Ca-SA) plate boundary at its most southestern end is a broad and complex area which includes: i) the active island arc of the Lesser Antilles subduc-tion zone, ii) to the south, a system of active transform faults with EW strike enframed by a series of litotectonic metamorphic belts oriented in the same direction, and iii) the deformed belt folds of the Mountain range of la Serrania del Interior. Being this area a natural laboratory for the study of geodynamic processes at work and frozen from past deformations in the region, we investigated the degree and possible causes of lithospheric de-formation through the study of seismic anisotropy.
On the Earth, there are many mechanisms that can cause seis-mic anisotropy, and all reflect a kind of order in the media. In the “fragile” part of the upper crust, seismic anisotropy is associated mostly to the orientation or shape preference orientation (SPO) of inclusions. These include: the alignment of a series of faults or vertical cracks opened due to the present stress regime (Crampin, 1981) or isotropic alternating layers with different elastic prop-erties (Backus, 1965). At intermediate crustal regions is mainly due to the crystallographic preference orientation (CPO) or lattice preference orientation (LPO) of micaceous minerals (biotite, mus-covite, horblenda) (Meissner et al., 2006; Lloyd et al., 2009) and in deeper parts is caused by amphibole (Meissner et al., 2006; Tatham et al., 2008).
Seismic anisotropy in the case of the mantle (200-400 km), has been widely studied and is attributed to the crystallographic preferred orientation (CPO) of olivine crystals, due to past de-formation “frozen” in the lithosphere and/or the finite response to forces produced by the current asthenospheric flow (Silver, 1996; Savage, 1999).
Seismic anisotropy is defined as the variation in wave ve-locity with respect to the direction of propagation (Silver, 1996). When a transverse S wave travels through an anisotropic medium, splits into two mutually orthogonal components, which propagate at different speeds. The polarized component parallel to the fast direction (QS1) leads by a timeδt the orthogonal slow compo-nent (QS2). The anisotropy is characterized by two parameters: a) the direction of polarization(φ) of the fast shear wave, which is determined by the elastic properties of the medium and the prop-agation direction, and b) the delay time(δt), which is defined by the length of the path through which the wave travels and the speed difference between QS1 and QS2. The study of seismic anisotropy by shear wave splitting has good lateral resolution and low vertical resolution (Silver, 1996). However, analyzing local S phases from earthquakes with different hypocentral distances
in subduction zones, allows us to estimate the variation of seis-mic anisotropy with depth, thereby improving the vertical resolu-tion (Morley et al., 2006; Greve et al., 2008; Pi˜nero-Feliciangeli & Kendall, 2008). This consents us to obtain valuable informa-tion about regional neotectonics and geodynamics, define the degree of anisotropy at the lithosphere, and locate the possible anisotropic sources.
Studies of shear-wave splitting in northeast Venezuela, have been carried out by different authors (Russo et al., 1996; Pi˜nero-Feliciangeli & Kendall, 2008; Growdon et al., 2009). In gen-eral, the fast polarization direction (φ) for SK(K)S teleseismic events is parallel to the transform faults systems (Russo et al., 1996; Pinero-Feliciangeli & Kendall, 2008) and at the Lesser Antilles volcanic arc is perpendicular to the trench (Growdon et al., 2009).
The delay time(δt) between the fast and slow shear wave for teleseismic phases, varies between 2.1 s and 1.0 s. Results indicate and increase of δt (greater than 1.9 s) towards the Ca-SA collisional front, suggesting an increase of deformation associated with the development of a strong alignment in upper mantle peridotites as a result of compression and shear melt-ing linked to South America subductmelt-ing its own plate (Pi˜nero-Feliciangeli & Kendall, 2008; Growdon et al., 2009). Values of δt, for local S phases (from events with hypocenters < 200 km) in northeastern Venezuela are small (0.11 s to 0.14 s). This re-sult suggests that the anisotropy is generated by sources near the surface, possibly the crust (Pi˜nero-Feliciangeli & Kendall, 2008). In this paper we study seismic anisotropy in the most south-eastern edge of the Ca-SA boundary zone using shear wave methodology at local S phases from earthquakes located in the subduction lithosphere and transcurrent plate boundary. The re-sults were compared with those obtained by Russo et al. (1996) Pi˜nero-Feliciangeli & Kendall (2008) and Growdon et al. (2009) for both local and teleseismic S phases (SK(K)S) in the same area. From this analysis, different possible sources of anisotropy in northeastern Venezuela are discussed.
Tectonic Framework
The boundary between the Caribbean and South American plates, geographically located north of Venezuela, is a geodynamically complex area. This region was long regarded as a transform boundary (Molnar & Sykes, 1969; Perez & Aggarwal, 1981). However, recent evidence has defined this range as a wide trans-pressional zone more than 100 km wide, extending from Colom-bia to Trinidad, and where different tectonic processes such as: tectonic block partition deformation (compression and shear)
Figure 1 – Structural map of the Caribbean Region (after Pindell & Kennan, 2009).
and subduction act simultaneously (Audemard et al., 2005; Schmitz et al., 2008) (Fig. 1).
In the SE edge of the Caribbean-South American Plate, which corresponds to our study area, two major geodynamic processes are at work. The first correspond to the partitioning of efforts oc-curring along a dextral lateral displacement between the major El Pilar fault (which strikes in EO direction), Los Bajos-El Sol-dado faults, which have a NW-SE trending, and several shear syn-thetic Riedel faults and/or minor faults that are parallel to all of them. Simultaneously, shortening in the NNW-SSE orientation, which takes place from Blanquilla Island in the north, to the ac-tive thrust front of the Serrania del Interior, in the south (Aude-mard et al., 2005). The second process that takes place in this region is a type-A subduction, which corresponds to the sinking of the South American oceanic lithosphere along the island arc of the Lesser Antilles (Audemard et al., 2005). The subducting litho-sphere is coupled to continental South America in the northeast of Paria Peninsula, evidenced by the very small relative move-ment through the Atlantic passive margin. Southwest of Paria the subducting lithosphere decouples and extends from 150 to 200 km up to the central part of the deformation belt of Venezuela (VanDecar et al., 2003). The presence of oceanic lithosphere be-neath Northeast Venezuela, modifies the existing balance of forces in the region and places a sub-surface load on mainland South America, causing depression of the crust and mantle movement
beneath it. This fact, which has led to a process of pseudo-isostasy, is responsible for the large negative Bouguer anomaly values (about −200 mgal), located in northeastern Venezuela and Trinidad (VanDecar et al., 2003). On the other hand, it has been reported that the movement of the Caribbean with respect to the South American plate is 2 cm/year (Weber et al., 2001).
DATA
Records from 10 broadband three-component seismic stations, located in the northeastern of Venezuela, were examined. Six of them are part of the National Seismological Network FUNVI-SIS (VE Network, stations CRUV, GUIV, GUNV, ITEV, IVAV and AVEV), four were part of the “Experimento Pasivo del Caribe”, acquired as part of the Bolivar Project during the years 2001-2004 (XT Network, MIPC, CUPC, and DRKS BLOS) (Levander et al., 2006). Where DRKS and BLOS correspond to Ocean Bottom Seismometers (OBS) that were correctly oriented using Niu et al. (2007) (Fig. 2).
A total number of 346 earthquakes recorded between 2003 and 2009, with magnitude equal or greater than 3, hypocenters from 0-200 km and between the quadrant 18◦ and 8◦north lat-itude and −65◦ and−60◦ west longitude, were selected be-cause their high signal to noise ratio. Earthquakes originated at the Lesser Antilles subduction zone and the fault system (e.g. El Pilar fault).
i i
“main” — 2014/4/10 — 18:38 — page 598 — #4
i i
598
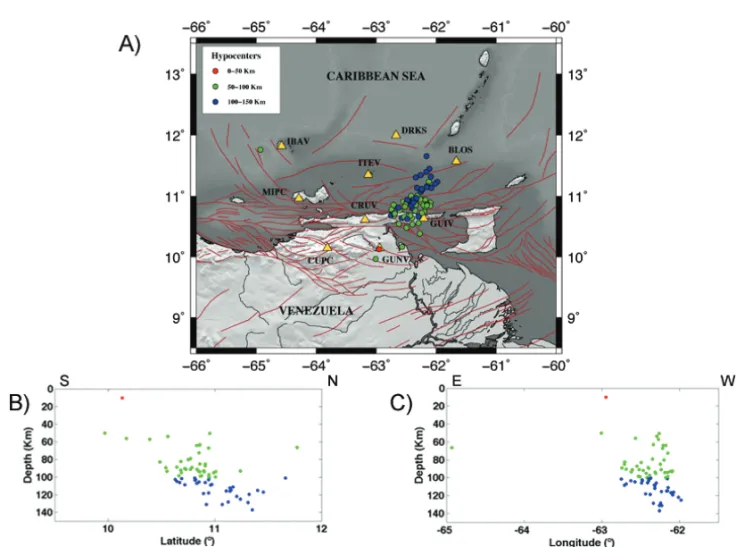
CRUSTAL SEISMIC ANISOTROPY AT THE EDGE OF THE SOUTH-EAST BORDER OF CARIBBEAN AND SOUTH AMERICAN PLATESFigure 2 – A) Map showing stations and events used in this study. Yellow triangles indicate stations from the Seismological Venezuelan Network (FUNVISIS) and XT Network from BOLIVAR Project. Events analyzed coloured scaled: red circle hypocenters between 0-50 km, green circle with hypocenters between 50-100 km and blue circle between 100-150 km. B) Earthquakes NS projection with depth. C) Earthquakes EO projection with depth.
In order to avoid any kind of deformation that shear waves could suffer due to dispersion and conversion from S to P when reflecting at the surface, all waves selected for the analysis were inside the critical window, incidence angle respect to the verti-cal less than 45◦(Evans, 1984). The incidence angle depends on theV p/V s ratio and was calculated directly using the depth and epicentral distance of the earthquake. Critical windows for angles of 45◦have been used in studies of local events S in other sub-duction zones (e.g. New Zealand, Morley et al., 2006).
In order to improve the signal to noise ratio, pre-processing before shear waves analysis was achieved by filtering the sig-nal with a butterworth band-pass, 2 poles and cut-off frequency from 1.0 to 2.7 Hz.
DATA ANALYSIS
Shear-wave splitting study for local-S phases was performed us-ing Silver & Chan (1991) methodology, where the smallest eigen-value of the covariance matrix for the two-dimensional horizontal movement of the particle motion is minimized over all the pos-sible values of the matrixφ and δt. For this general case, the
initial polarization of the event is not known; the orthogonal com-ponents correspond to a radial and transversal component of the S wave particle motion, which are contained in the plane perpen-dicular to the direction of wave propagation. The phase compo-nents for local-S will be referred to as “radial” and “transverse” because it does not exactly correspond to the SK(K)S phase spe-cial case, where the polarization of the wave is contained directly in the sagittal plane. Additionally, the possible subjectivity with the selection of the initial window enclosing the phase of inter-est (S, SKS or SKKS) was reduced by using Teanby et al. (2004) algorithm, which is based on a cluster analysis and minimizes the uncertainty that could be obtained for the parameters.
When undertaking shear-wave splitting analysis for local S phases, two starting times prior to the start of interest S phase and two final times after the phase, must be manually choose. These intervals should not include other phases that may affect the stability of the result. For this selection 100 equally spaced windows are automatically generated, and splitting parametersφ andδt are calculated for each analysis using the Silver & Chan (1991). Finally, cluster analysis in order to assess the stability of the result (Teanby et al., 2004) is performed.
In addition there are a number of practical issues to consider when finding the best value of anisotropic parameters(φ, δt). These are:
i) the presence of noise similar to the dominant frequency for the analyzed phase (S phase),
ii) no anisotropy in the course of the wave giving a null measurement,
iii) initial polarization near the symmetry axis also getting a null measurement, and
iv) cycle skipping.
The window for selecting the phase of interest, in this case S-phase, cannot be so big because it can produce cycle skipping, where the first peak of the shape of the slow wave is set to the first peak of the fast shear wave. This will cause the value ofδt to be greater than he true value of splitting by an integer multiple of half the dominant frequency of the shear wave (may also cause a shift in the calculated φ±90◦(Silver & Savage, 1994).
Therefore, it is important to establish a good criteria for se-lecting “good” anisotropic parameters. In this work were used the following:
i) there must be a clear presence of energy in any/or both transverse components before correction (this is indicative of the presence of seismic anisotropy) and the elimination of energy in the transverse component after correction; ii) elliptical particle motion before correction and proper
linearization after;
iii) a well-defined minimum for the parameter φ and δt obtained;
iv) a stable and consistent measure of error estimation using the cluster criterion (Teanby et al., 2004), which reduces any subjectivity regarding the selected initial window. One example of the splitting analysis performed on a S local arrival at station GUNV recorded on July 25 of 2005 is shown in Figure 3. With these plots we can evaluate the quality, reliabil-ity and stabilreliabil-ity estimated for the shear-wave splitting parameters (φ, δt) obtained. Note how the energy in the transverse compo-nent is minimized, the elliptical motion of the particle is success-fully linearized, and the fast and slow wave align after correction. The results are stable and small error bars were obtained for the 100 windows calculated, producing a single cluster for this spe-cific result and giving reliability to the valuesφ and δt calculated.
Shear wave splitting parameters that show a lack of depen-dence on station-to-source backazimuth indicate wave propaga-tion through a medium with hexagonal symmetry and horizon-tal symmetry axis (HTI). On the other hand, dependence on the backazimuth of 90◦or 180◦ periodicity could indicate the pres-ence of multiple layers or a dipping symmetry axis (Savage, 1999). However, a proper evaluation of both posibilities requires a good backazimuthal coverage of events.
The percentages of anisotropy at each station were calculated using Silver (1996) relation,
%anisotropy = [VsH∗ ∂t]∗ 100% (1) whereV s is the fast shear wave average velocity through the medium travelled, the minimum depthH studied at the station andδt is the delay time between the fast and slow shear wave phases. Table 1 shows the characteristics and number of events that were obtained for each station examined.
After doing the SWS analysis at all stations included in this study, no acceptable solutions, matching the good criteria mentioned above, was found for stations AVEV and IBAV (VE Network) and DRKs, MIPC and CUPC (XT Network).
RESULTS
A total of 89 pairs of anisotropic parameters(φ, δt) were obtained in this study.
Based on our established selection criteria for “good” results, at station CRUV we obtained 15 pairs of anisotropic parame-ters. The local events analysed had hypocentre depths between 82 km and 131 km and azimuth between 50◦to 84◦. Waves fast polarization directions obtained are shown in rose diagram at Figure 4. In Figure 5 plots of φ and δt vs. backazimuth are shown, where results from Pi˜nero-Feliciangeli & Kendall (2008) have been included for this station.φ shows great variability, its average value is 92◦, the error±1σ for this parameter is 37◦ and the confidence intervals forα = 0.05 was 19◦ (Table 2). No periodicity was observed for the anisotropic parameters at this station, although, the events analysed for this stations had limited backazimuths (see Fig. 5). The variability observed could indicate a complex pattern of anisotropy below the station. Re-garding the delay times(δt), the values obtained are quite small and have little variability, ranging between 0.08 s-0.17 s, with ±1σ values of 0.02 s, 95% confidence intervals of 0.01 s. In Figure 6 the graph ofδtvs. depth is shown, the results from Pi˜nero-Feliciangeli & Kendall (2008) were included. The vari-able does not show dependence with depth, suggesting that the source generating anisotropy is shallow.
i i
“main” — 2014/4/10 — 18:38 — page 600 — #6
i i
600
CRUSTAL SEISMIC ANISOTROPY AT THE EDGE OF THE SOUTH-EAST BORDER OF CARIBBEAN AND SOUTH AMERICAN PLATESFigure 3 – Example of an S splitting result for an earthquake (07/25/05) recorded at station GUNV. Left-top: “Radial”, “transverse” and vertical component seismo-gram. Note window used to isolate the shear-wave form of interest. Right-top: “Radial” and “transverse” component before and after applying the inverse splitting operator. Note how well the energy on the “transverse” component is reduced (compare bottom trace with that second from the top). Left-bottom: Fast (solid) and slow (dashed) shear-wave S forms, before and after correction for anisotropy induced splitting (top) and corresponding particle motion diagrams (bottom). Note how splitting correction linearizes the particle motion. Right-bottom: Contour plot of energy on the corrected “transverse” component (left corner). The best solution is the one giving minimum energy on the transverse component, indicated by black star within the double thickness contour (95% confidence contour). Plots at the top-right and bottom-right corner of that quadrant, shows results ofφ and δt for all 100 windows generated around the S phase wave selected.
Table 1 – Seismic stations used in this study. Information specified from left to right: seismological network, ID code, latitude, longitude, number of events and recording time period.
Red Station Location Latitude Longitude Elevation No. Time (◦N) (◦O) (m) events period VE CRUV Car´upano 10.6272 63.1847 786 15 2003-2009 VE GUIV G¨uiria 10.6406 62.2136 49 33 2003-2009 VE GUNV Guanoco 10.1528 62.9486 64 10 2003-2009 VE AVEV Isla de Aves 15.6733 63.6166 1 0 2005-2006 VE IBAV Isla La Blanquilla 11.8264 64.5833 100 1 2003-2009 VE ITEV Isla Los Testigos 11.3586 63.1422 1 23 2003-2009 XT CUPC Cumanacoa 10.1501 63.8168 0 0 2003-2005 XT MIPC Isla Margarita 10.9653 64.2905 0 0 2003-2005 XT BLOS OBS 11.5708 61.6677 –461 6 2004-2005 XT DRKS OBS 11.9992 62.6685 –2400 1 2004-2005
We obtained 33 pairs of φ and δt anisotropic parameters for station GUIV. The events analyzed came from depths between 50 km to 131 km and cover a wide range of backazimuth (0◦to about 360◦). In Figure 4 is shown the corresponding rose dia-gram. The averageφ and δt obtained were 78◦ and 0.12 s re-spectively. Graphs ofφ and δtvs. backazimuth are shown in Figure 5. Large variability is observed forϕ, with ±1σ equal to 37◦, however, the 95% confidence interval is 12◦. On the other hand, the delay times are quite stable (±1σ of 0.01 s), and with 95% confidence interval of 0.01 s. δt does not exhibit depen-dence with depth and is less than 0.2 s (Table 2) (Figs. 5 and 6), suggesting a shallow source the anisotropy at station CRUNV.
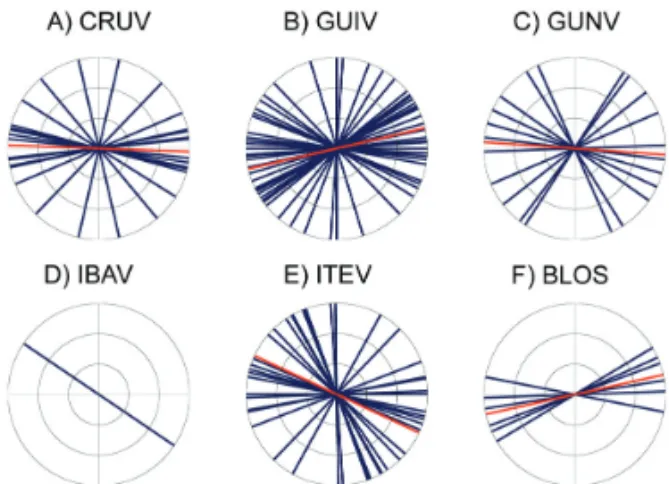
Figure 4 – Rose diagrams A) Station CRUV; B) Station GUIV; C) Station GUNV; D) Station IBAV; E) Station ITEV; F) Station BLOS. Red line indicates the average value ofφ.
Station GUNV produced 10 good quality shear wave-splitting results. Events hypocenters were between 10 km and 103 km and backazimuth (2-88)◦. Individual results are plotted in rose di-agrams shown in Figure 4. The average polarization and delay times obtained for this station are 94◦ and 0.14 s respectively. Values of delay times values are less than 0.22 s, do not ex-hibit dependence with depth (Fig. 6), and show little variability with±1σ of 0.06 s and 95% confidence interval of 0.04 s. For the fast polarization substantial variability is observed (between 33◦ and 56◦) (Fig. 4), with a standard error of ±1σ of 44◦ and 95% confidence interval of 28◦. The values obtained are the broadest found among all stations analyzed in this study, indi-cating a much more complex anisotropic structure, than a simple anisotropic layer with hexagonal symmetry and a horizontal sym-metry axis of anisotropy.
At IBAV, due to the poor signal to noise ratio and scars num-ber of earthquakes within the critical window just a single result was obtained from a local S phase (Fig. 4). However, the quality of the result is very good and the estimated error forφ and δt is very small. The reported polarization is 124.00◦ ± 3.75◦and delay time is 0.16 s± 0.03 s.
Station ITEV gave 23 splitting results, for earthquakes com-ing from depths between 88 km to 137 km and backazimuth of 84◦ to 150◦ with respect to the station. The average values of fast polarization and delay time for this station are 115◦ and 0.14 s respectively. Graphs ofφ and δt vs. backazimuth and depth (Figs. 7 and 8) show that values ofδt are quite small (less than 0.21 s) and have little variability with respect to the average ±1σ of 0.04 s, while the polarization values show great variabil-ity with±1σ of 41◦(see Figs. 4 and 7). Confidence intervals of 95% forσ and δt are 17◦and 0.02 s respectively.
At station BLOS, OBS located between Granada Basin and Paria Peninsula (11.57◦ N-61.67◦ W) and which were part of the Passive SE Caribbean Experiment, a total of 6 local events with good signal to noise ratio gave good results. The events had hypocentral depths between 93 km and 118 km with back-azimuth from 226◦ to 230◦. At this station the average fast po-larization direction was 78◦and the delay time equal to 0.13 s. Rose diagrams are shown in Figure 4. φ and δt as a function of backazimuth and depth are shown in Figures 7 and 8. Delay times are less than 0.18 s, and both values, fast polarization di-rections and delay time are fairly constant and slightly dispersed with standard errors of 16◦ and 0.03 s, and 95% confidence intervals of 12◦and 0.02 s respectively.
In general, the stations analyzed in this study with the smaller 95% confidence intervals (±12◦ from the mean) are GUIV and BLOS, indicating a high reliability in the mean val-ues calculated for each of the stations. ITEV with 95% confi-dence interval of 16◦, and 19◦ for CRUV indicate greater vari-ability at these stations. Finally GUNV has considerable variabil-ity for parameterφ indicating that below this station anisotropy structure is more complex than an anisotropic layer with hexag-onal symmetry and horizontal symmetry axis. Small errors as-sociated with delay times (between±0.01-0.04 s) at all stations indicate high reliability in the results. Low variability ofδt with depth suggests a possible source of anisotropy located in the crust (± 10 km depth).
The anisotropic parametersφ and δt results and % values for each station are summarized in Table 2. In Figure 9 the av-erage results are shown, additionally were included results both from S phases and teleseismic phases obtained by Russo et al. (1996), Pi˜nero-Feliciangeli & Kendall (2008) and Growdon et al. (2009).
DISCUSSION
The study region was divided according to its structural features and the stations were gathered based on the area. a) Zone 1:
i i
“main” — 2014/4/10 — 18:38 — page 602 — #8
i i
602
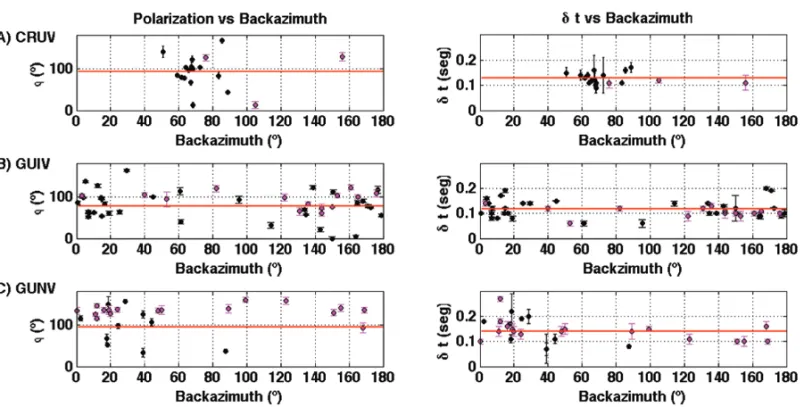
CRUSTAL SEISMIC ANISOTROPY AT THE EDGE OF THE SOUTH-EAST BORDER OF CARIBBEAN AND SOUTH AMERICAN PLATESFigure 5 – Polarization and delay time plotsversus backazimuth. A) Station CRUV; B) Station GUIV; C) Station GUNV. Red line indicates average values for the parameters. Results obtained in this study are shown in black colour. Results shown in magenta where obtained by Pi˜nero-Feliciangeli & Kendall (2008).
Figure 6 – Plots of polarization and delay timeversus hypocenter for: A) Station CRUV; B) Station GUIV; C) Station GUNV. Results obtained in this study are shown in black colour. Results shown in magenta where obtained by Pi˜nero-Feliciangeli & Kendall (2008).
the continental collisional front area where the transpressive fault system is located (e.g. El Pilar) (CRUV Stations, GUIV and GUNV); b) Zone 2: forearc area (BLOS Station); c) Zone 3: backarc zone in the Granada Basin (ITEV Station) and backarc area, stations located in the Venezuela basin (IBAV) (Fig. 9).
Zone 1. Northeastern Venezuela and Trinidad, at the
bound-ary between the Caribbean and South American plates, is part
of the Cordillera de la Costa belt which is characterized by a strong east-west dextral shear component and north-west com-pressional component (Audemard et al., 2005). The narrow zone that forms the Araya Peninsula, Paria Peninsula and the North-easter Cordillera is characterized by litotect´onicos subbelts iden-tified due to their mineralogical assemblage and the tectonic con-tacts that bound them (Lallement & Guth, 1990). The lithotec-tonic units are highly deformed metamorphic belts composed by
Figure 7 – Polarization and delay time plotsversusbackazimuth for: A) Station ITEV; B) Station BLOS. Red line indicates average values for the parameters.
Figure 8 – Plots of the polarization and delay timeversushypocenter for: A) ITEV; B) BLOS.
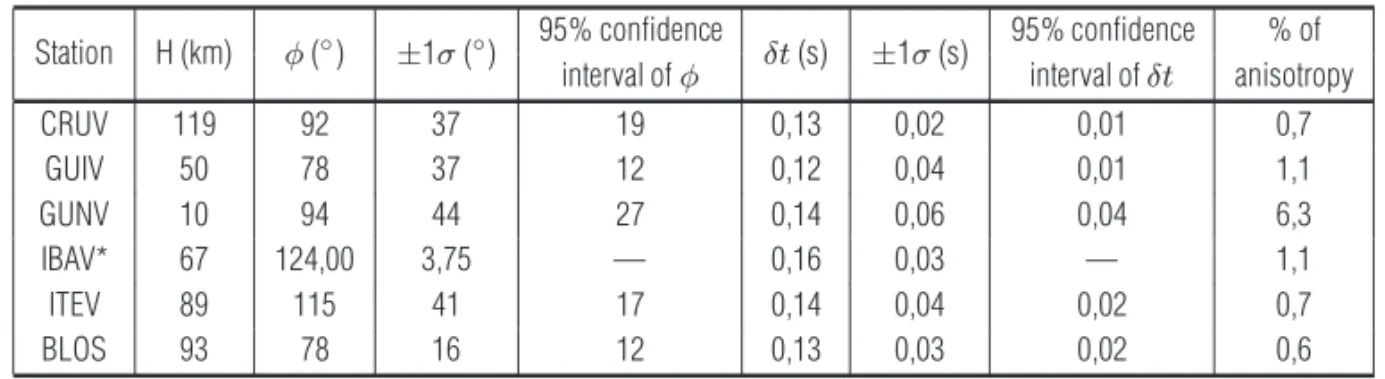
Table 2 – Average values of the anisotropic parametersφyδt ± 1σ, 95% confidence intervals and % of anisotropy for stations analyzed. Station H (km) φ (◦) ±1σ (◦) 95% confidence δt (s) ±1σ (s) 95% confidence % of
interval ofφ interval ofδt anisotropy
CRUV 119 92 37 19 0,13 0,02 0,01 0,7 GUIV 50 78 37 12 0,12 0,04 0,01 1,1 GUNV 10 94 44 27 0,14 0,06 0,04 6,3 IBAV* 67 124,00 3,75 — 0,16 0,03 — 1,1 ITEV 89 115 41 17 0,14 0,04 0,02 0,7 BLOS 93 78 16 12 0,13 0,03 0,02 0,6
*Result for this station correspond just to one local event.
pelitic schists, quarzite, granitic gneiss, marble, metasandstone and metavolc´anic material from the Macuro assamblege, Uquire, Cariaquito, Guinimita and Dragon Gneiss. The degree of meta-morphism decreases from north to south from the amphibolite facies to subgreenschist facie (Cruz et al., 2007).
Stations CRUV and GUIV, located in this area, in the collision zone north of the El Pilar fault, exhibits an average polarization of 92◦ and 78◦, and a delay time of 0.13 s and 0.12 s respec-tively. The estimated 95% confidence interval for these stations were 19◦ for CRUV and 12◦ for GUIV (Table 2). However, it is
i i
“main” — 2014/4/10 — 18:38 — page 604 — #10
i i
604
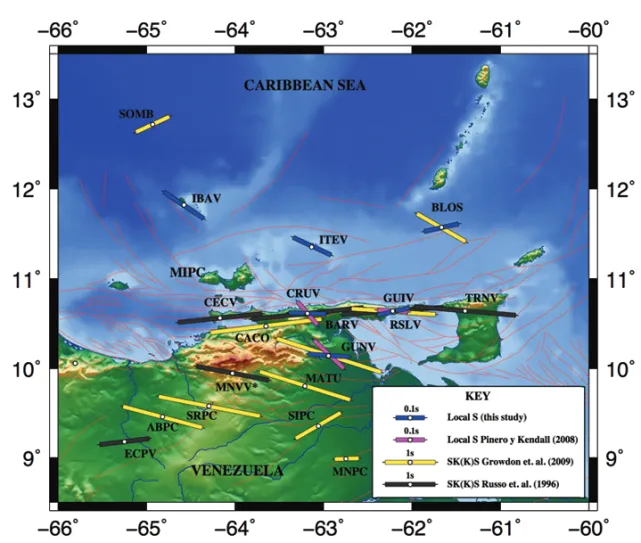
CRUSTAL SEISMIC ANISOTROPY AT THE EDGE OF THE SOUTH-EAST BORDER OF CARIBBEAN AND SOUTH AMERICAN PLATESFigure 9 – Average values of fast polarization direction in the north-northeast of Venezuela and parts of the Caribbean. Gray bars correspond to values from SK(K)S phases from Russo et al. (1996); yellow bars correspond to values from SK(K)S calculated by Growdon et al. (2009); magenta bars correspond to values from local phases calculated by Pi˜nero-Feliciangeli & Kendall (2008) and blue bars are values calculated from this study. White dots represent the station location. The arrows represent direction of propagation of the absolute plate motion from the Caribbean y South American (SA) plate (Kreemer et al., 2003).
observed that the values of φ show considerable variability (Figs. 4 and 5), which could indicate a more complex anisotropic structure below the stations. Hence, it would be important to assess a structure with greater complexity than an anisotropic layer with hexagonal symmetry and horizontal axis of symmetry. However, better coverage with respect to seismic backazimuth is needed in order to assess the presence of multiple anisotropic layer or dipping symmetry axis.
Similarly as the result at station CRUV, station GUNV, φ average is roughly in EW direction. This station is located south of the San Juan graben near the Pilar fault, where normal faults (such as R´ıo San Juan fault) which bounds the graben has a sim-ilar trend to the regional direction of maximum horizontal com-pressional stress (NNW-SSE) (Audemard et al., 2005) (Fig. 9). However, station GUNV showed one of the greatest variability, with a 95% confidence interval quite broad, equal to 28◦, strongly suggesting that anisotropy beneath the station is heterogeneous.
Regarding the values ofδt found at stations CRUV, GUIV
and GUNV are quite small with s≤ 0.14 (see Table 2) and show no variability with respect to depth (Figs. 5 and 7), indicating no dependence with depth. These results obtained from local S phase suggest a shallow source of anisotropy possibly confined in the crust.
Despite the variability obtained atφ, we can observe that the average values of CRUV, GUIV and GUNV stations agree with the strike of major faults in the area (e.g. El Pilar fault). The ver-tical foliation induced in crustal rocks could be considered the dominant mechanism of generation of anisotropy. This mecha-nism could extend and reach levels of intermediate or lower crust by the CPO of mica or amphibole (Meissner et al., 2006; Tatham et al., 2008; Lloyds et al., 2011).
Discrepancy was found between the results at local S phases from this study and those obtained by Pi˜nero-Feliciangeli & Kendall (2008) at stations CRUV, GUIV and GUNV. Shear-wave fast polarization direction (φ) at CRUV is approximately EO and differs from the calculated by Pi˜nero-Feliciangeli & Kendall
(2008), whereφ is oblique to El Pilar fault (Fig. 8). The differ-ence could be related to the depth of the events analyzed. Among the four events studied by Pi˜nero-Feliciangeli & Kendall (2008), three are located at depths of≈11 km (Fig. 6), and therefore φ could be associated with shallow regions of the crust (≈10 km). The dominant mechanism generating the anisotropy would therefore be the presence of stress-induced microcracks or in-clusions (EDA) linked to the maximum compressional horizon-tal stress in the area (NNW -SSE) (Audemard et al., 2005). Fur-thermore, in the present study, events analyzed for this station generated between 82 km to 131 km depths and the values ofφ are approximately parallel to the major geological structures in the area, El Pilar Fault (Fig. 9). As such, we could speculate that the dominant mechanism responsible for the generation of the anisotropic structure at these depths is the vertical foliation in-duced by transform faults. However, analysis ofδt values implies that up to 150 km no dependence of the parameter is observed with depth (see Fig. 6). This suggests a shallow source of anisotropy< 10 km deep, confines it to the crust and indicates the existence of a weakly anisotropic layer between depths of 10 km and 150 km, which would imply that the crust and man-tle are decoupled.
In the case of GUNV is important to point out that results obtained by Pi˜nero-Feliciangeli & Kendall (2008) reflects the trend of maximum horizontal compressional stress of the area (NNW-SSE) and not the EW direction obtained in this study. For the case of GUIV,φ is 78◦, being the value slightly displaced relative to the direction EW obtained by Pi˜nero-Feliciangeli & Kendall (2008). In both cases, the range of hypocentral depths match, not showing evidence of dependence with depth. However, due to the considerable variability observed inφ, it is difficult to identify the dominant mechanism that produces anisotropy. Both, the induced vertical foliation in metamorphic rocks and the stress-induced microfractures (EDA) could be responsible for the fast polarization measured at GUNV and GUIV.
In general, the percentage of minimum anisotropy is 0.7% below CRUV, 1.1% below GUIV and 6.3% at station GUNV. The high value obtained for the anisotropy at station GUNV was ob-tained considering that the smaller hypocentral event was ana-lyzed at 10 km depth, suggesting that seismic anisotropy is con-fined in the crust below the station.
Values ofδt obtained in local S phases (which range between 0.1 s and maximum 0.4 s), are considerably small (Fig. 9) in comparison with those obtained in teleseismic phases (SK(K)S) at stations located in the collisional front (1.9 s-2.1 s) (Russo et al., 1996; Growdon et al., 2009). These results suggest two
possible sources of anisotropy, one confined to the crust and an-other, as: i) fossil anisotropy in the layer of subducting oceanic crust and/or ii) anisotropy due to mantle flow beneath the layer of subduction.
As discussed by Pi˜nero-Feliciangeli & Kendall (2008), it would be unlikely that the presence of fossil anisotropy in the subducting layer could be responsible by more than 1.4 s of split-ting. Another possible explanation is the presence of astheno-spheric flow at the edges of subducting Atlantic plate. Studies of seismic tomography shows a detached Atlantic plate subducting under the collision front in NE Venezuela (VanDecar et al., 2003) and geodynamic simulations studies (Lowman et al., 2007) shows both 2D and 3D type flow solutions at the edges of the plates. This type of asthenospheric flow around the edges of the detached Atlantic plate in NE Venezuela, could explain the high values ofδt obtained at teleseismic phases found in the area.
Zone 2. In the forearc (Tobago Basin), analysis of shear waves
splitting obtained from local S phases at BLOS shows a fast polarization direction of 78◦, sub-parallel to the Lesser Antilles trench and approximately parallel to the fault of Los Testigos. The average delay time(δt) is 0.13 s (Fig. 9). The result for this station is one of the most stable of all stations analyzed in this study, and exhibits little variability in both anisotropic parame-ters. Furthermore, the only result of shear wave splitting obtained by Growdon et al. (2009) on SKS phases, was (−60±11)◦, which is approximately perpendicular to the island arc of the Lesser Antilles. The difference observed in the values of φ between local S phases and the teleseismic event could indicate that the crust and mantle is decoupled. Earthquakes hypocenters for events analyzed at BLOS are between 93 km and 118 km. The small delay times obtained (0.13 s) shows little variation with depth, suggesting that the measured anisotropy is caused by a shallow source, possibly located in the mantle wedge above 93 km depth. In contrast, the values of delay times for the tele-seismic event analyzed by Growdon et al. (2009) is 1.09 s. This implies that most of the splitting (>0.94 s) is generated below the Benioff zone in the layer of the subducting Atlantic oceanic crust and the mantle beneath the subducting layer. It is therefore likely that the source of anisotropy beneath the station maybe due to: a) fossil anisotropy in the layer of the subducting oceanic crust at the time of its generation in the mid-Atlantic ridge b) mantle beneath subducting plate. If we assume that the source of anisotropy evenly distributed in the Atlantic oceanic crust subducting layer and that this layer thickness is of 100 km, with a velocity ofV s = 4.5 km/s, the required percentage of anisotropy needed to generate the splitting is 4.2%. Another possibility is
i i
“main” — 2014/4/10 — 18:38 — page 606 — #12
i i
606
CRUSTAL SEISMIC ANISOTROPY AT THE EDGE OF THE SOUTH-EAST BORDER OF CARIBBEAN AND SOUTH AMERICAN PLATESthat the source of anisotropy is located deep beneath the sub-ducting layer and is due to 2D single type asthenospheric flow (Ribe, 1989). This kind of result has been observed in other sub-duction zones worldwide. Furthermore, the only value of shear-wave splitting on teleseismic phases obtained by Growdon et al. (2009) has aδt of 1.04 s, much smaller than does observed at some stations located in Zone 1 (collision front). Zone 1 is char-acterized by a strong EW shear component, and values obtained by Russo et al. (1996) reach a maximum value of 2.01 s. This could suggest a decrease in the degree of deformation in that region compared to the degree of deformation at the collisional front.
Regarding the deformation mechanisms which generates seismic anisotropy in the mantle wedge above the subducting Atlantic plate, and responsible for 0.13 s measured in local phases at BLOS, could be attributed to the induced anisotropy by the alignment of micro-fractures in the crust. Nevertheless, this can-not rule out the vertical foliation induced by nearby faults (Los Testigos), which agrees with the average fast direction φ ob-tained for this station (Fig. 9). Deeper mechanisms as hydrated olivine alignment in regions of high-stress (Jung & Karato, 2001) generated in the mantle wedge could generate fast polarization directions parallel to the trench, but this orientation does not match with the observations obtained. It is worth mentioning that this mechanism is unlikely because the events analyzed (between 98-113 km depth) were generated at depths and pressures well below those reported in Jung & Karato (2001) and Karato et al. (2008) experiments. The percentage of anisotropy for BLOS is 0.6% (Table 2).
Zone 3. At IBAV and ITEV stations, located in the backarc basin
of the Lesser Antilles (Venezuela and Grenada Basin), the aver-age polarization at both stations is oriented approximately in the NW-SE direction (IBAV, 115◦ and ITEV, 124◦), and delay times are 0.16 s and 0.14 s, respectively. At IBAV only one result, well confined, with low error, and fairly reliable, was obtained. Re-sults at ITEV show considerable variability forφ, suggesting an anisotropic structure beneath the station of greater complexity that anisotropic layer hexagonal symmetry and horizontal sym-metry axis. It is worth mentioning that station ITEV is located near to the collisional front, being possibly the reason of the complex-ity observed inφ. δt values for the station ITEV did not shown depth dependency (Fig. 8), suggesting like in other stations that the source of anisotropy is confined to the crust.
At station IBAV the observed polarization, nearly parallel to the fault of Punta Arenas, is sub-parallel to the regional max-imum horizontal compressive stress (NW-SE) associated with
the oblique collision between the Caribbean and South American plates (Audemard et al., 2005). The alignment of fractures and micro-fractures (fractures-EDA), full of fluid between the first 10-15 km of the crust and closest to the direction of maximum hori-zontal compressive stress, appears to be the best explanation for the amount of anisotropy measured (0,7% and 1.1% in ITEV in IBAV). Nevertheless, in the case of IBAV the effects of the verti-cal foliation in rocks induced by the fault of Punta Arenas cannot be dismissed (see Fig. 9). However, a larger number of obser-vations are necessary for a better understanding of the seismic anisotropy in the area.
CONCLUSIONS
In this study data from shear-wave splitting were investigated at S local events recorded by stations located in the NE end of Venezuela, where two distinguishing geological processes are at work:
i) the oblique collision between the Caribbean and South American plate, which generates a dextral transpressive slip environment and an entire strike-slip fault system, compressional faults and extensional motion; and ii) the subduction of the Atlantic plate and its detachment
under this complex collision system.
The fast wave polarization(φ) for local events S at stations located in the collisional front between the Caribbean and South America boundary (zone 1) shows considerable variability, which suggests that the anisotropic structure in this region is more complicated than a anisotropic layer with hexagonal symmetry and horizontal symmetry axis. The possible presence of two or more layers or dipping axis of symmetry may be the cause of the variability observed. It would be important to evaluate the presence of this type of structures.
In the forearc basin (zone 2) fast polarization directions from local S phases exhibits little variation thus the average value ofφ is sub-parallel to the Lesser Antilles trench direction. This value differs from the direction of polarization in teleseismic events, which is perpendicular to the trench, suggesting that the crust and mantle are decoupled.
In the backarc basin (zone 3), polarization shows consid-erable variability at the station nearest to the collisional front located in the Tobago basin. On the other hand, at the Venezuela basin, polarization agrees with the direction of the compres-sional stress.
Results of the shear wave splits at local events from up to 150 km deep in NE Venezuela show small values for δt
(< 0.14 s). Additionally, no depth dependency was found, which suggests that the anisotropy is confined to a shallow source, possibly crust.
Values forδt at local S phase (<0.14 s) obtained in this study and the ones obtained from teleseismic phases by other authors (Russo et al., 1996; Pi˜nero-Feliciangeli & Kendall 2008; Growdon et al., 2009), show a significant difference, up to 1.86 s suggesting that there is another source of anisotropy located deeper. One of the most likely explanations would be the pres-ence of mantle flow beneath and around the edge of the Atlantic subducting plate.
The main mechanisms generating anisotropy in regions of the crust that could be responsible for 0.14 s splitting observed are difficult to define given the considerable variability in the data. However, the existing evidence so far, points out that a com-bination of mechanisms such as micro-fracture alignment EDA and the vertical foliation in metamorphic rocks are one of the most likely interpretations.
The results of minimum average seismic anisotropy in the SE edge of the Caribbean-South American plate vary from between 0.8%-6.3%.
ACKNOWLEGMENTS
We would like to thank the Seismological Institute of Venezuela (FUNVISIS) for providing seismic data for this work and CDCH-UCV for financial support through Project PG-03-Group 8269-2011/1. We also would like to thank an anonymous referee who helped to improve this work.
REFERENCES
AUDEMARD FA, ROMERO G, RENDON H & CANO V. 2005. Quater-nary fault kinematics and stress tensors along the southern Caribbean from fault-slip data and focal mechanism solutions. Earth Sci. Rev., 69: 181–233.
BACKUS GE. 1965. Possible forms of seismic anisotropy of the upper-most mantle under oceans. J. Geophys. Res., 70: 3429–3439. CRAMPIN S. 1981. A review of wave motion in anisotropic and cracked elastic-media. Wave Motion, 3: 343–391.
CRUZ L, FAYON A, TEYSSIER C & WEBER J. 2007. Exhumation and deformation processes in transpressional orogens: The Venezuela Paria Peninsula, SE Caribbean-South American plate boundary. The Geologi-cal Society of America. Special Paper, 434: 149–165.
EVANS R. 1984. Effect of the free surface on shear wavetrains. Geophys. J. R. Astron. Soc., 76: 165–172.
GREVE SM, SAVAGE MK & HOFMANN SD. 2008. Strong variations in seismic anisotropy across the Hikurangi subduction zone, North Island, New Zealand. Tectonophysics, 462: 7–21.
GROWDON M, PAVLIS GL, NIU F & VERNON FL. 2009. Constraints on mantle flow at the Caribbean-South American plate boundary inferred from shear splitting. J. Geophys. Res., 114: 1–7.
JUNG H & KARATO S. 2001. Water-transitions in olivine. Science, 293: 1460–1463.
KARATO SI, JUNG H, KATAYAMA I & SKEMER P. 2008. Geodynamic Significance of Seismic Anisotropy of the Upper Mantle: New Insights from Laboratory Studies. Earth and Planetary Sciences. Annu. Rev. Earth Planet. Sci., 36: 59–95.
KREEMER C, HOLT WE & HAINES AJ. 2003. An integrated global model of present-day plate motions and plate boundary deformation. Geophys. J. Int., 154: 8–34.
LALLEMENT HGA & GUTH LR. 1990. Role of extensional tectonics in exhumtion of eclogites and blueschits in an oblique subduction setting: northeastern Venezuela. Geology, 18: 950–953.
LEVANDER A, NIU F, LEE C-TA & CHENG X. 2006. Imaging the conti-nental lithosphere. Tectonophysics, 416: 167–185.
LLOYDS G, BUTLER R, CASEY M & MAINPRICE M. 2009. Mica de-formation fabrics and the seismic properties of continental crust. Earth Planet. Sci. Lett., 288: 320–328.
LLOYD GE, BUTLER RHW, CASEY M, TATHAM DJ & MAINPRICE D. 2011. Constraints on the seismic properties of the middle and lower continental crust. In: PRIOR DJ, RUTTER EH & TATHAM DJ (Eds.). Deformation Mechanisms, Rheology and Tectonics: Microstructures, Mechanics and Anisotropy. Geological Society. London, Special Pub-lication. The Geological Society of London, 7–32.
LOWMAN JP, PI ˜NERO-FELICIANGELI LT, KENDALL J-M & SHAHNAS MH. 2007. Influence of convergent plate boundaries on upper mantle flow implications for seismic anisotropy. Geochm. Geophys. Geosyst. (Gcubed), 8: Q08007.
MEISSNER R, RABBEL W & KERN H. 2006. Seismic lamination and anisotropy of the lower Continental Crust. Tectonophysics, 416: 81–99. MOLNAR P & SYKES LR. 1969. Tectonics of the Caribbean and Mid-dle America regions from focal mechanisms and seismicity. Geol. Soc. Amer. Bull., 60: 1639–1684.
MORLEY A, STUART GW, KENDALL J-M & RAYNERS M. 2006. Mantle wedge anisotropy in the Hikurangi subduction zone, central North Island, New Zealand. Geophys. Res. Lett., 33: L05301.
NIU F, BRAVO T, PAVLIS F, VERNON F, RENDON H, BEZADA M & LEVAN-DER A. 2007. Receiver function study of the crystal structure of the
i i
“main” — 2014/4/10 — 18:38 — page 608 — #14
i i
608
CRUSTAL SEISMIC ANISOTROPY AT THE EDGE OF THE SOUTH-EAST BORDER OF CARIBBEAN AND SOUTH AMERICAN PLATES southeastern Caribbean plate Boundary and Venezuela. J. Geophys. Res.,112: B11308.
P´EREZ OJ & AGGARWAL YP. 1981. Present-day tectonics of the southeastern Caribbean and Northeastern Venezuela. J. Geophys. Res., 86: 10791–10804.
PINDELL J & KENNAN L. 2009. Tectonic evolution of the Gulf of Mexic, Caribbean and northern South America in the mantle reference frame: an update. In: The geology and evolution of the region between North and South America. Geological Society London, Special Publication. In: JAMES K, LORENTE MA & KENNAN L (Eds.), London, U.K. 328, 1–55. PI ˜NERO-FELICIANGELI LT & KENDALL J-M. 2008. Sub-slab mantle flow parallel to the Caribbean plate boundaries: Inferences from SKS splitting. Tectonophysics, 462: 22–34.
RIBE NM. 1989. Seismic anisotropy and mantle flow. J. Geophys. Res., 94: 4,213–4,223.
RUSSO RM, SILVER PG, FRANKE M, AMBEH WB & JAMES DE. 1996. Shear-wave splitting in northeast Venezuela, Trinidad, and the east Caribbean. Physics of the Earth and Planetary Interiors, 95: 251–275. SAVAGE MK. 1999. Seismic anisotropy and mantle deformation: What have we learned from shear wave splitting? Rev. Geophys., 37: 65–106. SCHMITZ M, AVILA J, BEZADA M, VIEIRA E, Y´ANEZ M, LEVANDER A, ZELT CA, J´ACOME MI & MAGNANI MB. 2008. Crustal thickness
vari-ations in Venezuela from deep seismic observvari-ations. Tectonophysics, 459: 14–26.
SILVER P. 1996. Seismic anisotropy beneath the continents: Probing the depth of geology. Annu. Rev. Earth Planet. Sci., 24: 385–432. SILVER PG & CHAN WW. 1991. Shear wave splitting and sub-contin-ental mantle deformation. J. Geophys. Res., 96: 16429–16454. SILVER P & SAVAGE M. 1994. The interpretation of shear-wave splitting parameters in the presence of two anisotropic layers. Geophys. J. Int., 119: 949–963.
TATHAM DJ, LLOYD GE, BUTLER RWH & CASEY M. 2008. Earth and Planetary Science Letters, 267: 118–128.
TEANBY NA, KENDALL J-M & VAN DER BAAN M. 2004. Automation of shear-wave splitting measurments using cluster analysis. Bull. Seismol. Soc. Am., 94: 453–463.
VANDECAR JC, RUSSO RM, JAMES DE, AMBEH WB & FRANKE M. 2003. Aseismic continuation of the Lesser Antilles slab beneath conti-nental South America. J. Geophys. Res., 108: 2043.
WEBER JC, DIXON TH, DEMETS C, AMBEH W, JANSMA P, MATTIOLI G, SALEH J, STELLA G, BILHAM P & PEREZ O. 2001. GPS estimates of relative motion between the Caribbean and South American plates, and geologic implications for Trinidad and Venezuela. Geology, 29: 75–78. Recebido em 01 abril, 2013 / Aceito em 10 setembro, 2013
Received on April 01, 2013 / Accepted on September 10, 2013
NOTES ABOUT THE AUTHORS
Tomislav Eduardo Monjak Espinoza. Degree in Physics from the Central University of Venezuela (UCV) in 2010. He is currently pursuing the Master on Geo-science applied to Oil Exploration at Universidad Sim´on Bolivar (Venezuela). Lecturer at the Faculty of Sciences and Researcher of the Center of Geophysics at the Earth Sciences Institute of the UCV since 2010. Interested in the analysis of seismic anisotropy in crust and mantle and their applications within the petroleum industry.
Laura Teresa Pi˜nero Feliciangeli. Graduated in Physics from the Universidad Central de Venezuela (UCV) in 1995 and MSc in Exploration Geophysics from the University of Leeds, UK (2000). She completed the PhD in Geophysics at the University of Leeds (2004) with a dissertation on Seismic Anisotropy in the Caribbean. Researcher-Lecturer since 1997 and Coordinator of the Center of Geophysics at the UCV (2005-2012). Adviser to the Ministry of Energy and Petroleum (2007-2008) and Senior Instructor & Consultant of the Network of Excellence in Training (NExT) Schlumberger from 2008 to present. Areas of interest: seismology, seismic anisotropy, general geophysics and applications both globally and for the petroleum industry.