GRAVITY CRUSTAL MODEL FOR AN ANDEAN SECTION AT 32° S
CONSIDERING UPPER MANTLE LATERAL DENSITY VARIATION
Up to date, three gravity models for the Andean section at 32° south latitude have been published. Two of them did not have seismic reflection/refraction data to constrain the subsurface geometry. The other one included seismic data to fit thicknesses and determined density contrasts using velocity-density curves. Furthermore, all previous models assumed a homogeneous mantle. In this paper a new gravity model is computed for a two-layer crust of the Andean section at the 32° south latitude. It involves new seismic depths for the Andean foreland, recent worldwide velocity-density relationships and a simple model of the subducting slab. The shape of the Nazca plate is defined from available contour maps of the Wadati-Benioff zone of western South America. The slab density contrast with respect to the surrounding mantle is estimated to be +1.6% (3.5-5.5% velocity anomaly), which reproduces the long-wavelength gravity anomaly. The modelled crustal structure is analyzed taking into account interpretations derived from seismic data. Crustal thicknesses vary from about 50 km in the Sierras Pampeanas to 71 km in the Andean belt. According to this model, most of the thickening takes place in the upper crustal layer, in the region between the Precordillera and Pampean Ranges. These results agree with recent seismological data. A Cenozoic lower crust shortening of 146 km to an initial crust 40 km thick is calculated from the computed crustal roots. This estimate of shortening is within 10% of previous calculations from gravity models. Also, it shows consistency with independent estimate of crustal shortening derived from geological balanced cross-section at the same latitude.The computed crustal model here presented assumes that the gravity excess from the Nazca plate is balanced by means of a deficiency of density produced by crustal thickening. So, there is no net mass variation at the base of the lithosphere (»180 km). Therefore, considering upper mantle density variation does not affect previous inferences about the present isostatic state close to the balance in the Airy system.
Key words: Gravity field; Andean belt; Heterogeneous upper mantle.
MODELO GRAVIMETRICO CORTICAL PARA UNA SECCION ANDINA EN 32° S CONSIDERANDO VARIACION LATERAL DE DENSIDAD EN EL MANTO SUPERIOR-Hasta el presente, tres modelos gravimétricos para los Andes en 32°S han sido publicados. De ellos, sólo el último incorporó valores sísmicos para ajustar los espesores y determinar contrastes de velocidad usando curvas velocidad-densidad. Además, en todos los casos se consideró manto superior homogéneo. En este trabajo se presenta un nuevo modelo gravimétrico para la corteza, en una sección andina centrada en 32°S de latitud. Este involucra nuevas profundidas sísmicas para el antepaís andino, recientes relaciones velocidad-densidad, y un modelo simple para la placa subductada. La geometría de la placa de Nazca se define a partir de los mapas de contornos de la zona de Wadati-Benioff para el oeste de Sudamérica. El contraste de densidad de la lámina con respecto al manto superior se estima que es +1.6% (o, una anomalía de velocidad de +3.5-5.5 %). Usando este contraste se reproducen adecuadamente las anomalías de gravedad de longitud de onda larga. El modelo resultante de estructura cortical es analizado tomando en cuenta las interpretaciones derivadas de datos sísmicos. Las profundidades hasta el fondo de corteza varían desde alrededor de 50 km en las Sierras Pampeanas hasta 71 km en el eje andino. De acuerdo a este modelo, para la región entre las Sierras Pampeanas y la Precordillera, la mayor parte del engrosamiento cortical se produciría en la primera capa de la corteza. Los resultados encontrados son consistentes con recientes interpretaciones sismológicas. Considerando el área de las raíces calculadas, el acortamiento Cenozoico en corteza inferior es de 146 km, para una corteza inicial de 40 km. Esta estimación
S. Miranda
1INTRODUCTION
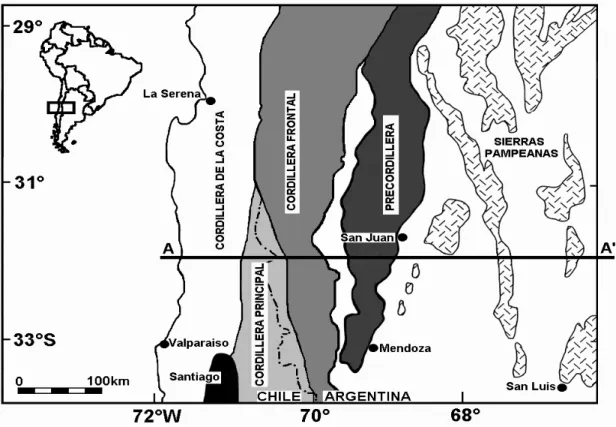
About 30 years ago, earlier crustal model at lati-tude 32° south was published in order to fulfill the recommendations arising from the Conference about Problems of the Solid Earth (Buenos Aires, Argen-tina, 1970). Thus, two Argentine Schools, Universidad Nacional de Rosario and Universidad Nacional de San Juan carried out gravity measurements on the Andean region of San Juan (Fig. 1). These values together with gravity data collected by the Universidad de Chile (Dragicevic, 1970) and the Instituto Geografico Militar de Argentina, were used to prepare the profile known as “South American Transcontinental Gravity Profile-32° S Parallel” (Introcaso & Huerta, 1972). By using these data for continental Argentina and Chile, these authors prepared a one-layer crustal model which had no seismic constraints. This profile, extended to the west in order to include the oceanic region, was reinter-preted (Introcaso & Pacino, 1988a) by modelling a three-layer crust and assuming global density values identical to Woollard´s (1969). The next model which involved both thicknesses from seismic data and P-wave velocities, resulted in a seismic-gravity model in which a two-layer crust was computed (Miranda & Introcaso, 1993). In all models, the reference (or normal) crust was 32-33 km thick and the densities were related to P-wave velocities according to the empirical curve from Nafe-Drake (1965). In addition, the An-dean uplifting mechanisms during Cenozoic times were analyzed considering only the crustal structure. How-ever, geological evolution of the study segment is strongly related to the sub-horizontal subduction regime (Isacks, 1988). Therefore, an improved analysis should involve both crust and upper mantle.
In the present study it is presented a new model
for the crustal structure at 32° S latitude. This model takes into account: 1) a velocity model derived from seismic data (Cominguez, 1989, Pardo & Fuenzalida, 1988), and the new crustal velocity-density relation-ships of Christensen & Mooney (1995) that converts velocity to density values, 2) a reference crust of 40 km thickness (Mooney et al., 1998), 3) in terms of upper mantle lateral density variation by adopting a Nazca plate model based on seismological information to define its geometry, and temperature regime calcu-lated to descending slabs in the world to determine the starting contrasts of densities.
Crust-mantle interface depths and crustal struc-ture computed from the modelling of gravity anomalies show consistency with seismic results for this region (Regnier et al., 1994). The estimate of 30% Cenozoic crustal shortening agrees with previous values calcu-lated from gravity models.
DENSITY STRUCTURE
In order to estimate a simple one dimensional density model beneath the 32° S latitude, it is included seismic data of P-wave velocities and thicknesses for Chile and Argentina. Thicknesses have also been used to constrain the gravity modelling.
Reflection seismic data up to about 40 km depth were reprocessed by Cominguez (1989). These data fall on an east-west line about 60 km long, located at the latitude of 32.3° S between 68.08° and 68.7° W meridian, in Argentina. The segment analyzed is situ-ated between the Sierras Pampeanas, eastward, and the Precordillera, westward. The transition of P-wave velocities from 6.7 km/s to 7.1 km/s was recognized to be at about 30 km depth.
Crustal and thickness velocity structures have para el acortamiento está dentro del 10 % de otros valores calculados a partir de datos de gravedad.
También, es consistente con estimaciones independientes calculadas partir de perfiles geológicos balanceados en la misma latitud. El modelo cortical calculado en este trabajo supone que el exceso de gravedad debido a la placa subductada es compensado mediante un defecto de densidad producido por engrosamiento cortical. Así, no hay variaciones netas de masa a nivel de la base de la litosfera (»180 km). Por lo tanto, considerar manto superior con densidad variable no altera inferencias previas acerca del estado isostático actual, las cuales indican un comportamiento cercano al balance de masas en el sistema de Airy.
Palabras-clave: Campo de gravedad; Cadena Andina; Manto superior heterogéneo
1Instituto Geofísico Sismológico Ing. Fernando Volponi
Facultad de Ciencias Exactas, Físicas y Naturales Universidad Nacional de San Juan Meglioli 1160 Sur, 5400 San Juan, Argentina
been successfully investigated for central Chile be-tween the 32° and 34.5° south latitudes and bebe-tween the 72° and 70° west longitudes (Pardo & Fuenzalida, 1988). They modelled a 4-layer crust, using the method of minimum apparent velocity from refraction seismic data (see Tab. 1, in Pardo & Fuenzalida, 1988). The reported data involve uncertainties ± 0.05 km/s in com-pressional wave velocities and ± 10 % in thicknesses. According to this velocity model, the first three layers probably merge into an unique layer, which involves typical upper-middle crustal seismic velocities (Christensen & Mooney, 1995), ranging from 5.5 km/s to 6.6 km/s. The remaining layer is identified to be the lower crust, where velocity varies from 7.0 km/s to as much as 7.1km/s. The upper mantle velocity is 8.0-8.1 km/s.
In order to estimate a density model beneath the Andean orogenic system at about 32°S latitude, the non-linear velocity-density regression line parameters from Christensen & Monney (1995) were used. They sum-marized the velocity structure of the continental crust based on a worldwide data set of seismic refraction profiles, and inferred crustal composition as a function of depth by comparing these results with high-pres-sure laboratory meahigh-pres-surements of seismic velocities for a wide range of rocks that are commonly found in the crust.
The mean velocity of the upper crustal layer is estimated to be 6.03 km/s as a weighted average thick-ness and velocity. From 10-20 km depth parameters of Cristensen-Mooney relationships (see Tab. 8), a density of 2.72 g/cm3 was derived.
The lower crust has an average velocity of 7.02 km/s, and a density of 3.06 g/cm3. The upper mantle has a density of 3.41 g/cm3. These density values were calculated according to 20-40 km depth and 50 km depth parameters of Christensen-Mooney, respec-tively (see Tab. 8 in Christensen & Mooney, 1995).
Assuming density contrasts to be constant within every layer, and in order to model the crustal structure at 32° S, the following values are considered: -0.35 g/cm3 and -0.34 g/cm3 for the crust-upper mantle and upper-lower crustal layer density contrasts, re-spectively.
NAZCA PLATE MODEL
The framework of the global tectonic implies sub-duction and lithosphere subsidence in convergent plate edges. This process affects the local temperature re-gime, as can be seen in the observed changes of geo-physical variables such as thermal flows, seismic wave velocities and earth gravity field, among others. Grav-ity effects of the subduction system have been com-Figure 1 - Map of the area of study showing the major topographic features. Line A-A’ indicates the cross section under study.
puted on different segments of the Andes, i.e. from 20° S to 26°S by Strunk (1990), at 21° S by Götze et al. (1995), at 24° 25’ S by Introcaso & Pacino (1988b). Also, Allmendinger et al. (1990), by analysing an An-dean section at 30° S, pointed out that because of flat subduction, crustal thicknesses could be remarkably greater than those predicted from isostatic anomalies. Detailed maps of the geometry of the Wadati-Benioff zone (WBZ) in the west of South America have been drawn from earthquake location and focal mechanism solutions (Cahill & Isacks, 1992). These maps show the path of the oceanic plate at 32o S, which exhibits “normal”dip (≈30o) to about 100 km
depth, where the slab proceeds subhorizontally (≈5°)
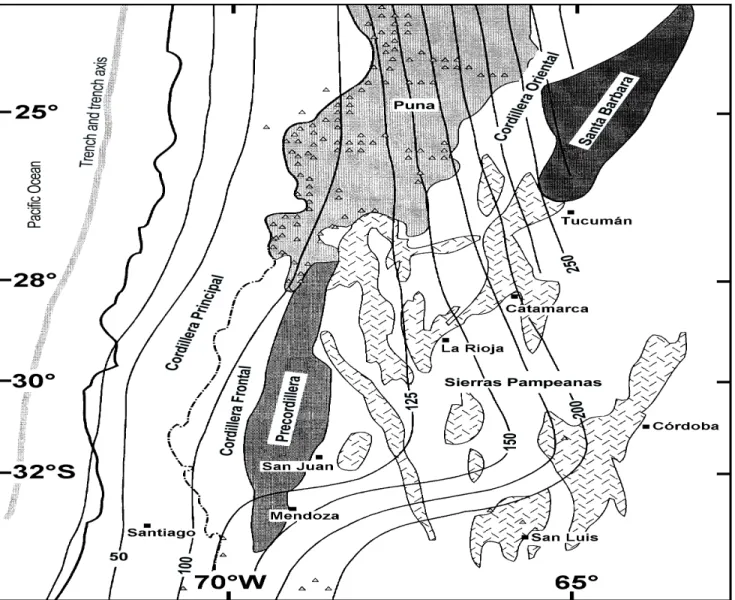
for some 300 km before dipping steeply into the upper mantle (“resubducting”) beneath the western border of the Sierras de Cordoba (Fig. 2).
As a result to the low angle dipping, there is no asthenospheric wedge between continental and oce-anic plates. Therefore, the thermal component contri-bution to produce topography is not significant (Isacks, 1988). Besides, a flat WBZ could produce uniform ef-fects over the long-wavelength gravity anomaly com-ponents (Fann et al., 1996).
Sacks (1983) examined the flat subduction (or buoyancy model) beneath central Peru. He observed Figure 2 - Map of western Argentina and Chile illustrating upper plate tectonic features, volcanic arc, and contours of the Wadati-Benioff zone (modified from Smalley & Isacks, 1987). The distribution of Neogene volcanos (triangles) (Isacks, 1988) shows an active magmatic arc over the steep WBZ segment and the absence of an active arc over the flat segment.
that the low regional heat flow (about 30 mW/m²) combined with the young age of subducted oceanic plate (≈50 Ma) and its high rate of subduction (about
10 cm/yr) acts to retard the basalt-eclogite transfor-mation in the subducting oceanic crust. Sacks showed that when the basalt-eclogite transformation is de-layed, the plate can remain buoyant for long periods of time. Thus for modelling purposes, in this paper the flat subduction is assumed to be the result of slab buoyancy.
The flat slab beneath San Juan region is esti-mated to have an age of about 50 Ma and a total thickness of about 80 km (Smalley & Isacks, 1987). Furthermore, these authors reported a seismogenic zone of about 20.5±1.5 km within the plate, which is probably related to a cold thermal core in the subducted plate.
Heat flow measurements in San Juan and Mendoza region (Uyeda et al., 1978b) give the tenta-tive heat flow value of about 20-25 mW/m² at the latitudes of 31° 33' S and 32° 48' S. In Chile, Uyeda et al. (1978a) infer a similar low value at 28°-29° S lati-tude. Recently, Muñoz & Hamza (1996) prepared a map of heat flow density for South America. Although the spatial distribution of data is non-uniform, they re-port low heat flow belts in coincidence with the flattening of the WBZ both in northern Peru and cen-tral Chile extending into Sierras Pampeanas in Argen-tina. These low heat flows could be associated with an absent asthenospheric wedge.
There is no velocity mantle model beneath San Juan. Therefore, it has been adopted a rough but ten-tative density model for the subducted plate.
The thermal structure of the plate can be con-sidered to be similar to the one before subduction occurred, because of the low temperature of the
continental plate on flat slab region, as Norabuena et al. (1994) pointed out. Based on that assumption, temperatures in the slab should be 350° C at a depth of 15-20 km inside the slab and approximately 600°C at a depth of 30-35 km. Thus, a cooling of the oce-anic plate of 300°C to 500°C could be assumed (Helffrich et al., 1989). Moreover, temperature is re-lated to density through the thermal coefficient of volume expansion (α), which for upper mantle
mate-rial is α≈ 2.5 x 10⁻⁵ °C-1 (Duffy & Anderson, 1989).
This yields slab density contrasts of +0.025 to +0.04 g/cm3, with a 3.38 g/cm3 normal density for the lithospheric mantle.
Furthermore, both the phase change and the dif-ference in pressure and the difdif-ference in bulk compo-sition as well contribute to the net contrast (Helffrich et al., 1989). Thus, the computed values represent a lower bound on the density contrast of the slab.
In the modelling, two dipping planes were placed 80 km apart to define the upper and lower surface of the slab. The density contrasts were set from +0.025 to +0.04 g/cm3 as starting density values and varied according to three different slab segments (see Figs. 2 and 3).
CRUSTAL MODEL
The gravity data were sampled at 10 km intervals along the Andean belt, the Precordillera and the West-ern Pampean Ranges. Gravity values were reduced with a density of 2.67 g/cm3. Bouguer anomalies reach the amplitude of –310 mGal on the highest mean alti-tudes of 4200 m over the Andes at this latitude.
The crustal model derived from gravity and seis-mic data was prepared following the method proposed by Pacino & Introcaso (1987). Thus, the upward
con-Table 1 - Principal features for different gravity crustal models at 32°S are shown. Tn is normal crustal thickness; ∆σ
1 and ∆σ2 are density
contrasts at the top of the lower crust, and at crust-mantle level; ∆R
máx. is the maximum crust-mantle interface depth computed from gravity
modelling.
Tabla 1 - Se detallan las características principales de los diferentes modelos corticales en 32° S derivados de datos de gravedad. Tn es el espesor de la corteza normal; ∆σ
1 y ∆σ2 son los contrastes de densidad en el techo de la corteza inferior y a nivel del límite corteza-manto
superior; ∆R
Figure 3 - Andean crustal gravity modelling at 32° S. Top: Observed and calculated gravity Bouguer anomalies at 20 km height. The observed Bouguer anomalies were continued 20 km upward where short wavelengths disappeared. Then they were inverted to obtain the cruts-mantle interface undulations. Middle: Observed and calculated gravity Bouguer anomalies at topographic level. Calculated anomalies represent the gravity effect from the model which was previously defined at 20 km height. They are in a good agreement with the observed Bouguer anomalies showing the model at the bottom is a suitable estimate of the regional structure. Bottom: Two layer crustal model and the subducted plate model which reproduce the regional anomalies. Density contrasts are indicated in g/cm3. Also, seismic depths from Pardo
& Fuenzalida (1988) and Cominguez (1989) are shown. These thicknesses fit the bottom of the modelled first layer. Besides, Regnier et al. (1994)’s seismic depths are shown. They constrain the computed crust-mantle interface depth.
Figura 3 - Modelo gravimétrico cortical para los Andes en 32° S. Arriba: Anomalías de gravedad de Bouguer observada y calculada a 20 km de altura. Las anomalías de Bouguer observadas fueron continuadas analíticamente hacia arriba, hasta que desaparecieron las cortas longitudes de onda. Luego, ellas fueron invertidas para obtener las ondulaciones del límite corteza-manto superior. Centro: Anomalías de gravedad de Bouguer observada y calculada sobre la superficie topográfica. Las anomalías calculadas representan el efecto de gravedad calculada desde el modelo que fuera definido previamente a partir del campo para H= 20 km. El ajuste entre las anomalías observada y calculada indica que el modelo en Abajo, es representa adecuadamente la estructura regional. Abajo: Modelo de corteza de dos capas y modelo de placa de Nazca, que reproducen el campo de gravedad regional. Las densidades se indican en g/cm3. También se
tinued gravity anomalies at H high were modelled by using a simple system of equivalent source. Then, the gravity effect of the derived model was computed again, but at the topographic surface. The last model would define both the true regional anomaly and the crust-mantle interface depths.
The gravity field at H= 20 km up (Fig. 2a) was computed. Before that, measured data on the topo-graphic surface were reduced to a horizontal plane by means of the iterative procedure of Guspi (1987).
By computing the crust-mantle interface undula-tions, the gravity effect of a two-layer crust was evalu-ated. Density values were adopted from the density model previously estimated. Moreover, the constructed dipping slab model was incorporated. The key as-sumption was that positive gravity effects from the descending plate are compensated only by the increase in crustal thickness.
Furthermore, a reference crustal thickness of 40 km was assumed at Moho level (Christensen & Mooney, 1995, Mooney et al., 1998) and of 18 km at the top of the lower crust (Regnier et al., 1994). It is also assumed that crustal thickness varies smoothly between points where depth is well determined.
The subducting slab densities were changed to +0.05 and 0.06 g/cm3 (or about +1.6%), because they produced models that better resemble the long-wave-length component of the anomaly curve. These val-ues are closer to those which have been used in simi-lar models in other parts of the world (Grow & Bowin, 1975, Tsokas & Hansen, 1997).
The first layer matchs seismic depths interpreted by Pardo & Fuenzalida (1988) and Cominguez (1989). The Moho topography in fig. 3b was derived by fitting into 10 % the observed and calculated gravity anoma-lies.
The maximum gravity crust-mantle boundary depth is estimated to be 71 km deep beneath Los des. A 7° westward dip of the Moho under the An-dean foreland is modelled. Fig. 3b displays the Regnier et al. (1994) seismic Moho depths. He used a portable seismic network to study the region between Precordillera and Sierras Pampeanas. These seismic depths agree with the modelled Moho within 5 %.
DISCUSSION
Tab. 1 sums up the most important features to the all crustal models that have been prepared of the An-dean section at about 32° S.
The foregone models produce crustal roots within 10% of the newest model. Many assumed parameters
contribute to this difference (see Tab. 1). A reference crust of 40 km instead of a 30 km thick could only justify, at the most, 3 % of the observed disagreement. Thus, the assumed Tn thickness is not so critical in the calculations. This lack of sensitivity, inherent to grav-ity field modelling, has been already pointed out for the Brazilian Shield (Lyon-Caen et al., 1985) and for the Andean belt at 32° S (Miranda & Introcaso, 1994). About the adopted density model, Christensen and Mooney’s relationship estimates a high density for the lower crust. In contrast, the computed density for the upper crust layer is lower than the one predicted by the Nafe-Drake curve. So, the inferred contrast deficit is relatively high at the top of the lower crust. Modelling both the high density contrast and the con-straining seismic depths considered for the first layer convey to the thickening of it at the expense of a thin-ner lower crust. In fact, Smalley & Isacks (1990) have located at a depth of 15 km and 35km the Neogene seismic activity for the Precordillera and Sierras Pampeanas region. They have also placed the brittle-ductile transition at 30-35 km depth. Thus the crustal structure in Fig. 3 shows that the crustal thickening would occur mainly by an increase of the brittle crust beneath both Pampean foreland and Precordillera. This result is consistent with those of Regnier et al. (1994). The adopted Nazca plate structure, with a den-sity contrast of about +1.6%, produced a model that fairly fits the long-wavelength gravity anomaly. For this density anomaly, velocity-density relationships predict about 3.5-5.5% velocity anomaly with the surrounding mantle, which is within the range reported in another slab boundaries (Helffrich & Stein, 1993). In fact, large seismic velocity contrasts (+4-12%) between slab and surrounding mantle have been shown in numer-ous studies of reflections and conversions at slab boundaries (see Helffrich & Stein, 1993).
According to the proposed model in Fig. 3, the regional 1D shortening Sh was estimated, for the last 10 Ma. during which compressive forces caused crustal deformation (Mpodozis & Ramos, 1989). By using the area balancing, the estimated Sh from longitudes 71° to 67.5° west (about 330 km long at latitude 32° S), is 146 km or 30%, to 40 km original thickness and 476 km wide to match the same area of deformation. Geological balanced cross sections across the Cordillera, the Precordillera and the Sierras Pampeanas indicate a crustal shortening of about 145 km at 32° S (Ramos et al., 1996).
corre-sponding ratio to a compensated Airy model is AR/AT= 7.63 according to the computed model. It means that every 1 km topographic height, the balanced model would require a deficiency of root of 1.49 km. By calculating the total pressure to a normal and an anoma-lous lithospheric column at 180 km average depth, the same pressure of about 57 Kbar is computed. Thus, the observed deficiency of mass at Moho level would be compensated by means of the additional positive mass from the Nazca plate.
In summary, considering a heterogeneous mantle density model does not disturb isostatic evaluations for a homogeneous mantle. For the Andean system at 32° S, numerous studies have proved a present state close to the balance using simple Airy isostasy (i.e. Introcaso et al., 1992).
CONCLUSIONS
A two-layer model for the Andean crust at 32°S was prepared. It is in agreement with both recent geo-physical information and global tectonic theory. A sim-ple density model, which assumes the crust to be later-ally homogeneous, was computed. These density val-ues were derived from seismic velocity models and then transformed into densities by means of global velocity-densities relationships. Contrasts of velocity-densities of –0.34 g/cm3 and -0.35 g/cm3 were assumed at the top of the lower crust and upper mantle, respectively. Fur-thermore, seismic depths were fit to match the bottom of the first layer. Heterogeneous mantle was assumed. Doing so, a Nazca plate model had to be adopted. Af-ter gravity modelling the resulting contrast in density was +0.05-0.06 g/cm3 within the Nazca plate. It means a 3.5-5.5% velocity anomaly into the slab. This excess of mass from the Nazca plate should be sup-ported by a deficit of mass at the Moho level.
Principal conclusions from this study are as fol-low: (1) Maximum crust-mantle interfaces depths are 71 km, 58 km and 50 km beneath the Andes belt, the Precordillera and Sierras Pampeanas, respectively. These thicknesses closely match seismic depths in these areas. (2) Thickening inferred from modelled crustal thickness suggests that most of the thickening occurs in the brittle crust under the Pampean ranges and Precordillera. (3) The total shortening across this sec-tion is estimated to be about 30% for a crust 40 km thick. (4) A model in which crustal thickness variation is due to horizontal compression only would explain the Andean Cenozoic uplift both for a homogeneous or a heterogeneous upper mantle.
Future tomographic results may provide a more
detailed model of the lithospheric structure.
ACKNOWLEDGMENTS
I specially thank Antonio Introcaso for many helpful dis-cussions during the preparation of this paper. I also thank the reviewers for their comments to improve the text. This work was supported by the Universidad Nacional San Juan, San Juan, Argen-tina.
REFERENCES
ALLMENDINGER, R. W., FIGUEROA D., SNYDER, D., BEER, J., PMODOZIS, C. &
ISACKS, B. L. – 1990- Foreland shortening and
crustal balancing in the Andes at 30° S latitude. Tectonics, 9(4): 789-809.
CAHILL, T. & ISACKS, B.- 1992- Seismicity and
shape of the subducted Nazca plate. Geophys. Res., 97, (B12): 17503-17529.
CHRISTENSEN, N. I. & MOONEY, W. D.- 1995-Seismic velocity structure and composition of con-tinental crust: a global view. Jour. Geophys. Res.,
100 (B7): 9761-9788.
COMINGUEZ, A. –1989- Análisis sísmico profundo
en la zona de Ramblón, Mendoza, Argentina. Proceedings Geotransectas de América del Sur, Mar del Plata, 54-57pp.
DRAGICEVIC, M., -1970- Carta gravimétrica de
los Andes meridionales e interpretación de las anomalías de gravedad de Chile Central. Publicación Universidad de Chile, 93, 42 pp.
DUFFY , T. S. & ANDERSON, D. L.- 1989-
Seis-mic velocities in mantle minerals and the mineral-ogy of upper mantle. Jour. Geophys. Res., 94: 1895-1912.
FANN, G., WALLACE, T. C., BECK, S. L. &
CHASE, C.-1996- Gravity anomaly and flexural
model: constraints on the structure beneath the Peruvian Andes. Tectonophysics, 255: 99-109. GÖTZE, H. J, SCHMIDT, M., GIESE, P.,
SCHMIDT, S. , WIGGER, P., SCHWARZ, G., ARANEDA, M., CHONG, G. &
VIRAMONTE, J. -1995- Las estructuras
litosféricas de los Andes Centrales australes basadas en interpretaciones geofísicas: una revisión. Revista Geológica de Chile, 22, (2): 179-192.
GROW, J.A. & BOWIN, C. O. -1975- Evidence
for high-density crust and mantle beneath the Chile trench due to the descending lithosphere. Jour. Geophys. Res., 80(11): 1449-1458.
potential field measurements to a horizontal plane. Geoexploration, 24: 87-98.
HELFFRICH, G. R. & STEIN, S. - 1993- Study
of the structure of the slab-mantle interface using reflected and converted seismic waves. Geophys. J. Int.: 14-40.
HELFFRICH, G. R., STEIN, S. & WOOD, B. J.
-1989- Subduction zone thermal structure and
mineralogy and their relationship to seismic wave reflections and conversions at the slab/mantle in-terface. Jour. Geophys. Res., 94(B1): 753-763.
INTROCASO, A. & HUERTA, E. -1972- Perfil
gravimétrico transcontinental Sudamericano – Paralelo 32° S-. Publicación Universidad Nacional de Rosario, Argentina, 36 pp.
INTROCASO, A. & PACINO, M. C. –1988a-Modelo gravimétrico de corteza y manto superior bajo el segmento argentino-chileno en la Latitud 32° Sur. V Congreso Geológico Chileno, II: F63-F76.
INTROCASO, A. & PACINO M. C. -1988b-
Grav-ity Andean model associated with subduction near 24°25' south latitude. Revista Geofísica, 44: 29-44.
INTROCASO, A., PACINO M. C. & FRAGA,
H. -1992- Gravity, isostasy and Andean crustal
shortening between latitudes 30 and 35 S. Tectonophysics, 205: 31-48.
ISACKS, B. -1988- Uplift of the Central Andes
plateau and bending of the Bolivian orocline. Jour. Geophys. Res., 93: 3211-3231.
LYON-CAEN, H., MOLNAR, P. & SUÁREZ, G.
-1985- Gravity anomalies and flexure of the
Bra-zilian Shield beneath the Bolivian Andes. Earth and Plan. Science Let., 75: 81-92.
MIRANDA, S. & INTROCASO, A. -1993- Estudio
del Levantamiento Andino a partir de una nueva sección gravimétrica en 32° de Latitud Sur. 3° Congresso Internacional da Sociedade Brasileira de Geofísica, Resumos Expandidos, Actas II: 1156-1161.
MIRANDA, S. & INTROCASO, A. -1994- Crustal
models and isostatic evaluation on a new Andean section at 32°S Latitude. Revista Geofísica del IPGH (Instituto Panamericano de Geografía e Historia, México, 41: 113-123.
MOONEY, W. D., LASKE, G. & GUY
MAS-TERS, T. -1998- Crust 5.1: a global crustal model
at 5°x5°. Jour. Geophys. Res., 103: 727-747.
MPODOZIS, C. A. & RAMOS, V. -1989- The
Andes of Chile and Argentina. In Geology of the
Andes and its relation to hydrocarbon and mineral resources: Circum-Pacific Council for Energy and Mineral Resources Earth Sciences Series, Ericksen, G. E-, M. T. Cañas, J. A. Reinemund, eds., Chapter 5: 59-90.
MUÑOZ, M. & HAMZA, V. -1996- Maps of
ter-restrial heat flow density distribution in South America. Proceedings Third ISAG, St. Maló (France); 87-90pp.
NAFE, J. E., & DRAKE, C. –1965- In:
Interpreta-tion theory in applied geophysics, Grant & West, (Eds.), 1965, Fig. 7-7, p. 200.
NORABUENA, E. O. , SNOKE, J. A. & JAMES,
D. E. -1994- Structure of the subducting plate
beneath Peru. J. Geophys. Res., 99: 9215-9226.
PACINO, M.C. & INTROCASO, A. -1987-
Re-gional anomaly determination using upwards con-tinuation method. Bolletino di Geofisica Teorica ed Applicata, 29: 113-122.
PACINO, M.C. & INTROCASO, A. -1988-Modelo gravimétrico sobre el sistema de subducción Placa de Nazca-Placa Sudamericana en la latitud de 33° Sur. V Congreso Geológico Chileno. II: F77-F89.
PARDO, M. & FUENZALIDA, A. -1988-Estructura cortical y subducción en Chile Central. Proceeding V Congreso Geológico Chileno, II: F247-F265.
RAMOS, V. A, CEGARRA, M. &
CRISTALLINI, E. -1996- Cenozoic tectonics
of the High Andes of west-central Argentina (30°-36° S latitude). Tectonophysics, 259: 185-200. REGNIER M., CHIU, J. , SMALLEY, R. ,
ISACKS, B. & ARAUJO, M. -1994- Crustal
thickness variation in the Andean foreland, Argen-tina, from converted waves. Bull. of the Seismol. Soc. of America, 84(4): 1097-1111.
SACKS, I. S. –1983- The subduction of young
lithosphere. Jour. Geophys. Res., 88: 3355-3366.
SMALLEY, R. & ISACKS, B. -1987- A high
reso-lution local network of the Nazca Plate Wadati-Benioff zone under western Argentina. Jour. Geophys. Res., 92(B13): 13903 -13912. SMALLEY, R. & ISACKS, B.
-1990-Seismotectonics of thin and thick-skinned defor-mation in the Andean foreland from local network data: evidence for a seismogenic lower crust. Jour. Geophys. Res., 95: 12487 -12498.
STRUNK, S. –1990- Analyse und interpretation des
Silvia Miranda
Was born in Argentina on the 16th of August, 1962. Graduated in
geophysics in 1989 from San Juan University, and obtained a Doctor’s degree in 1998 from the University of Rosario, Argen-tina. She started a research career with a scholarship from
CONICET (Argentine Council for Scientific Research). Presently, she is a professor at the University of San Juan. Her interests are potential methods, geodynamics, lithospheric behaviour and re-cent crustal movements.
Free Univ., Berlin, Germany.
TSOKAS, G. N. & HANSEN, R. O.-1997- Study
of the crustal thickness and the subducting lithosphere in Greece from gravity data. Jour. Geophys. Res., 102(B9): 20585-20597.
UYEDA, S., WATANABE, T., KAUSEL, E.,
KUBO, M. & YASHIRO, Y. –1978a- Report
of heat flow measurements in Chile. Bulletin of the Earthquake Research Institute, 53: 131-163.
UYEDA, S., WATANABE, T. & VOLPONI, F. –
1978b- Report of heat flow measurements in San
Juan and Mendoza, Argentine. Bulletin of the Earth-quake Research Institute, 53: 165-172.
WOOLLARD, G.P. –1969- Regional variations in
gra-vity. In: The Earth’s Crust and Upper Mantle. Pembroke J. Hart (Ed.). Geophys. Monogr., A.G.U., 13: 320-341.
NOTE ABOUT THE AUTHOR
DEPARTAMENTO DE GEOFÍSICA
INSTITUTO DE ASTRONOMIA, GEOFÍSICA E CIÊNCIAS ATMOSFÉRICAS UNIVERSIDADE DE SÃO PAULO
CURSO DE BACHARELADO EM GEOFÍSICA
O curso de Bacharelado em Geofísica foi implantado em 1984 na Universidade de São Paulo, sendo então o único curso de graduação em Geofísica no Brasil.
O curso pretende proporcionar aos alunos uma formação básica nesta ciência, com ênfase na sua integração com a Física, Matemática, Geologia, Computação e Química, visando a solução de problemas de pesquisa mineral, engenharia e geotecnia, meio ambiente e desenvolvimento científico-tecnológico. Os profissionais emergentes do curso podem atuar em empresas e instituições de Geofísica Aplicada, Geofísica Ambiental e Geofísica Básica.
A duração atual do curso é de 10 semestres, sendo 4 básicos, onde os estudantes vão obter o embasamento necessário para compreensão dos temas a serem tratados nos 6 semestres seguintes, compostos de disciplinas de formação geral e de formação profissional.
As disciplinas de formação profissional têm por objetivo qualificar o geofísico a coletar, processar e interpretar as informações obtidas por meio dos diversos métodos geofísicos, elaborando modelos que se apliquem à pesquisa básica de propriedades do interior da Terra, à pesquisa de recursos minerais para fins de
exploração ou a estudos de problemas ambientais, como busca e caracterização de poluição de aqüíferos.
No último ano do curso o aluno realiza um Trabalho de Graduação sob a orientação de um docente, podendo ser realizado em parte como estágio em uma empresa, que visa colocar o aluno em contato com as várias etapas de desenvolvimento de um projeto de trabalho, desde seu planejamento até a etapa final de
análise de resultados e confecção de relatórios.
A primeira turma de bacharéis em Geofísica foi formada em 1987. Até o momento, o Departamento de Geofísica do IAG-USP já formou mais de 40 bacharéis, grande parte já absorvida pelo mercado de trabalho, além de Mestres e Doutores em seu curso de Pós Graduação.
INFORMAÇÕES:
Departamento de Geofísica-IAG/USP Rua do Matão, 1226 Cidade Universitária 05508-900 São Paulo-SP (11) 3818 4760 - Fax (11) 3818 5034
e-mail: [email protected]