www.clim-past.net/11/931/2015/ doi:10.5194/cp-11-931-2015
© Author(s) 2015. CC Attribution 3.0 License.
A tropical speleothem record of glacial inception, the South
American Summer Monsoon from 125 to 115 ka
S. J. Burns1, L. C. Kanner1,*, H. Cheng2,3, and R. Lawrence Edwards3
1Department of Geosciences, University of Massachusetts, Amherst, Massachusetts 01002, USA
2Institute of Global Environmental Change, Xi’an Jiaotong University, Xi’an 710049, China
3Department of Geology and Geophysics, University of Minnesota, Minneapolis, MN 55455, USA
*present address: 2nd Nature LLC, 500 Seabright Ave, Santa Cruz, CA 95062, USA
Correspondence to:S. J. Burns (sburns@geo.umass.edu)
Received: 19 September 2014 – Published in Clim. Past Discuss.: 21 November 2014 Revised: 13 May 2015 – Accepted: 26 May 2015 – Published: 23 June 2015
Abstract.Relatively few marine or terrestrial paleoclimate
studies have focused on glacial inception, the transition from an interglacial to a glacial climate state. As a result, nei-ther the timing and structure of glacial inception nor the spatial pattern of glacial inception in different parts of the world is well known. Here we present results of a study of a speleothem from the Peruvian Andes that records changes in the intensity of South American Summer Monsoon (SASM) rainfall over the period from 125 to 115 ka. The results show that late in the last interglacial period, at 123 ka, SASM rain-fall decreased, perhaps in response to a decrease in temper-ature and ice cover in the high northern latitudes and asso-ciated changes in atmospheric circulation. Then at 120.8 ka, a rapid increase in SASM rainfall marks the end of the last interglacial. After a more gradual increase between 120 and 117 ka, a second abrupt increase occurs at 117 ka. This pat-tern of change is mirrored to a remarkable degree by changes in the East Asian Monsoon. It is interpreted to reflect both a long-term gradual response of the monsoons to orbitally driven insolation changes and to rapid changes in Northern Hemisphere ice volume and temperature. Both monsoon sys-tems are close to their full glacial conditions by 117 ka,
be-fore any significant decrease in atmospheric CO2.
1 Introduction
Studies of Earth’s transitions from glacial to interglacial states over the past several hundred thousand years have fo-cused on glacial terminations. In particular, the last glacial
pe-Figure 1.Age versus depth for stalagmite P10-H1. Error bars are
2σ.
riod covering the transition from the penultimate interglacial to the beginning of the last glacial period.
2 Material and methods
Sample P10-H1 is from Huagapo Cave (11.27◦S, 75.79◦W)
∼3850 m above sea level (m a.s.l.) in the central Peruvian
Andes. The sample is a calcite stalagmite 31.8 cm tall from an upper gallery of the cave approximately 700 m from the main entrance. The sample was cut into halves along the growth axis and polished. For radiometric dating, 10 subsam-ples were taken about every 30 mm parallel to growth layers. For stable oxygen and carbon isotope analysis, 318 subsam-ples were taken every millimeter along the growth axis.
The radiometric dates were measured using a multi-collector, inductively coupled plasma mass spectrometer (MC-ICPMS) on a Thermo-Finnigan Neptune at the Min-nesota Isotope Laboratory with procedures similar to those described in Cheng et al. (2009b). The stable isotopic analy-ses were performed at the University of Massachusetts using an on-line carbonate preparation system linked to a Finnigan Delta Plus XL ratio mass spectrometer. Results are reported as the per mil difference between sample and the Vienna
Pee Dee Belemnite (VPDB) standard in δ notation where
δ18O=(Rsample/Rstandard−1)×1000, andR is the ratio of
the minor isotope to the major isotope. Reproducibility of the standard materials is better than 0.1 ‰. Values are reported relative to the VPDB standard.
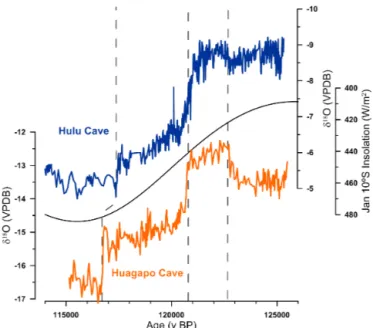
Figure 2.δ18O values for P10-H1 from Huagapo Cave in Peru
plot-ted together withδ18O values for stalagmites from Hulu Cave in
China (Kelly et al., 2006) and the insolation curve for 10◦S in
Jan-uary (Berger, 1978).
3 Results
Results of U/Th isotopic analyses (Table 1) show that
sta-lagmite P10-H1 grew from about 125.5 to 115.2 ka. All age determinations are in stratigraphic order and have errors on the order of 0.3 %. An age model for the oxygen stable iso-tope times series was constructed using linear interpolation between each age determination and is shown in Fig. 1.
The oxygen isotope time series is shown in Fig. 2, plotted together with data over the same interval from Hulu Cave in
central China (Kelly et al., 2006). Theδ18O values for
P10-H1 range from−12.3 to−17.1 ‰. From 125 to 123 ka the
values are centered on−13.5 ‰ and then increase to between
−12.5 and−13 from 123 to 121 ka. At 120.8 ka, values
de-crease by more than 1 ‰ in about 120 years. They continue to
decrease more slowly over the next 4 ky to around−15.5 ‰,
show a short-lived increase (about 75 years in duration) of around 0.75 ‰, and then, at 116.8 ka decrease again rapidly
to values between−16 and−17 ‰ for the remainder of the
record. The second rapid decrease occurs over about 150 years. We note that a cross plot of oxygen versus carbon stable isotope ratios for P10-H1 has a correlation coefficient (r2) of 0.06.
4 Discussion
4.1 Interpretation of oxygen isotope variability
Table 1.230Th dating results of P10-H1.
Sample 238U 232Th 230Th/232Th δ234Ua 230Th/238U 230Th age (years) 230Th age (years) δ234UInitialb 230Th age (yr BP)c depth (ppb) (ppt) (atomic x10−6) (measured) (activity) (uncorrected) (corrected) (corrected) (corrected) (mm)
11 338.8 0.5 1529 ±31 13 890.2 ±278 4189.4 ±5.8 3.8023 0.0068 115 696 ±373 115 677 ±373 5806.6 ±10 115 617 ±373 45 407.4 ±0.4 1242 ±25 19 793.7 ±397 3958.2 ±3.7 3.6593 0.0058 117 197 ±314 117 125 ±314 5258 ±11 117 065 ±314 80 50.6 ±0.1 128 ±3 25 978 ±522 4351.9 ±4.2 3.9865 0.0056 118 503 ±294 118 493 ±294 6080 ±8 118 433 ±294 105 612.5 ±0.7 48 ±2 828 184 ±26 136 4324 ±4 3.9716 0.0060 118 803 ±305 118 802 ±424 6046 ±7 118 740 ±424 144 404.5 ±0.5 1658 ±33 15 959 ±320 4306 ±5 3.9679 0.0060 119 264 ±325 119 247 ±325 6029 ±9 119 187 ±325 194 487.2 ±0.6 2128 ±43 14 944 ±300 4260.8 ±4.3 3.9600 0.0057 120 519 ±311 120 500 ±311 5987 ±8 120 440 ±311 212 416.1 ±0.5 1139 ±23 24 631 ±495 4368 ±4 4.0887 0.0061 122 641 ±320 121 629 ±442 6175 ±8 121 567 ±442 231 676.0 ±0.8 7134 ±143 6391 ±128 4366.4 ±4.1 4.0908 0.0059 122 811 ±314 122 769 ±316 6174 ±8 122 709 ±316 253 491.7 ±0.6 7723 ±155 4372 ±88 4420.1 ±4.5 4.1651 0.0060 124 317 ±328 124 254 ±330 6277 ±9 124 194 ±330 290 509 ±1 789 ±16 45 053.9 ±908 4487.8 ±4.7 4.2334 0.0075 125 006 ±390 124 999 ±390 6386 ±10 124 939 ±390
The error is 2σ.aδ234U=([234U/238U]activity−1)×1000.bδ234Uinitialwas calculated based on230Thage (T), i.e.,δ234Uinitial=δ234Umeasured×eλ234×T. Corrected230Thages assume the initial230Th/232Thatomic ratio of 4.4±2.2×10⁻⁶. Those are the values for a material at secular equilibrium, with the bulk Earth232Th/238Uvalue of 3.8. The errors are arbitrarily assumed to be 50 %.cBP stands for “before present” where the present is defined as the year AD 1950.
such as kinetic isotope effects during calcite precipitation, cave temperature, and the isotopic composition of the wa-ter vapor source may also be important. We consider these latter three factors first. Kinetic isotope effects are probably present in all speleothems (Daëron et al., 2011), yet kinetic effects can be minimized by sampling at the center of the sta-lagmite growth axis (Dreybrodt, 2008), which was done here. Another test of whether kinetic effects are important is the “Hendy test” (Hendy, 1971). For sample P10-H1, as noted, carbon and oxygen isotopic values along the growth axis are
not correlated (r2=0.06), indicating that kinetic effects are
not an important influence on oxygen isotope variations.
Figure 2 shows that the least negativeδ18O values for
P10-H1 occur from about 125 to 121 ka, during the penultimate interglacial period. The most negative values, about 4.8 ‰ lower, occur at about 115 ka, as Earth’s climate made the transition to the long glacial state that followed. Accompany-ing the transition to a glacial climate, mean annual air
tem-peratures likely decreased by, at most, 5◦C at the study site,
if we assume that the temperature change was less than or similar to that estimated for the transition of the Last Glacial Maximum (LGM) to Holocene (Porter, 2000). Cooler cave temperatures should lead to enriched oxygen isotope ratios in calcite, by about 1 ‰, due to an increase in the equilibrium calcite–water isotopic fractionation (Kim and O’Neil, 1997). In addition, the transition to a glacial climate resulted in in-creased global ice volume and an inin-creased oxygen isotope ratio of seawater of around 0.5 ‰ (using sea level estimates for the time period and a sea level / seawater isotopic ratios of about 0.1 ‰ / 10 m). The combined effect of these factors
would be to increase theδ18O value of speleothem calcite by
about 1.5 ‰. Thus, the observed change of 4.8 ‰ in P10-H1
records the minimum amplitude of changes inδ18O of
pre-cipitation and the effective change inδ18O of precipitation at
the site was approximately 6.3 ‰.
The relationship betweenδ18O of precipitation at the study
site and climate is as follows. During the South Ameri-can Summer Monsoon (SASM), as moisture is transported from the tropical Atlantic across the continent, rainout of
the heavy isotopes leads to highly depleted rainfall in the Amazon Basin. Via an “amount effect” a stronger SASM
leads to more negativeδ18O values in tropical South
Amer-ican rainfallδ18O (Vuille and Werner, 2005). Because the
moisture source for the central Peruvian Andes is the Ama-zon Basin (Garreaud et al., 2003), a similar relationship is observed for the tropical Andes, where local precipitation
δ18O is strongly anti-correlated to rainfall amount upstream
in the Amazon Basin (Hoffmann et al., 2003; Vimeux et al.,
2005) Theδ18O of precipitation at the study site is an
inte-grated signal of monsoon intensity along the entire moisture path from the eastern Amazon Basin to the Altiplano (Vuille and Werner, 2005; Vimeux et al., 2005). On orbital and mil-lennial timescales, paleoclimate studies have shown that the intensity of the SASM is related to changes in the latitudi-nal position of the Atlantic Intertropical Convergence Zone (ITCZ). A more southerly mean position of the ITCZ leads to increased SASM intensity (Seltzer et al., 2000; Cruz et
al., 2005). Thus, speleothemδ18O at the study site records
changes in the intensity of large-scale continental and mar-itime atmospheric convection, and more negative speleothem
δ18O indicates enhanced SASM activity, increased rainout,
and a more southerly position of the ITCZ.
Our record shows that the SASM was relatively weak during Marine Isotope Stage (MIS) 5.5, particularly during the last 2000 years of the interglacial period. The SASM strengthened rapidly, mainly in two approximately equal
steps, at 121 ka and at 117 ka. The most negativeδ18O
val-ues for P10-H1, around−17.0 ‰ between 117 and 116 ka,
are less than one per mil more enriched than samples from the same area during the LGM (Kanner et al., 2012).
Ad-ditionally, the ∼5 ‰ range δ18O observed in P10-H1 is
only slightly less than to the 5.5 ‰ change we observe in speleothems from this location from the LGM to the early Holocene (Kanner et al., 2013, 2012). Thus, the SASM was within 80–90 % of its maximum intensity over the last glacial cycle at 116 ka, equivalent to MIS 5.4.
an increase in summer insolation over the Amazon Basin, driving increased convective activity moisture transport. Nu-merous paleoclimate studies from the EASM, Indian Sum-mer Monsoon (ISM), and SASM regions (Cruz et al., 2005b; Fleitmann et al., 2003; Wang et al., 2008, 2005, 2001) and modeling results (Kutzbach, 1981; Kutzbach et al., 2008; Ziegler et al., 2010) indicate that the primary control on mon-soon precipitation is summer insolation changes that follow the precession of Earth’s orbit. The P10-H1 time series
paral-lels January insolation at 10◦S (Fig. 2), though the response
of the SASM to insolation is clearly nonlinear. The minimum in SASM intensity and the following increase lag insolation by a few thousand years (Fig. 2). The increase also occurs mainly in two steps, not smoothly. Maximum monsoon in-tensity, however, is reached at close to the maximum in
sum-mer insolation at 10◦S.
The nonlinear relationship between SASM intensity and insolation indicates that additional factors account for the timing and pace of low-latitude climate change. Paleoclimate studies of speleothem growth periods (Wang et al., 2008) and oxygen isotope ratios (Kanner et al., 2012) during the last glacial period demonstrate that the SASM increased rapidly in intensity during Heinrich events and during Greenland stadials. Conversely, the SASM was relatively weak during Greenland interstadials. These changes have been interpreted as reflecting millennial-scale shifts in the mean ITCZ posi-tion (e.g., Kanner et al., 2012), a hypothesis that is supported by modeling studies of the effect of land and sea ice on the ITCZ and Hadley circulation in which cooling of the high northern latitudes results in the establishment of an inter-hemispheric thermal gradient (Chiang and Friedman, 2012; Donohoe et al., 2012). Because the teleconnection between high and low latitudes is through the atmosphere, the re-sponse of low-latitude atmospheric circulation is very rapid (Schneider et al., 2014). In model studies, southward move-ment of the ITCZ in response to imposed Northern Hemi-sphere (NH) cooling occurs on the order of 1 decade (Chiang and Friedman, 2012). Analogous to changes observed for D– O events, the rapid increases in SASM (and the East Asian Summer Monsoon; EASM) intensity at 121 and 117 ka are likely due in large part to rapid increases in ice cover and decreases in temperature in the high northern latitudes that cause an almost immediate response in low-latitude atmo-spheric circulation. Thus, the observed low- and high-latitude climate changes are essentially synchronous.
4.2 Comparison to other records
4.2.1 Comparison to changes in East Asian Summer Monsoon
Our record of SASM changes over the transition from MIS 5.5 to 5.4 is mirrored to a remarkable degree by observed changes in the East Asian Monsoon (Fig. 2) as recorded in stalagmites from Dongge Cave in China (Kelly et al., 2006).
These records are shown on independent chronologies
es-tablished by U/Th dating, but with the scale forδ18O for
Dongge inverted (Fig. 2). During the later stages of MIS 5.5, the SASM is in a dry phase, while the EASM is in a wet phase. Isotopic values for both speleothems are fairly constant during MIS 5.5, with the exception of a small
de-crease of about 0.8 ‰ inδ18O values in Huagapo Cave that
is mirrored by an increase of about 0.5 ‰ in Hulu. Both D3 and P10-H1 show a rapid change of more than 2 ‰ at
120.8±0.5 ka, with a sudden increase in SASM intensity
and decrease in EASM intensity. In both records, the ma-jority of this change occurs over less than 600 years and possibly as fast as 200 years. The absolute chronologies of these two tropical speleothems indicate the end of the last interglacial period was associated with a very large, rapid change in tropical hydrology that is synchronous in both hemispheres within the error of the chronologies. The age es-timate for rapid climatic change that marks the end of the last interglacial period in Peru and Dongge Cave is also within
the dating error of speleothems from China, 119±0.6 ka
(Yuan et al., 2004), the European Alps, 118±2 ka (Meyer
et al., 2008), and the eastern Mediterranean, 119±3 ka
(Bar-Matthews et al., 2003). Following this rapid shift is a period of slower change from 121 to 117 ka during which both iso-topic time series parallel their respective summer insolation curves (Fig. 2). A second rapid shift is observed at 117 ka (117.5 in Dongge) with the SASM further strengthening and the EAM further weakening.
4.2.2 Comparison to ice core records
Figure 3 shows the P10-H1 data along withδ18O of ice from
the NGRIP ice core,δ18O of values of atmospheric oxygen
from the Vostok ice core and atmospheric methane concen-trations from the EPICA Dome C core. To incorporate more broadly the P10-H1 data with later changes in the SASM, we spliced data from stalagmite BT2 from Botuvera Cave in southern Brazil (Cruz et al., 2005) to the end of the P10-H1 record. As is the case for P10-H1, the oxygen isotopic values of BT2 are primarily a function of the intensity rainfall in the SASM (Cruz et al., 2005). The growth period of BT2 over-laps growth of P10-H1 for about 2000 years. To put both data
sets onto a commonδ18O scale, 12.5 ‰ was subtracted from
95000 100000 105000 110000 115000 120000 125000 130000
Age (y BP)
-17 -16 -15 -14 -13 -12 d
18O (VPDB)
-5 -6 -7 -8 -9 -10 d
18O (VPDB)
480 460 440 420 400
Jan 10S Insolation (W/m
2) -42 -40 -38 -36 -34 -32 d 18O(VSMOW) 400 450 500 550 600 650 700 EDC CH 4 (ppbv) 0.8 0.4 0 -0.4 d 18 O Atmosphere SASM NGRIP CH4
GIS 23 24 25
d18O Atm O
2
EASM
Figure 3.Oxygen isotope proxies for changes in the intensity of the South American Summer Monsoon, SASM (Cruz et al., 2005 and this paper), East Asian Monsoon, EASM (Kelly et al., 2006) and Greenland temperatures, NGRIP (Andersen et al., 2004), atmo-spheric methane concentrations from the EPICA Dome C ice core (Spahni et al., 2005), andδ18O values for atmospheric oxygen from
the Vostok ice core (Petit et al., 1999). The records are all on inde-pendent timescales.
102 ka and older than 114 ka. The portion of overlap between BT2 and P10-H1 was not adjusted.
The addition of a record of SASM intensity over the pe-riod of glacial inception and the early glacial pepe-riod leads to the following observations. The GISs 23, 24, and 25 all ap-pear to have a global signal, with increases in atmospheric methane and a decrease in SASM intensity associated with each. Nearly every D–O event found in the ice cores and speleothems is coupled with a parallel change in atmospheric methane (Chappellaz et al., 2013), with Greenland intersta-dials associated with higher methane concentrations. This re-lationship is also clearly present in the earliest stages of the glacial period, with GISs 24, 25, and 26 expressed as
posi-tiveδ18O excursions in H09-10b, and increases in methane
concentrations in the Vostok and EPICA Dome C ice cores (Fig. 3). By aligning the rapid changes in methane with
rapid changes inδ18O in the speleothems, a chronology for
changes in atmospheric gas concentrations can be established that is independent of age models for the ice cores themselves and independent of the lag in the age of trapped gases with respect to the ice itself. Based on the observed relationship between methane concentrations and millennial-scale events during MIS 3 from speleothems in the region (Kanner et al., 2012), the three methane peaks very likely are coeval with the millennial events in the tropics and with GIS 23, 24, and 25. If so, then either the GT4 chronology for Antarctic ice is a few thousand years too young, or the estimated gas age-ice age difference is too large by a similar amount.
Ice core atmospheric oxygenδ18O data from Vostok are
also shown in Fig. 3. Theδ18Oatm values reach a first
min-imum following MIS 5.5 that is coincident with the first minimum in atmospheric methane, which the speleothem chronologies place at 116 ka, just at the transition from Glacial Stadial (GS) 25 to GIS 25 (Landais et al., 2006). We show the EDC ice core methane record because it is higher resolution than Vostok methane (note that both are on the same timescale). The large change in tropical hydrology as-sociated with this decrease supports the hypothesis that on
millennial timescales,δ18Oatmresponds strongly to changes
in the monsoons (Bender et al., 1994; Hoffmann et al., 2004). It is also worth noting that in the EPICA Dome C ice core,
CO2concentrations remain above 260 ppmv through the
en-tire observed decrease in methane from 130 to 113 ka (GT4
timescale, or∼115 ka using the stalagmite timescale). Thus,
CO2remains above 260 ppmv during the entire period of NH
cooling and ice growth through the first minimum inδ18O
in stalagmites P10-H1 and D3 in Peru and China, respec-tively. These results are in accord with modeling studies that suggest that orbital forcing alone is sufficient to result in the growth of ice sheets in the Northern Hemisphere.
The timing of glacial inception recorded in the speleothems in both hemispheres, however, is considerably earlier, and, therefore, under conditions of higher summer in-solation than is usually used in modeling studies. Modeling results indicate that tropical hydrology responds very rapidly to ice sheet expansion (Chiang and Bitz, 2005; Broccoli et al., 2006). Thus, it is reasonable to infer from the speleothem
δ18O records that a rapid ice sheet growth began as early
as 120 ka, at approximately the mid-point in the insolation curve for NH summer insolation.
4.3 Implications for sea level reconstructions
The speleothemδ18O data and the accuracy of the dating of
is likely that this event would have impacted tropical hydrol-ogy, just as millennial-scale events did during glacial
peri-ods. We observe a nearly 1 ‰ increase in speleothemδ18O in
our Huagapo Cave record at 123 ka, coincident with an∼0.5
per mil decrease in the Hulu cave record (Kelly et al., 2006). These data suggest a significant weakening in the SASM and strengthening of the EASM, as models predict for a warming of the high northern latitudes and decrease in ice cover there. We suggest that the abrupt change in tropical hydrology is associated with the late MIS 5.5 sea level change observed in other archives.
A related question is the timing of ice accumulation and sea level fall at the end of MIS 5.5. The speleothem records indicate that the end of MIS 5.5 in the tropics, marked by a rapid weakening of the EASM and strengthening of the
SASM, occurred at 120.8±0.4 ka (dating errors on P10-01
are less than 400 years, those for speleothems D3 and D4
from Hulu are ∼1000 years). We infer that these changes
in the monsoon are a direct response to high northern lat-itude cooling and increasing ice cover. In contrast, coral records of the timing of the end of MIS 5.5 indicate that sea level remained at or above present sea level until 115– 117 ka (O’Leary et al., 2013; Dutton and Lambeck, 2012; Thompson et al., 2011). While it is not possible to make a direct estimate of sea level fall from the speleothem records, it is unlikely that the very large changes in tropical hydrol-ogy observed could have taken place without at least several meters of sea level equivalent ice growth. Thus, we suggest that the coral ages used to estimate the timing of sea level fall are several thousand years too young, and are more impacted
by diagenesis and the uncertainty in seawaterδ234U than is
commonly recognized.
5 Conclusions
A speleothem recovered from Huagapo cave in the Peruvian Andes records variations in the intensity of South American Summer Monsoon rainfall in the Amazon Basin from 125 to 114 ka, covering the transition from the penultimate inter-glacial period to the following inter-glacial period. SASM rain-fall was relatively low during the latter part of MIS 5.5, but increased rapidly at 120.8 ka as rapidly decreasing tempera-tures and increasing ice cover in the high northern latitudes, marking the beginning of the last glacial period, pushed the mean position of the ITCZ to the south. By 116.8 ka the SASM intensity was as high as at any other point during the entire last glacial period. Both the timing and pattern of changes in the SASM are mirrored to a high degree of fidelity by anti-phase changes in the East Asian Summer Monsoon. The timing of these changes in tropical hydrology thus re-veals the nature of the interglacial-to-glacial transition at low latitudes. A full tropical “glacial” state was reached before
any decrease in atmospheric CO2, suggesting that insolation
forcing alone is sufficient to terminate interglacial periods.
Acknowledgements. This work is supported by NSF grants ATM-1003466 to S. J. Burns, 0502535 and 1103403 to R. L. Ed-wards and H. Cheng. We thank Carlos Morales-Bermudez for his invaluable assistance in the field.
Edited by: D. Fleitmann
References
Andersen, K. K., Azuma, N., Barnola, J. M., Bigler, M., Biscaye, P., Caillon, N., Chappellaz, J., Clausen, H. B., Dahl-Jensen, D., and Fischer, H.: High-resolution record of Northern Hemisphere climate extending into the last interglacial period, Nature, 431, 147–151, 2004.
Bar-Matthews, M., Ayalon, A., Gilmour, M., Matthews, A., and Hawkesworth, C.: Sea-land oxygen isotopic relationships from planktonic foraminifera and speleothems in the Eastern Mediter-ranean region and their implication for paleorainfall during in-terglacial intervals, Geochim. Cosmochim. Acta, 67, 3181–3199, 2003.
Bender, M., Sowers, T., and Labeyrie, L.: The Dole Effect and its variations during the last 130 000 years as measured in the Vostok Ice Core, Global Biogeochem. Cy., 8, 363–376, 1994.
Berger, A.: Long-Term Variations of Daily Insolation and Quater-nary Climatic Changes, J. Atmos. Sci., 35, 2362–2367, 1978. Boch, R., Cheng, H., Spötl, C., Edwards, R. L., Wang, X., and
Häuselmann, P.: NALPS: a precisely dated European climate record 120–60 ka, Clim. Past, 7, 1247–1259, doi:10.5194/cp-7-1247-2011, 2011.
Broccoli, A. J., Dahl, K. A., and Stouffer, R. J.: Response of the ITCZ to Northern Hemisphere cooling, Geophys. Res. Lett., 33, L01702, doi:10.1029/2005GL024546, 2006.
Chappellaz, J., Stowasser, C., Blunier, T., Baslev-Clausen, D., Brook, E.J., Dallmayr, R., Faïn, X., Lee, J.E., Mitchell, L.E., Pascual, O., Romanini, D., Rosen, J., and Schüpbach, S.: High-resolution glacial and deglacial record of atmospheric methane by continuous-flow and laser spectrometer analysis along the NEEM ice core, Clim. Past, 9, 2579–2593, doi:10.5194/cp-9-2579-2013, 2013.
Cheng, H., Edwards, R.L., Broecker, W.S., Denton, G.H., Kong, X., Wang, Y., Zhang, R., and Wang, X.: Ice Age Terminations, Science, 326, 248–252, 2009a.
Cheng, H., Fleitmann, D., Edwards, R. L., Wang, X., Cruz, F. W., Auler, A. S., Mangini, A., Wang, Y., Kong, X., Burns, S. J., and Matter, A.: Timing and structure of the 8.2 kyr B.P. event inferred fromδ18O records of stalagmites from China, Oman, and Brazil,
Geology, 37, 1007–1010, 2009b.
Chiang, J. C. H. and Bitz, C. M.: Influence of high latitude ice cover on the marine Intertropical Convergence Zone, Clim. Dynam., 25, 477–496, 2005.
Chiang, J. C. H. and Friedman, A. R.: Extratropical Cooling, Inter-hemispheric Thermal Gradients, and Tropical Climate Change, Ann. Rev. Earth Planet. Sci., 40, 383–412, 2012.
Cruz, F. W., Burns, S. J., Karmann, I., Sharp, W. D., Vuille, M., Cardoso, A. O., Ferrari, J. A., Dias, P. L. S., and Viana, O.: Insolation-driven changes in atmospheric circulation over the past 116 000 years in subtropical Brazil, Nature, 434, 63–66, 2005b.
Daëron, M., Guo, W., Eiler, J., Genty, D., Blamart, D., Boch, R., Drysdale, R., Maire, R., Wainer, K., and Zanchetta, G.:
13C18O clumping in speleothems: Observations from
natu-ral caves and precipitation experiments, Geochim. Cosmochim. Acta, 75, 3303–3317, 2011.
Denton, G. H., Anderson, R. F., Toggweiler, J. R., Edwards, R. L., Schaefer, J. M., and Putnam, A. E.: The Last Glacial Termina-tion, Science, 328, 1652–1656, 2010.
Donohoe, A., Marshall, J., Ferreira, D., and Mcgee, D.: The Re-lationship between ITCZ Location and Cross-Equatorial Atmo-spheric Heat Transport: From the Seasonal Cycle to the Last Glacial Maximum, J. Climate, 26, 3597–3618, 2012.
Dreybrodt, W.: Evolution of the isotopic composition of carbon and oxygen in a calcite precipitating H2O–CO2–CaCO3
solu-tion and the related isotopic composisolu-tion of calcite in stalagmites, Geochim. Cosmochim. Acta, 72, 4712–4724, 2008.
Dutton, A. and Lambeck, K.: Ice Volume and Sea Level During the Last Interglacial, Science, 337, 216–219, 2012.
Fairchild, I., Smith, C., Baker, A., Fuller, L., Spotl, C., Mattey, D., and McDermott, F.: EIMP Modification and preservation of envi-ronmental signals in speleothems, Earth-Sci. Rev., 75, 105–153, 2006.
Fleitmann, D., Burns, S. J., Mudelsee, M., Neff, U., Kramers, J., Mangini, A., and Matter, A.: Holocene forcing of the Indian monsoon recorded in a stalagmite from Southern Oman, Science, 300, 1737–1739, 2003.
Garreaud, R., Vuille, M., and Clement, A. C.: The climate of the Altiplano: observed current conditions and mechanisms of past changes, Palaeogeogr. Palaeoclimatol. Palaeoecol., 194, 5–22, 2003.
Hendy, C.: The isotopic geochemistry of speleothems – I. The cal-culation of the effects of different modes of formation on the isotopic composition of speleothems and their applicability as palaeoclimatic indicators, Geochim. Cosmochim. Acta, 35, 801– 824, 1971.
Hoffmann, G., Cuntz, M., Weber, C., Ciais, P., Friedlingstein, P., Heimann, M., Jouzel, J., Kaduk, J., Maier-Reimer, E., Seibt, U., and Six, K.: A model of the Earth’s Dole effect, Global Bio-geochem. Cy., 18, GB1008, doi:10.1029/2003GB002059, 2004. Hoffmann, G., Ramirez, E., Taupin, J. D., Francou, B., Ribstein, P., Delmas, R., Dürr, H., Gallaire, R., Simões, J., Schotterer, U., Stievnard,M., and Werner, M. : Coherent isotope history of An-dean ice cores over the last century, Geophys. Res. Lett., 30, 1179–1183, doi:10.1029/2002GL014870, 2003.
Kanner, L. C., Burns, S. J., Cheng, H., and Edwards, R. L.: High-Latitude Forcing of the South American Summer Monsoon Dur-ing the Last Glacial, Science, 335, 570–573, 2012.
Kanner, L. C., Burns, S. J., Cheng, H., Edwards, R. L., and Vuille, M.: High-resolution variability of the South American sum-mer monsoon over the last seven millennia: insights from a speleothem record from the central Peruvian Andes, Quaternary Sci. Rev., 75, 1–10, 2013.
Kelly, M. J., Edwards, R. L., Cheng, H., Yuan, D., Cai, Y., Zhang, M., Lin, Y., and An, Z.: High resolution characterization of the
Asian Monsoon between 146,000 and 99,000 years BP from Dongge Cave, China and global correlation of events surround-ing Termination II, Palaeogeogr. Palaeoclimatol. Palaeoecol., 236, 20–38, 2006.
Kim, S.-T. and O’Neil, J. R.: Equilibrium and nonequilibrium oxygen isotope effects in synthetic carbonates, Geochim. Cos-mochim. Acta, 61, 3461–3475, 1997.
Kutzbach, J. E.: Monsoon climate of the early Holocene: climate ex-periment with the earth’s orbital parameters for 9000 years ago, Science, 214, 59–61, 1981.
Kutzbach, J. E., Liu, X., Liu, Z., and Chen, G.: Simulation of the evolutionary response of global summer monsoons to orbital forcing over the past 280 000 years, Clim. Dyn., 30, 567–579, 2008.
Lachniet, M. S.: Climatic and environmental controls on speleothem oxygen-isotope values, Quaternary Sci. Rev., 28, 412–432, 2009.
Landais, A., Masson-Delmotte, V., Jouzel, J., Raynaud, D., Johnsen, S., Huber, C., Leuenberger, M., Schwander, J., and Minster, B.: The glacial inception as recorded in the NorthGRIP Greenland ice core: timing, structure and associated abrupt temperature changes, Clim. Dynam., 26, 273–284, 2006.
Meyer, M. C., Spötl, C., and Mangini, A.: The demise of the Last Interglacial recorded in isotopically dated speleothems from the Alps, Quaternary Sci. Rev. 27, 476–496, 2008.
O’Leary, M. J., Hearty, P. J., Thompson, W. G., Raymo, M. E., Mitrovica, J. X., and Webster, J. M.: Ice sheet collapse following a prolonged period of stable sea level during the last interglacial, Nat. Geosci., 6, 796–800, 2013.
Petit, J. R., Jouzel, J., Raynaud, D., Barkov, N. I., Barnola, J.-M., Basile, I., Bender, M., Chappellaz, J., Davis, M., Delaygue, G., Delmotte, M., Kotlyakov, V. M., Legrand, M., Lipenkov, V. Y., Lorius, C., PÉpin, L., Ritz, C., Saltzman, E., and Stievenard, M.: Climate and atmospheric history of the past 420 000 years from the Vostok ice core, Antarctica, Nature, 399, 429–436, 1999. Porter, S. C.: Snowline depression in the tropics during the Last
Glaciation, Quaternary Sci. Rev., 20, 1067–1091, 2000. Schneider, T., Bischoff, T., and Haug, G. H.: Migrations and
dy-namics of the intertropical convergence zone, Nature, 513, 45– 53, 2014.
Seltzer, G., Rodbell, D., and Burns, S.: Isotopic evidence for late Quaternary climatic change in tropical South America, Geology, 28, 35–38, 2000.
Shakun, J. D., Clark, P. U., He, F., Marcott, S. A., Mix, A. C., Liu, Z., Otto-Bliesner, B., Schmittner, A., and Bard, E.: Global warm-ing preceded by increaswarm-ing carbon dioxide concentrations durwarm-ing the last deglaciation, Nature, 484, 49–54, 2012.
Spahni, R., Chappellaz, J., Stocker, T. F., Loulergue, L., Hausam-mann, G., Kawamura, K., Flückiger, J., Schwander, J., Raynaud, D., Masson-Delmotte, V., and Jouzel, J.: Atmospheric Methane and Nitrous Oxide of the Late Pleistocene from Antarctic Ice Cores, Science, 310, 1317–1321, 2005.
Thompson, W. G., Allen Curran, H., Wilson, M. A., and White, B.: Sea-level oscillations during the last interglacial highstand recorded by Bahamas corals, Nat. Geosci., 4, 684–687, 2011. Vimeux, F., Gallaire, R., Bony, S., Hoffmann, G., and Chiang, J. C.
H.: What are the climate controls onδDin precipitation in the
Vuille, M., and Werner, M.: Stable isotopes in precipitation record-ing South American summer monsoon and ENSO variability: ob-servations and model results, Clim. Dynam., 25, 401–413, 2005. Wang, Y., Cheng, H., Edwards, R. L., He, Y., Kong, X., An, Z., Wu, J., Kelly, M. J., Dykoski, C. A., and Li, X.: The Holocene Asian monsoon: links to solar changes and North Atlantic climate, Sci-ence, 308, 854–857, 2005.
Wang, Y., Cheng, H., Edwards, R. L., Kong, X., Shao, X., Chen, S., Wu, J., Jiang, X., Wang, X., and An, Z.: Millennial-and orbital-scale changes in the East Asian monsoon over the past 224 000 years, Nature, 451, 1090–1093, 2008.
Wang, Y. J., Cheng, H., Edwards, R. L., An, Z. S., Wu, J. Y., Shen, C. C., and Dorale, J. A.: A high-resolution absolute-dated late Pleistocene monsoon record from Hulu Cave, China, Science, 294, 2345–2348, 2001.
Yuan, D., Cheng, H., Edwards, R., Dykoski, C., Kelly, M., Zhang, M., Qing, J., Lin, Y., Wang, Y., Wu, J., Dorale, J., An, Z., and Cai, Y.: Timing, duration, and transitions of the Last Interglacial Asian Monsoon, Science, 304, 575–578, 2004.